But leaving all that aside, and leaving aside my personal feeling that masks are more of a placebo than anything, I am willing to lean on my previously stated understanding of national compromise and don the mask. I’m even willing to admit that I might be wrong about my feelings on masks. I will concede all of that. The problem is that the other side of this debate isn’t willing to concede a single inch. All or nothing is a dangerous game, especially when it is only one side that agrees to it. Reasonable people who are forced into unreasonable acts can only be stretched so far. When they snap they will retreat to “nothing” and then that’s when real problems start. We can already see that happening.
As Edit0r-at-Large for a major online publication, I am not only tasked with staying abreast of the statistics and data connected to COVID, my writers are having daily, extended conversations about the information regarding the virus, transmission and fatality rates and recovery rates. In fact, we report factual statistics most corporate media sites have never published at all. There is a constant distillation of the issue going on behind the scenes here every single day.
I say this to explain that while I’m no Expert Scientist™, I am informed. I also believe that my willingness to compromise demonstrates an ability to reason effectively. So it has become infuriating, to the point of feeling untenable, that the “lockdown indefinitely” crowd has become so unhinged as to label people like me morons, “deniers” and pro-murder because we find the reaction to this virus outsized and dangerous.
But Kira, you can’t compromise on DEATH! Why do you hate the elderly????
Can’t we? We compromise on death every day, pandemic or not. We calculate the risk to drive our vehicles, attend events, get on airplanes. We use a complicated equation based on what facts we know, our fears and our goals. If this virus had the fatality rate we were promised in the beginning, extended lockdowns might…might…be defensible. But we are looking at a virus with a 99.6% survivability rate. For the elderly that rate is certainly different. The solution is not to quarantine the healthy. We’ve never done that. Ever.
The solution is to quarantine the sick, encourage healthy habits and safe interactions among the healthy, and GET THE HELL ON WITH LIVING WHILE WE’RE STILL ALIVE.
We are shutting down schools when the total number of child fatalities in the entire nation stands somewhere between ten and two, depending on how you count COVID deaths. Even the Mayo Clinic says nearly all children who get the virus will never even show symptoms or only experience mild symptoms.
But Kira, the teachers and the staff are more vulnerable. Why do you hate teachers???
There are many teachers and staff who feel just fine about returning to the classroom. In K-12 education, teachers tend to skew younger and have a much lower risk. Of course, that shifts quite a bit when it comes to college professors. Invite those who feel comfortable to return to campus with the students. Those who don’t feel comfortable should Zoom in to the classroom, ideally one supervised by aides and subs. The unions are always begging for more hires. This seems like a no-brainer.
But Kira, nearly 200,000 people are dead because of COVID. Why do you hate people???
I have made my case for my informed status on this issue. I know the numbers. We are far, far, far, far, far, far shy of the 3-5 million deaths Fauci and co. promised in the beginning of all this. Even with quarantine measures we were told millions would still die. In a population of 325 million, 174,000 is statistically negligible.
But Kira, you heartless monster! How can you say you don’t care about all those people who died?
And herein lies the rub, the very heart of this rant today. I have no belief whatsoever that those screaming at me about how little I care for the lives of others actually care for the lives of those others themselves. My opinion that a virus with a 99.6% survivability rate should not bring a successful society to a screeching halt does not denote my malice for my fellow Americans. Quite the opposite.
I care very much about the daily suffering I see as people lose their jobs, businesses, and even their mental stability to this ridiculous response.
I have been patient. I have been a good citizen. I have done everything asked of me. I have tried to be gracious to those who insult my intelligence and qualifications simply because I don’t see things their way. I have tried to understand that people are scared and that not everyone has all the information and I can’t force them to have it. I have chosen the path of acceptance for those who rage and seethe and hiss all day on social media about people like me, people who have the audacity to even suggest perhaps it’s time for citizens to be making these decisions for themselves. I have genuinely tried to be the bigger person. I don’t post memes insulting people who want to wear masks, even as many of my friends and family regularly and smugly post memes insulting those of us who have questions about it all.
But I’ve had enough. The fact that we even have the space or notion to argue about the responses to this virus tells me that indeed this virus is not the apocalypse we were told it would be. I will not be judged or labeled as heartless for a simple reading of the facts available to me. I will not be told I don’t care about people when all I do all day long is worry for people and pray for people and entreat God to protect our people. I will not be shamed as a murderer for thinking maybe it’s time to start living again.
The scare du jour is about Greenland Ice Sheet (GIS) and how it will melt out and flood us all. It’s declared that GIS has passed its tipping point, and we are doomed. Typical is the Phys.org hysteria: Sea level rise quickens as Greenland ice sheet sheds record amount: “Greenland’s massive ice sheet saw a record net loss of 532 billion tonnes last year, raising red flags about accelerating sea level rise, according to new findings.”
Panic is warranted only if you treat this as proof of an alarmist narrative and ignore the facts and context in which natural variation occurs. For starters, consider the last four years of GIS fluctuations reported by DMI and summarized in the eight graphs above. Note the noisy blue lines showing how the surface mass balance (SMB) changes its daily weight by 8 or 10 gigatonnes (Gt) around the baseline mean from 1981 to 2010. Note also the summer decrease between May and August each year before recovering to match or exceed the mean.
The other four graphs show the accumulation of SMB for each of the last four years including 2020. Tipping Point? Note that in both 2017 and 2018, SMB ended about 500 Gt higher than the year began, and way higher than 2012, which added nothing. Then came 2019 dropping below the mean, but still above 2012. Lastly, this year is matching the 30-year average. Note also that the charts do not integrate from previous years; i.e. each year starts at zero and shows the accumulation only for that year. Thus the gains from 2017 and 2018 do not result in 2019 starting the year up 1000 Gt, but from zero.
While they may appear solid, all ice sheets—which are essentially giant glaciers—experience movement: ice flows downslope either through the process of deformation or sliding. The latest results suggest that the movement of the ice on the GIS is dominated by sliding, not deformation. This process is moving ice to the marginal zones of the sheet, where melting occurs, at a much faster rate.
“The study was motivated by a major unknown in how the ice of Greenland moves from the cold interior, to the melting regions on the margins,” Neil Humphrey, a professor of geology from the University of Wyoming and author of the study, told Newsweek. “The ice is known to move both by sliding over the bedrock under the ice, and by oozing (deforming) like slowly flowing honey or molasses. What was unknown was the ratio between these two modes of motion—sliding or deforming.
“This lack of understanding makes predicting the future difficult, since we know how to calculate the flowing, but do not know much about sliding,” he said. “Although melt can occur anywhere in Greenland, the only place that significant melt can occur is in the low altitude margins. The center (high altitude) of the ice is too cold for the melt to contribute significant water to the oceans; that only occurs at the margins. Therefore ice has to get from where it snows in the interior to the margins.
“The implications for having high sliding along the margin of the ice sheet means that thinning or thickening along the margins due to changes in ice speed can occur much more rapidly than previously thought,” Maier said. “This is really important; as when the ice sheet thins or thickens it will either increase the rate of melting or alternatively become more resilient in a changing climate.“
“There has been some debate as to whether ice flow along the edges of Greenland should be considered mostly deformation or mostly sliding,” Maier says. “This has to do with uncertainty of trying to calculate deformation motion using surface measurements alone. Our direct measurements of sliding- dominated motion, along with sliding measurements made by other research teams in Greenland, make a pretty compelling argument that no matter where you go along the edges of Greenland, you are likely to have a lot of sliding.”
The sliding ice does two things, Humphrey says. First, it allows the ice to slide into the ocean and make icebergs, which then float away. Two, the ice slides into lower, warmer climate, where it can melt faster.
While it may sound dire, Humphrey notes the entire Greenland Ice Sheet is 5,000 to 10,000 feet thick.
“In a really big melt year, the ice sheet might melt a few feet. It means Greenland is going to be there another 10,000 years,” Humphrey says. “So, it’s not the catastrophe the media is overhyping.”
Humphrey has been working in Greenland for the past 30 years and says the Greenland Ice Sheet has only melted 10 feet during that time span.
Summary
The Greenland ice sheet is more than 1.2 miles thick in most regions. If all of its ice was to melt, global sea levels could be expected to rise by about 25 feet. However, this would take more than 10,000 years at the current rates of melting.
Background from Previous Post: Greenland Glaciers: History vs. Hysteria
The modern pattern of environmental scares started with Rachel Carson’s Silent Spring claiming chemicals are killing birds, only today it is windmills doing the carnage. That was followed by ever expanding doomsday scenarios, from DDT, to SST, to CFC, and now the most glorious of them all, CO2. In all cases the menace was placed in remote areas difficult for objective observers to verify or contradict. From the wilderness bird sanctuaries, the scares are now hiding in the stratosphere and more recently in the Arctic and Antarctic polar deserts. See Progressively Scaring the World (Lewin book synopsis)
The advantage of course is that no one can challenge the claims with facts on the ground, or on the ice. Correction: Scratch “no one”, because the climate faithful are the exception. Highly motivated to go to the ends of the earth, they will look through their alarmist glasses and bring back the news that we are indeed doomed for using fossil fuels.
A recent example is a team of researchers from Dubai (the hot and sandy petro kingdom) going to Greenland to report on the melting of Helheim glacier there. The article is NYUAD team finds reasons behind Greenland’s glacier melt. Excerpts in italics with my bolds.
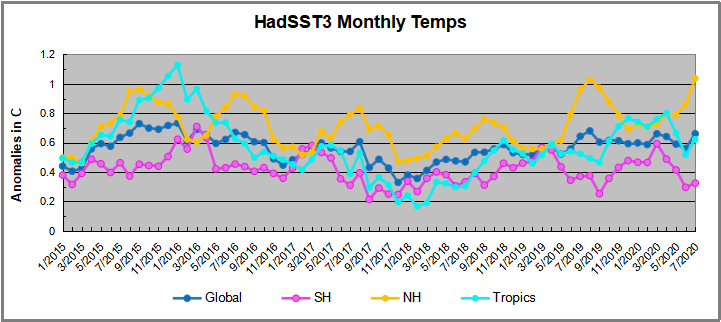
First the study and findings:
For the first time, warm waters that originate in the tropics have been found at uniform depth, displacing the cold polar water at the Helheim calving front, causing an unusually high melt rate. Typically, ocean waters near the terminus of an outlet glacier like Helheim are at the freezing point and cause little melting.
NYUAD researchers, led by Professor of Mathematics at NYU’s Courant Institute of Mathematical Sciences and Principal Investigator for NYU Abu Dhabi’s Centre for Sea Level Change David Holland, on August 5, deployed a helicopter-borne ocean temperature probe into a pond-like opening, created by warm ocean waters, in the usually thick and frozen melange in front of the glacier terminus.
Normally, warm, salty waters from the tropics travel north with the Gulf Stream, where at Greenland they meet with cold, fresh water coming from the polar region. Because the tropical waters are so salty, they normally sink beneath the polar waters. But Holland and his team discovered that the temperature of the ocean water at the base of the glacier was a uniform 4 degrees Centigrade from top to bottom at depth to 800 metres. The finding was also recently confirmed by Nasa’s OMG (Oceans Melting Greenland) project.
“This is unsustainable from the point of view of glacier mass balance as the warm waters are melting the glacier much faster than they can be replenished,” said Holland.
Surface melt drains through the ice sheet and flows under the glacier and into the ocean. Such fresh waters input at the calving front at depth have enormous buoyancy and want to reach the surface of the ocean at the calving front. In doing so, they draw the deep warm tropical water up to the surface, as well.
All around Greenland, at depth, warm tropical waters can be found at many locations. Their presence over time changes depending on the behaviour of the Gulf Stream. Over the last two decades, the warm tropical waters at depth have been found in abundance. Greenland outlet glaciers like Helheim have been melting rapidly and retreating since the arrival of these warm waters.
Then the Hysteria and Pledge of Alligiance to Global Warming
“We are surprised to learn that increased surface glacier melt due to warming atmosphere can trigger increased ocean melting of the glacier,” added Holland. “Essentially, the warming air and warming ocean water are delivering a troubling ‘one-two punch’ that is rapidly accelerating glacier melt.”
My comment: Hold on.They studied effects from warmer ocean water gaining access underneath that glacier. Oceans have roughly 1000 times the heat capacity of the atmosphere, so the idea that the air is warming the water is far-fetched. And remember also that long wave radiation of the sort that CO2 can emit can not penetrate beyond the first millimeter or so of the water surface. So how did warmer ocean water get attributed to rising CO2? Don’t ask, don’t tell. And the idea that air is melting Arctic glaciers is also unfounded.
Consider the basics of air parcels in the Arctic.
The central region of the Arctic is very dry. Why? Firstly because the water is frozen and releases very little water vapour into the atmosphere. And secondly because (according to the laws of physics) cold air can retain very little moisture.
Greenland has the only veritable polar ice cap in the Arctic, meaning that the climate is even harsher (10°C colder) than at the North Pole, except along the coast and in the southern part of the landmass where the Atlantic has a warming effect. The marked stability of Greenland’s climate is due to a layer of very cold air just above ground level, air that is always heavier than the upper layers of the troposphere. The result of this is a strong, gravity-driven air flow down the slopes (i.e. catabatic winds), generating gusts that can reach 200 kph at ground level.
Arctic air temperatures Some history and scientific facts are needed to put these claims in context. Let’s start with what is known about Helheim Glacier.
Holocene history of the Helheim Glacier, southeast Greenland
Helheim Glacier ranks among the fastest flowing and most ice discharging outlets of the Greenland Ice Sheet (GrIS). After undergoing rapid speed-up in the early 2000s, understanding its long-term mass balance and dynamic has become increasingly important. Here, we present the first record of direct Holocene ice-marginal changes of the Helheim Glacier following the initial deglaciation. By analysing cores from lakes adjacent to the present ice margin, we pinpoint periods of advance and retreat. We target threshold lakes, which receive glacial meltwater only when the margin is at an advanced position, similar to the present. We show that, during the period from 10.5 to 9.6 cal ka BP, the extent of Helheim Glacier was similar to that of todays, after which it remained retracted for most of the Holocene until a re-advance caused it to reach its present extent at c. 0.3 cal ka BP, during the Little Ice Age (LIA). Thus, Helheim Glacier’s present extent is the largest since the last deglaciation, and its Holocene history shows that it is capable of recovering after several millennia of warming and retreat. Furthermore, the absence of advances beyond the present-day position during for example the 9.3 and 8.2 ka cold events as well as the early-Neoglacial suggest a substantial retreat during most of the Holocene.
The topography of Greenland shows why its ice cap has persisted for millenia despite its southerly location. It is a bowl surrounded by ridges except for a few outlets, Helheim being a major one.
Helheim Glacier is the fastest flowing glacier along the eastern edge of Greenland Ice Sheet and one of the island’s largest ocean-terminating rivers of ice. Named after the Vikings’ world of the dead, Helheim has kept scientists on their toes for the past two decades. Between 2000 and 2005, Helheim quickly increased the rate at which it dumped ice to the sea, while also rapidly retreating inland- a behavior also seen in other glaciers around Greenland. Since then, the ice loss has slowed down and the glacier’s front has partially recovered, readvancing by about 2 miles of the more than 4 miles it had initially retreated.
NASA has compiled a time series of airborne observations of Helheim’s changes into a new visualization that illustrates the complexity of studying Earth’s changing ice sheets. NASA uses satellites and airborne sensors to track variations in polar ice year after year to figure out what’s driving these changes and what impact they will have in the future on global concerns like sea level rise.
Since 1997, NASA has collected data over Helheim Glacier almost every year during annual airborne surveys of the Greenland Ice Sheet using an airborne laser altimeter called the Airborne Topographic Mapper (ATM). Since 2009 these surveys have continued as part of Operation IceBridge, NASA’s ongoing airborne survey of polar ice and its longest-running airborne mission. ATM measures the elevation of the glacier along a swath as the plane files along the middle of the glacier. By comparing the changes in the height of the glacier surface from year to year, scientists estimate how much ice the glacier has lost.
The animation begins by showing the NASA P-3 plane collecting elevation data in 1998. The laser instrument maps the glacier’s surface in a circular scanning pattern, firing laser shots that reflect off the ice and are recorded by the laser’s detectors aboard the airplane. The instrument measures the time it takes for the laser pulses to travel down to the ice and back to the aircraft, enabling scientists to measure the height of the ice surface. In the animation, the laser data is combined with three-dimensional images created from IceBridge’s high-resolution camera system. The animation then switches to data collected in 2013, showing how the surface elevation and position of the calving front (the edge of the glacier, from where it sheds ice) have changed over those 15 years.
Helheim’s calving front retreated about 2.5 miles between 1998 and 2013. It also thinned by around 330 feet during that period, one of the fastest thinning rates in Greenland.
“The calving front of the glacier most likely was perched on a ledge in the bedrock in 1998 and then something altered its equilibrium,” said Joe MacGregor, IceBridge deputy project scientist. “One of the most likely culprits is a change in ocean circulation or temperature, such that slightly warmer water entered into the fjord, melted a bit more ice and disturbed the glacier’s delicate balance of forces.”
Update September 1, 2020 Greenland Ice Math
Prompted by comments from Gordon Walleville, let’s look at Greenland ice gains and losses in context. The ongoing SMB (surface mass balance) estimates ice sheet mass net from melting and sublimation losses and precipitation gains. Dynamic ice loss is a separate calculation of calving chunks of ice off the edges of the sheet, as discussed in the post above. The two factors are combined in a paper Forty-six years of Greenland Ice Sheet mass balance from 1972 to 2018 by Mouginot et al. (2019) Excerpt in italics. (“D” refers to dynamic ice loss.)
Greenland’s SMB averaged 422 ± 10 Gt/y in 1961–1989 (SI Appendix, Fig. S1H). It decreased from 506 ± 18 Gt/y in the 1970s to 410 ± 17 Gt/y in the 1980s and 1990s, 251 ± 20 Gt/y in 2010–2018, and a minimum at 145 ± 55 Gt/y in 2012. In 2018, SMB was above equilibrium at 449 ± 55 Gt, but the ice sheet still lost 105 ± 55 Gt, because D is well above equilibrium and 15 Gt higher than in 2017. In 1972–2000, D averaged 456 ± 1 Gt/y, near balance, to peak at 555 ± 12 Gt/y in 2018. In total, the mass loss increased to 286 ± 20 Gt/y in 2010–2018 due to an 18 ± 1% increase in D and a 48 ± 9% decrease in SMB. The ice sheet gained 47 ± 21 Gt/y in 1972–1980, and lost 50 ± 17 Gt/y in the 1980s, 41 ± 17 Gt/y in the 1990s, 187 ± 17 Gt/y in the 2000s, and 286 ± 20 Gt/y in 2010–2018 (Fig. 2). Since 1972, the ice sheet lost 4,976 ± 400 Gt, or 13.7 ± 1.1 mm SLR.
Doing the numbers: Greenland area 2.1 10^6 km2 80% ice cover, 1500 m thick in average- That is 2.5 Million Gton. Simplified to 1 km3 = 1 Gton
The estimated loss since 1972 is 5000 Gt (rounded off), which is 110 Gt a year. The more recent estimates are higher, in the 200 Gt range.
200 Gton is 0.008 % of the Greenland ice sheet mass.
Annual snowfall: From the Lost Squadron, we know at that particular spot, the ice increase since 1942 – 1990 was 1.5 m/year ( Planes were found 75 m below surface) Assume that yearly precipitation is 100 mm / year over the entire surface. That is 168000 Gton. Yes, Greenland is Big! Inflow = 168,000Gton. Outflow is 168,200 Gton.
So if that 200 Gton rate continued, (assuming as models do, despite air photos showing fluctuations), that ice loss would result in a 1% loss of Greenland ice in 800 years. (H/t Bengt Abelsson)
Comment:
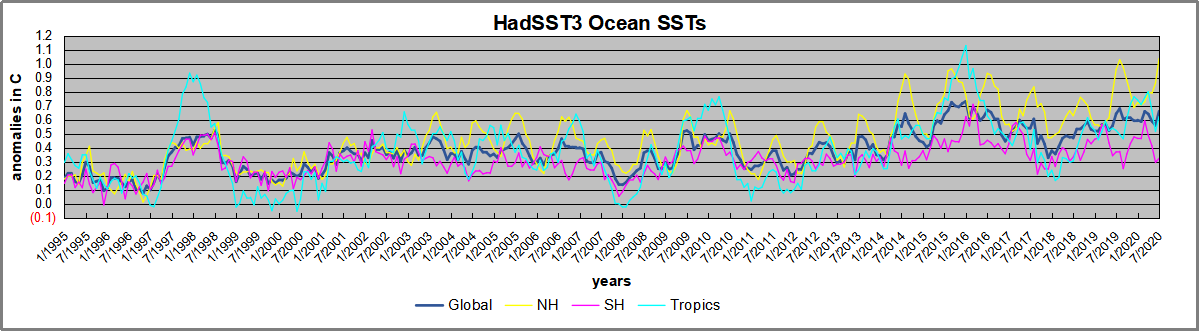
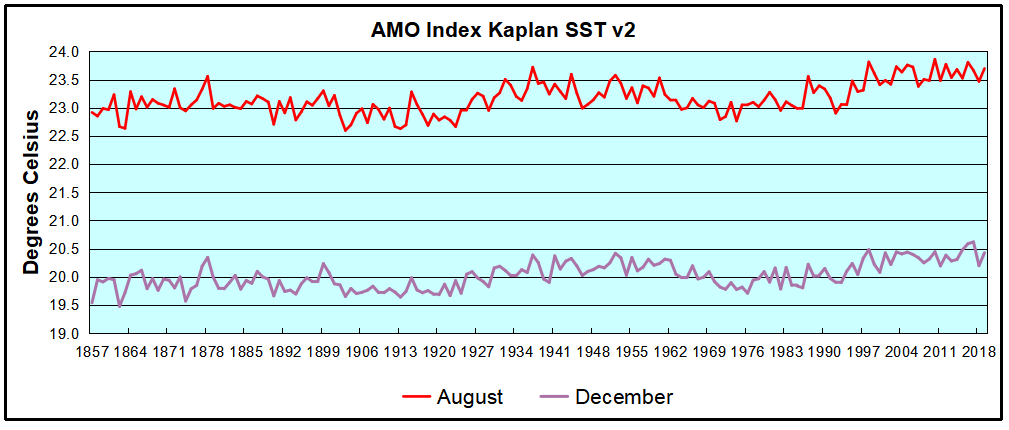
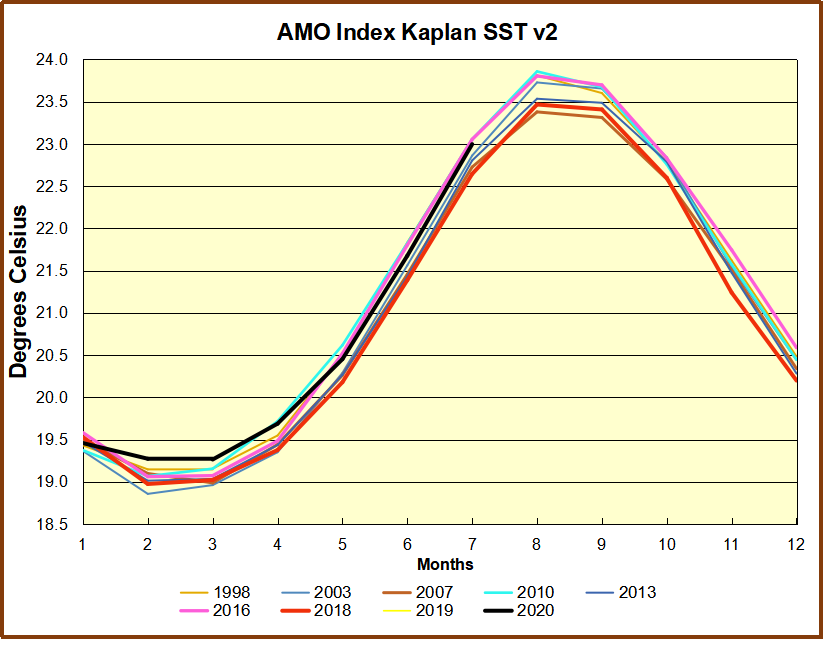
Once again, history is a better guide than hysteria. Over time glaciers advance and retreat, and incursions of warm water are a key factor. Greenland ice cap and glaciers are part of the Arctic self-oscillating climate system operating on a quasi-60 year cycle.
Over the first three years of his Administration, President Donald J. Trump used a combination of tax cuts, deregulation, energy dominance, and fair trade deals to build one of the most robust and resilient economies in American history. As a result of these growth-inducing policies,by January 20, 2020 – the day the Chinese Communist Party confirmed human-to-human transmission of SARS-CoV-2 – the United States economy was at full employment,1 real wages were rising,2 and black and Hispanic Americans were enjoying record low unemployment rates. 3.
Since that time, SARS-CoV-2 – hereinafter referred to as the China Virus – has taken a horrific toll. Over 160,000 Americans have died.4 As many as 18 million Americans are currently unemployed.5 Trillions of dollars of fiscal and monetary stimuli have been expended to combat the sharpest and deepest economic downturn in U.S. history. 6
Today, the U.S. economy is also in the midst of profound structural changes in sectors heavily impacted by the China Virus such as airlines and mass transit, casinos and gaming, K-12 and higher education, hospitality and leisure, oil and gas drilling, and sports and entertainment. These structural impacts could have long-lasting consequences.
Just how did this happen? And how is President Trump using the Defense Production Act (DPA) and related tools such as the 2020 Coronavirus Aid, Relief, and Economic Security (CARES) Act to protect the American people from the China Virus? This report seeks to answer these questions.
Table of Contents
The Chinese Communist Party Causes a Global Pandemic
Overview of the Defense Production Act.
The Strategic National Stockpile and DPA Mission
Executive Orders and Presidential Memoranda
Using DPA Title I to Attack the China Virus
Using DPA Title III to Attack the China Virus
CARES Act and PPP Funding to Supplement DPA Efforts
Patriotic Companies Answering the Call to Duty
Conclusion
The China Virus outbreak is an invisible enemy unlike any in modern history. The intentional shielding of the outbreak by the Chinese Communist Party and World Health Organization virtually ensured the outbreak of a global pandemic that has killed over 160,000 Americans and inflicted great damage on the American economy.
Using the DPA and other authorities, President Trump has moved quickly to protect the American people and defend our industrial base. His aggressive use of the DPA has not only saved American lives during this pandemic. It is helping to protect and secure America’s production and distribution of our essential medicines and critical medical equipment and supplies.
On Aug. 10 the FDA denied the urgent request for emergency approval for COVID-19 outpatient preventive and early treatment use of hydroxychloroquine (HCQ) filed July 1 by Dr. John McKinnon’s team at Henry Ford Hospital in Detroit, supported by Dr. Peter McCullough’s cardiology team at Baylor Heart and Vascular Institute in Dallas.
Approximately 48,000 more Americans have died during the FDA’s 48-day delay since this Emergency Use Authorization (EUA) was requested on July 1. Dr. McKinnon’s clinical trial found an impressive 51% reduction in deaths if HCQ was begun within 24 hours of admission to the hospital.
An outpatient primary care study by Dr. Vladimir Zelenko, using HCQ, azithromycin and zinc given within less than seven days of COVID-19 symptoms, showed approximately 80% decrease in deaths, and less than 1% of his patients needed to be hospitalized. These extraordinary results show how many lives can be saved with early HCQ treatment.
Dr. Harvey Risch, Yale epidemiologist, projected that widespread early treatment for COVID-19 with HCQ could have saved 100,000 American lives.
The physician head of the FDA, Dr. Steven Hahn, has again betrayed physicians and patients by preventing Americans from having the “right to try” HCQ for early COVID-19 treatment. Dr. Hahn knows full well the FDA approved HCQ as safe in 1955, and it has been used in millions of patients worldwide for 65 years with an impressive track record of safety in patients of all ages, all ethnic groups, and even pregnant women and nursing mothers.
The FDA’s denial of the EUA for early outpatient COVID-19 use of HCQ continues the agency’s false narrative in claiming outpatient harm for HCQ, based on inpatient data in critically ill patients. Dr. Hahn has ignored established facts of effectiveness and lack of harm for outpatients that have been established in more than 50 recent studies.
A newly released study from Turkeyfound no cardiac abnormalities with HCQ given at therapeutic doses for five days in early COVID patients. Attributing any late-stage cardiac effects to HCQ that is known to be caused by the virus and inflammatory damage is indefensible.
What amount of “data” will ever satisfy Dr. Hahn?
The FDA used a standard of “may be effective” for the rapid May 1 EUA given to the experimental anti-viral remdesivir, based on one controlled clinical trial terminated early. Yet FDA is now requiring a higher standard of a randomized controlled clinical trial for the already FDA-approved HCQ in safe use for 65 years. Remdesivir showed very little benefit shown in hospitalized COVID patients and had serious side effects.
Nine of the members of the NIH panel relied on for COVID treatment advice were supported financially by Gilead Sciences, maker of remdesivir.
As a cancer specialist, Dr. Hahn knows early treatment of any disease is critical, especially viral illness. But it is more critical with COVID-19, or SARS CoV-2, as we learned in 2005 when National Institutes of Health (NIH) and Centers for Disease Control and Prevention (CDC) published their studies from the 2002 outbreak of the closely related SARS-CoV-1 virus. These laboratory tests of possible anti-viral medicines clearly showed potent antiviral effects of chloroquine (CQ) against SARS-CoV-1 to block the SARS-CoV-1 infection at the earliest stage. Dr. Fauci was at NIH them, so he has known about this work for more than 15 years.
From these studies we know that HCQ with zinc works during the first five days to stop viral entry into our cells and to block the virus from multiplying.
Without HCQ and zinc, by day six or seven the viral load explodes and then triggers an exaggerated inflammatory response. This “cytokine storm” can severely damage critical organs: lungs, kidneys, heart, brain, liver and intestines and is often fatal.
Earlier this year, Dr. Peter McCullough’s team showed prophylactic benefits of HCQ given to hospital workers who were exposed to COVID daily in their work, just as found in India, South Korea, China and multiple other countries.
This preventive benefit of HCQ given once a week could protect front-line medical workers, law enforcement officers, paramedics, clergy, dentists/dental hygienists, truck drivers, food-processing workers, teachers, behavioral health professionals, factory and grocery store workers, flight attendants and many others. We could more safely reopen America’s businesses, schools and churches with doctors and patients having widespread, early access to HCQ.
Doctors treating COVID-19 patients NOW see lives being saved by cheap, safe, FDA-approved medicines – hydroxychloroquine with azithromycin or doxycycline, plus supplemental zinc, vitamin C and vitamin D.
Why don’t Americans have the freedom to use HCQ here as in other countries?
The FDA’s misleading statements about HCQ have led to dangerous, unprecedented restrictions on physicians’ off-label prescribing rights imposed by state governors, medical boards and pharmacy boards. The supply of HCQ has been ramped up to handle its use in early treatment of COVID. The Strategic National Stockpile has millions of doses deteriorating in government warehouses that are not being distributed because doctors are prevented for political reasons from prescribing for outpatients with COVID-19.
Americans are dying needlessly for political and financial agendas waiting for the “magic bullet” of a vaccine, not due to lack of available treatment for COVID-19. We still need therapeutics, such as HCQ, even if a vaccine works and is safe.
Testing is inaccurate and often unavailable, and HCQ dispensing must not be limited to persons with a positive test. Such limits also prevent prophylactic use. Governors and bureaucrats must not be allowed to arbitrarily restrict life-saving HCQ treatment.
The Fauci-Hahn strategies of suppressing the positive studies of HCQ effectiveness for outpatient use, while focusing on mandatory mask edicts and continued shutdowns of businesses, schools and churches are not controlling the pandemic. These political agendas have eroded our constitutional freedoms and devastated our financial, psychological, physical and spiritual well-being – while costing 1,000 American lives every day.
Dr. Hahn needs to be held accountable for the preventable deaths caused on his watch. As a physician licensed in three states that prevent prescribing HCQ for my patients, I submitted a formal request to the chairman of Senate Oversight Committee on Homeland Security and Governmental Affairs (HSGAC) for Dr. Hahn to be called before the Committee to produce the data on which the FDA is claiming “harm” in using HCQ for outpatients in the mild stage of COVID, but no such harm for RA, Lupus, or malaria. FDA’s hypocrisy ignores their own safety data, basic science, clinical studies and common sense.
Americans must speak out and demand the medical freedom to consult their physicians and decide treatment options without government interference.
Yoram Hazony explains the dire situation in USA, with global implications in his essay The Challenge of Marxism at The Quillette. Excerpts in italics with my bolds.
We don’t know what will happen for certain. But based on the experience of recent years, we can venture a pretty good guess. Institutional liberalism lacks the resources to contend with this threat. Liberalism is being expelled from its former strongholds, and the hegemony of liberal ideas, as we have known it since the 1960s, will end. Anti-Marxist liberals are about to find themselves in much the same situation that has characterized conservatives, nationalists, and Christians for some time now: They are about to find themselves in the opposition.
This means that some brave liberals will soon be waging war on the very institutions they so recently controlled. They will try to build up alternative educational and media platforms in the shadow of the prestigious, wealthy, powerful institutions they have lost. Meanwhile, others will continue to work in the mainstream media, universities, tech companies, philanthropies, and government bureaucracy, learning to keep their liberalism to themselves and to let their colleagues believe that they too are Marxists—just as many conservatives learned long ago how to keep their conservatism to themselves and let their colleagues believe they are liberals.
This is the new reality that is emerging. There is blood in the water and the new Marxists will not rest content with their recent victories. In America, they will press their advantage and try to seize the Democratic Party. They will seek to reduce the Republican Party to a weak imitation of their own new ideology, or to ban it outright as a racist organization. And in other democratic countries, they will attempt to imitate their successes in America. No free nation will be spared this trial. So let us not avert our eyes and tell ourselves that this curse isn’t coming for us. Because it is coming for us.
In this essay, I would like to offer some initial remarks about the new Marxist victories in America—about what has happened and what’s likely to happen next. (See article at red link above for parts I to V)
VI. The Marxist endgame and democracy’s end
The most basic thing one needs to know about a democratic regime, then, is this: You need to have at least two legitimate political parties for democracy to work. By a legitimate political party, I mean one that is recognized by its rivals as having a right to rule if it wins an election. For example, a liberal party may grant legitimacy to a conservative party (even though they don’t like them much), and in return this conservative party may grant legitimacy to a liberal party (even though they don’t like them much). Indeed, this is the way most modern democratic nations have been governed.
But legitimacy is one of those traditional political concepts that Marxist criticism is now on the verge of destroying.
From the Marxist point of view, our inherited concept of legitimacy is nothing more than an instrument the ruling classes use to perpetuate injustice and oppression. The word legitimacy takes on its true meaning only with reference to the oppressed classes or groups that the Marxist sees as the sole legitimate rulers of the nation. In other words, Marxist political theory confers legitimacy on only one political party—the party of the oppressed, whose aim is the revolutionary reconstitution of society. And this means that the Marxist political framework cannot co-exist with democratic government. Indeed, the entire purpose of democratic government, with its plurality of legitimate parties, is to avoid the violent reconstitution of society that Marxist political theory regards as the only reasonable aim of politics.
Simply put, the Marxist framework and democratic political theory are opposed to one another in principle.
A Marxist cannot grant legitimacy to liberal or conservative points of view without giving up the heart of Marxist theory, which is that these points of view are inextricably bound up with systematic injustice and must be overthrown, by violence if necessary. This is why the very idea that a dissenting opinion—one that is not “Progressive” or “Anti-Racist”—could be considered legitimate has disappeared from liberal institutions as Marxists have gained power. At first, liberals capitulated to their Marxist colleagues’ demand that conservative viewpoints be considered illegitimate (because conservatives are “authoritarian” or “fascist”). This was the dynamic that brought about the elimination of conservatives from most of the leading universities and media outlets in America.
But by the summer of 2020, this arrangement had run its course. In the United States, Marxists were now strong enough to demand that liberals fall into line on virtually any issue they considered pressing. In what were recently liberal institutions, a liberal point of view has likewise ceased to be legitimate. This is the meaning of the expulsion of liberal journalists from the New York Times and other news organisations. It is the reason that Woodrow Wilson’s name was removed from buildings at Princeton University, and for similar acts at other universities and schools. These expulsions and renamings are the equivalent of raising a Marxist flag over each university, newspaper, and corporation in turn, as the legitimacy of the old liberalism is revoked.
Until 2016, America sill had two legitimate political parties. But when Donald Trump was elected president, the talk of his being “authoritarian” or “fascist” was used to discredit the traditional liberal point of view, according to which a duly elected president, the candidate chosen by half the public through constitutional procedures, should be accorded legitimacy. Instead a “resistance” was declared, whose purpose was to delegitimize the president, those who worked with him, and those who voted for him.
I know that many liberals believe that this rejection of Trump’s legitimacy was directed only at him, personally. They believe, as a liberal friend wrote to me recently, that when this particular president is removed from office, America will be able to return to normal.
But nothing of the sort is going to happen.
The Marxists who have seized control of the means of producing and disseminating ideas in America cannot, without betraying their cause, confer legitimacy on any conservative government. And they cannot grant legitimacy to any form of liberalism that is not supine before them. This means that whatever President Trump’s electoral fortunes, the “resistance” is not going to end. It is just beginning.
With the Marxist conquest of liberal institutions, we have entered a new phase in American history (and, consequently, in the history of all democratic nations). We have entered the phase in which Marxists, having conquered the universities, the media, and major corporations, will seek to apply this model to the conquest of the political arena as a whole.
How will they do this? As in the universities and the media, they will use their presence within liberal institutions to force liberals to break the bonds of mutual legitimacy that bind them to conservatives—and therefore to two-party democracy. They will not demand the delegitimization of just President Trump, but of all conservatives. We’ve already seen this in the efforts to delegitimize the views of Senators Josh Hawley, Tom Cotton, and Tim Scott, as well as the media personality Tucker Carlson and others. Then they will move on to delegitimizing liberals who treat conservative views as legitimate, such as James Bennet, Bari Weiss, and Andrew Sullivan. As was the case in the universities and media, many liberals will accommodate these Marxist tactics in the belief that by delegitimizing conservatives they can appease the Marxists and turn them into strategic allies.
But the Marxists will not be appeased because what they’re after is the conquest of liberalism itself—already happening as they persuade liberals to abandon their traditional two-party conception of political legitimacy, and with it their commitment to a democratic regime. The collapse of the bonds of mutual legitimacy that have tied liberals to conservatives in a democratic system of government will not make the liberals in question Marxists quite yet. But it will make them the supine lackeys of these Marxists, without the power to resist anything that “Progressives” and “Anti-Racists” designate as being important.
And it will get them accustomed to the coming one-party regime, in which liberals will have a splendid role to play—if they are willing to give up their liberalism.
I know that many liberals are confused, and that they still suppose there are various alternatives before them. But it isn’t true. At this point, most of the alternatives that existed a few years ago are gone. Liberals will have to choose between two alternatives: either they will submit to the Marxists, and help them bring democracy in America to an end. Or they will assemble a pro-democracy alliance with conservatives. There aren’t any other choices.
Photo illustration by Slate. Photos by Thinkstock.
A glance at the news aggregator shows the silly season is in full swing. A partial listing of headlines proclaiming the hottest whatever.
Record-crushing heat, fire tornadoes and freak thunderstorms: The weather is wild in the West The Washington Post15:50
Tesla asks owners to help ‘relieve stress on grid’ during heat wave in California, charge… Electrek15:47
Death Valley’s 130-degree Heat Wave May Have Set a 107-year Record Travel & Leisure
Newsom Signs Emergency Proclamation to Free Up Energy Amid Heat Wave NBC Bay Area, California14:10
Dozens of heat records set to be broken this week as Western heat wave continues CNN14:10
Okanagan weather: Mid-30 degree heat to continue for early part of week Global News13:58
Heat Wave To Continue Through Thursday In San Diego County Patch13:40
Death Valley hits an insane 130 degrees, threatens heat records CNET13:18
Sunday brings more record highs as heat lingers Ventura County Star, California EU13:08
As West Coast Faces Historic Heat Wave & Energy Shortages, Governor Newsom Signs Heat Emergency Proclamation to Free Up … California State Portal (Press Release)13:00
California in grip of extreme weather: Broiling heat, fire tornadoes, lightning, blackouts Los Angeles Times11:29
Heat Wave Harvey? Push To Name Extreme Heat Events Warming Up KUER-FM11:20
Heat warnings posted for parts of B.C. as temperature records tumble The Globe and Mail10:49
Heat warnings issued for most of Alberta CBC.ca10:46
US heat wave leads to ‘hottest temperature ever’ and firenados CBBC Newsround07:34
2019 State of the Climate Report: Peak greenhouse gases and record heat EarthSky06:56
Should We Name Heat Waves Like We Name Hurricanes? Planet Friendly News06:41
Meteorologists are extending the heat warning Prague Monitor04:35
Worst Heat Wave in Years Sets Three Temperature Records in LA County NBC Los Angeles02:35
Worst Heat in 70 Years Threatens to Take Down California’s Grid BNN Bloomberg02:15
Heat Wave Grips S. Korea KBS World Radio00:54
Records Tumble As San Francisco Bay Area Swelters Under Stifling Heat Wave CBS San Francisco23:31 Sun, 16 Aug
Sofia Richie Beats Southern California Heat Wave At The Beach In Pink Thong Bikini The Inquisitr23:25 Sun, 16 Aug
After Record Breaking Heat, A Gradual Cooldown In Washington Patch23:21 Sun, 16 Aug
Heat waves, tropical nights to continue this week The Korea Herald22:47 Sun, 16 Aug
Thunderstorms and excessive heat fuel wildfires in California CBS News22:21 Sun, 16 Aug
Heat wave grips South Korea as monsoon season ends Bernama22:14 Sun, 16 Aug
Las Vegas reaches 113 again, ties 1939 record as heat wave continues Las Vegas Review-Journal22:04 Sun, 16 Aug
This past decade was the hottest decade in Earth’s history CNN03:50 Fri, 14 Aug
Last Decade Was Earth’s Hottest On Record UNILAD13:27 Thu, 13 Aug 111-Degree High Forecasted Next Week, Would Be One Of
Sacramento’s Hottest Days Ever CBS Sacramento13:27 Thu, 13 Aug
NWS warns this will be the ‘hottest weekend of the year’ in… San Antonio Express, Texas11:46 Thu, 13 Aug
July 2020 was record hot for N. Hemisphere, 2nd hottest for planet National Oceanic and Atmospheric Administration10:59 Thu, 13 Aug
London is experiencing its hottest weather since the ’60s Time Out London10:49 Thu, 13 Aug
Record shattered for hottest week in Dutch history NL Times10:29 Thu, 13 Aug
Belgium records hottest week in history Anadolu Agency10:00 Thu, 13 Aug
The 2010s were Earth’s hottest decade on record TheJournal.ie07:25 Thu, 13 Aug
Last year was one of the hottest since records began, ending the hottest decade SBS22:21 Wed, 12 Aug
2019 the hottest year on earth since records began, ending the hottest decade SBS21:51 Wed, 12 Aug
Last decade was hottest on record as climate crisis accelerates The Independent21:25 Wed, 12 Aug
Hottest night in 25 YEARS recorded in Reading Reading Chronicle14:03 Wed, 12 Aug
London sees hottest stretch since 1960s BBC12:09 Wed, 12 Aug
Last decade was Earth’s hottest on record as climate crisis accelerates The Guardian11:56 Wed, 12 Aug
Time for some Clear Thinking about Heat Records (Previous Post)
Here is an analysis using critical intelligence to interpret media reports about temperature records this summer. Daniel Engber writes in Slate Crazy From the Heat
The subtitle is Climate change is real. Record-high temperatures everywhere are fake. As we shall see from the excerpts below, The first sentence is a statement of faith, since as Engber demonstrates, the notion does not follow from the temperature evidence. Excerpts in italics with my bolds.
It’s been really, really hot this summer. How hot? Last Friday, the Washington Post put out a series of maps and charts to illustrate the “record-crushing heat.” All-time temperature highs have been measured in “scores of locations on every continent north of the equator,” the article said, while the lower 48 states endured the hottest-ever stretch of temperatures from May until July.
These were not the only records to be set in 2018. Historic heat waves have been crashing all around the world, with records getting shattered in Japan, broken on the eastern coast of Canada, smashed in California, and rewritten in the Upper Midwest. A city in Algeria suffered through the highest high temperature ever recorded in Africa. A village in Oman set a new world record for the highest-ever low temperature. At the end of July, the New York Times ran a feature on how this year’s “record heat wreaked havoc on four continents.” USA Today reported that more than 1,900 heat records had been tied or beaten in just the last few days of May.
While the odds that any given record will be broken may be very, very small, the total number of potential records is mind-blowingly enormous.
There were lots of other records, too, lots and lots and lots—but I think it’s best for me to stop right here. In fact, I think it’s best for all of us to stop reporting on these misleading, imbecilic stats. “Record-setting heat,” as it’s presented in news reports, isn’t really scientific, and it’s almost always insignificant. And yet, every summer seems to bring a flood of new superlatives that pump us full of dread about the changing climate. We’d all be better off without this phony grandiosity, which makes it seem like every hot and humid August is unparalleled in human history. It’s not. Reports that tell us otherwise should be banished from the news.
It’s true the Earth is warming overall, and the record-breaking heat that matters most—the kind we’d be crazy to ignore—is measured on a global scale. The average temperature across the surface of the planet in 2017 was 58.51 degrees, one-and-a-half degrees above the mean for the 20th century. These records matter: 17 of the 18 hottest years on planet Earth have occurred since 2001, and the four hottest-ever years were 2014, 2015, 2016, and 2017. It also matters that this changing climate will result in huge numbers of heat-related deaths. Please pay attention to these terrifying and important facts. Please ignore every other story about record-breaking heat.
You’ll often hear that these two phenomena are related, that local heat records reflect—and therefore illustrate—the global trend. Writing in Slate this past July, Irineo Cabreros explained that climate change does indeed increase the odds of extreme events, making record-breaking heat more likely. News reports often make this point, linking probabilities of rare events to the broader warming pattern. “Scientists say there’s little doubt that the ratcheting up of global greenhouse gases makes heat waves more frequent and more intense,” noted the Times in its piece on record temperatures in Algeria, Hong Kong, Pakistan, and Norway.
Yet this lesson is subtler than it seems. The rash of “record-crushing heat” reports suggest we’re living through a spreading plague of new extremes—that the rate at which we’re reaching highest highs and highest lows is speeding up. When the Post reports that heat records have been set “at scores of locations on every continent,” it makes us think this is unexpected. It suggests that as the Earth gets ever warmer, and the weather less predictable, such records will be broken far more often than they ever have before.
But that’s just not the case. In 2009, climatologist Gerald Meehl and several colleagues published an analysis of records drawn from roughly 2,000 weather stations in the U.S. between 1950 and 2006. There were tens of millions of data points in all—temperature highs and lows from every station, taken every day for more than a half-century. Meehl searched these numbers for the record-setting values—i.e., the days on which a given weather station saw its highest-ever high or lowest-ever low up until that point. When he plotted these by year, they fell along a downward-curving line. Around 50,000 new heat records were being set every year during the 1960s; then that number dropped to roughly 20,000 in the 1980s, and to 15,000 by the turn of the millennium.
From Meehl et al 2009.
This shouldn’t be surprising. As a rule, weather records will be set less frequently as time goes by. The first measurement of temperature that’s ever taken at a given weather station will be its highest (and lowest) of all time, by definition. There’s a good chance that the same station’s reading on Day 2 will be a record, too, since it only needs to beat the temperature recorded on Day 1. But as the weeks and months go by, this record-setting contest gets increasingly competitive: Each new daily temperature must now outdo every single one that came before. If the weather were completely random, we might peg the chances of a record being set at any time as 1/n, where n is the number of days recorded to that point. In other words, one week into your record-keeping, you’d have a 1 in 7 chance of landing on an all-time high. On the 100th day, your odds would have dropped to 1 percent. After 56 years, your chances would be very, very slim.
The weather isn’t random, though; we know it’s warming overall, from one decade to the next. That’s what Meehl et al. were looking at: They figured that a changing climate would tweak those probabilities, goosing the rate of record-breaking highs and tamping down the rate of record-breaking lows. This wouldn’t change the fundamental fact that records get broken much less often as the years go by. (Even though the world is warming, you’d still expect fewer heat records to be set in 2000 than in 1965.) Still, one might guess that climate change would affect the rate, so that more heat records would be set than we’d otherwise expect.
That’s not what Meehl found. Between 1950 and 2006, the rate of record-breaking heat seemed unaffected by large-scale changes to the climate: The number of new records set every year went down from one decade to the next, at a rate that matched up pretty well with what you’d see if the odds were always 1/n. The study did find something more important, though: Record-breaking lows were showing up much less often than expected. From one decade to the next, fewer records of any kind were being set, but the ratio of record lows to record highs was getting smaller over time. By the 2000s, it had fallen to about 0.5, meaning that the U.S. was seeing half as many record-breaking lows as record-breaking highs. (Meehl has since extended this analysis using data going back to 1930 and up through 2015. The results came out the same.)
What does all this mean? On one hand, it’s very good evidence that climate change has tweaked the odds for record-breaking weather, at least when it comes to record lows. (Other studies have come to the same conclusion.) On the other hand, it tells us that in the U.S., at least, we’re not hitting record highs more often than we were before, and that the rate isn’t higher than what you’d expect if there weren’t any global warming. In fact, just the opposite is true: As one might expect, heat records are getting broken less often over time, and it’s likely there will be fewer during the 2010s than at any point since people started keeping track.
This may be hard to fathom, given how much coverage has been devoted to the latest bouts of record-setting heat. These extreme events are more unusual, in absolute terms, than they’ve ever been before, yet they’re always in the news. How could that be happening?
While the odds that any given record will be broken may be very, very small, the total number of potential records that could be broken—and then reported in the newspaper—is mind-blowingly enormous. To get a sense of how big this number really is, consider that the National Oceanic and Atmospheric Administration keeps a database of daily records from every U.S. weather station with at least 30 years of data, and that its website lets you search for how many all-time records have been set in any given stretch of time. For instance, the database indicates that during the seven-day period ending on Aug. 17—the date when the Washington Post published its series of “record-crushing heat” infographics—154 heat records were broken.
That may sound like a lot—154 record-high temperatures in the span of just one week. But the NOAA website also indicates how many potential records could have been achieved during that time: 18,953. In actuality, less than one percent of these were broken. You can also pull data on daily maximum temperatures for an entire month: I tried that with August 2017, and then again for months of August at 10-year intervals going back to the 1950s. Each time the query returned at least about 130,000 potential records, of which one or two thousand seemed to be getting broken every year. (There was no apparent trend toward more records being broken over time.)
Now let’s say there are 130,000 high-temperature records to be broken every month in the U.S. That’s only half the pool of heat-related records, since the database also lets you search for all-time highest low temperatures. You can also check whether any given highest high or highest low happens to be a record for the entire month in that location, or whether it’s a record when compared across all the weather stations everywhere on that particular day.
Add all of these together and the pool of potential heat records tracked by NOAA appears to number in the millions annually, of which tens of thousands may be broken. Even this vastly underestimates the number of potential records available for media concern. As they’re reported in the news, all-time weather records aren’t limited to just the highest highs or highest lows for a given day in one location. Take, for example, the first heat record mentioned in this column, reported in the Post: The U.S. has just endured the hottest May, June, and July of all time. The existence of that record presupposes many others: What about the hottest April, May and June, or the hottest March, April, and May? What about all the other ways that one might subdivide the calendar?
Geography provides another endless well of flexibility. Remember that the all-time record for the hottest May, June, and July applied only to the lower 48 states. Might a different set of records have been broken if we’d considered Hawaii and Alaska? And what about the records spanning smaller portions of the country, like the Midwest, or the Upper Midwest, or just the state of Minnesota, or just the Twin Cities? And what about the all-time records overseas, describing unprecedented heat in other countries or on other continents?
Even if we did limit ourselves to weather records from a single place measured over a common timescale, it would still be possible to parse out record-breaking heat in a thousand different ways. News reports give separate records, as we’ve seen, for the highest daily high and the highest daily low, but they also tell us when we’ve hit the highest average temperature over several days or several weeks or several months. The Post describes a recent record-breaking streak of days in San Diego with highs of at least 83 degrees. (You’ll find stories touting streaks of daily highs above almost any arbitrary threshold: 90 degrees, 77 degrees, 60 degrees, et cetera.) Records also needn’t focus on the temperature at all: There’s been lots of news in recent weeks about the fact that the U.K. has just endured its driest-ever early summer.
“Record-breaking” summer weather, then, can apply to pretty much any geographical location, over pretty much any span of time. It doesn’t even have to be a record—there’s an endless stream of stories on “near-record heat” in one place or another, or the “fifth-hottest” whatever to happen in wherever, or the fact that it’s been “one of the hottest” yadda-yaddas that yadda-yadda has ever seen. In the most perverse, insane extension of this genre, news outlets sometimes even highlight when a given record isn’t being set.
Loose reports of “record-breaking heat” only serve to puff up muggy weather and make it seem important. (The sham inflations of the wind chill factor do the same for winter months.) So don’t be fooled or flattered by this record-setting hype. Your summer misery is nothing special.
Summary
This article helps people not to confuse weather events with climate. My disappointment is with the phrase, “Climate Change is Real,” since it is subject to misdirection. Engber uses that phrase referring to rising average world temperatures, without explaining that such estimates are computer processed reconstructions since the earth has no “average temperature.” More importantly the undefined “climate change” is a blank slate to which a number of meanings can be attached.
Some take it to mean: It is real that rising CO2 concentrations cause rising global warming. Yet that is not supported by temperature records. Others think it means: It is real that using fossil fuels causes global warming. This too lacks persuasive evidence. Over the last five decades the increase in fossil fuel consumption is dramatic and monotonic, steadily increasing by 234% from 3.5B to 11.7B oil equivalent tons. Meanwhile the GMT record from Hadcrut shows multiple ups and downs with an accumulated rise of 0.74C over 53 years, 5% of the starting value.
Others know that Global Mean Temperature is a slippery calculation subject to the selection of stations.
Graph showing the correlation between Global Mean Temperature (Average T) and the number of stations included in the global database. Source: Ross McKitrick, U of Guelph
Global warming estimates combine results from adjusted records. Conclusion
The pattern of high and low records discussed above is consistent with natural variability rather than rising CO2 or fossil fuel consumption. Those of us not alarmed about the reported warming understand that “climate change” is something nature does all the time, and that the future is likely to include periods both cooler and warmer than now.
We live in a culture that has uncritically accepted that every domain of life is political, and that even things we think are not political are so, that all human enterprises are merely power struggles, that even the idea of “truth” is a fantasy, and really a matter of imposing one’s view on others. For a while, some held out hope that science remained an exception to this. That scientists would not bring their personal political biases into their science, and they would not be mobbed if what they said was unwelcome to one faction or another. But the sordid 2020 drama of hydroxychloroquine—which saw scientists routinely attacked for critically evaluating evidence and coming to politically inconvenient conclusions—has, for many, killed those hopes.
Phase 1 of the pandemic saw the near collapse of the credible authority of much of our public health officialdom at the highest levels, led by the exposure of the corruption of the World Health Organization. The crisis was deepened by the numerous reversals on recommendations, which led to the growing belief that too many officials were interpreting, bending, or speaking about the science relevant to the pandemic in a politicized way. Phase 2 is equally dangerous, for it shows that politicization has started to penetrate the peer review process, and how studies are reported in scientific journals, and of course in the press.
What is unique about the hydroxychloroquine discussion is that it is a story of “unwishful thinking”—to coin a term for the perverse hope that some good outcome that most sane people would earnestly desire, will never come to pass. It’s about how, in the midst of a pandemic, thousands started earnestly hoping—before the science was really in—that a drug, one that might save lives at a comparatively low cost, would not actually do so. Reasonably good studies were depicted as sloppy work, fatally flawed. Many have excelled in making counterfeit bills that look real, but few have excelled at making real bills look counterfeit. As such, as we sort this out, we shall observe not only some “tricks” about how to make bad studies look like good ones, but also how to make good studies look like bad ones. And why should anyone facing a pandemic wish to discredit potentially lifesaving medications? Well, in fact, this ability can come in very handy in this midst of a plague, when many medications and vaccines are competing to Save the World—and for the billions of dollars that will go along with that.
So this story is twofold. It’s about the discussion that unfolded (and is still unfolding) around hydroxychloroquine, but if you’re here for a definitive answer to a narrow question about one specific drug (“does hydroxychloroquine work?”), you will be disappointed. Because what our tale is really concerned with is the perilous state of vulnerability of our scientific discourse, models, and institutions—which is arguably a much bigger, and more urgent problem, since there are other drugs that must be tested for safety and effectiveness (most complex illnesses like COVID-19 often require a group of medications) as well as vaccines, which would be slated to be given to billions of people. “This misbegotten episode regarding hydroxychloroquine will be studied by sociologists of medicine as a classic example of how extra-scientific factors overrode clear-cut medical evidence,” Yale professor of epidemiology Harvey A. Risch recently argued. Why not start studying it now?
Norman Doige tells the story in some detail (see article link in red at the top)
the history of quinine, chloroquine, and HCQ medical effectiveness;
how HCQ was used against SARS CV2 early on;
how Raoult was the one in his lab who came up with the idea of combining the two older drugs, HCQ and azithromycin, for COVID-19;
the criticisms of the French studies exemplifying “unwishful thinking”;
Trump’s interest in HCQ and the media backlash against the medicine;
the failure of ICU treatment protocols with ventilators and no alternatives to off-label prescribing;
the insistence upon Randomized Controlled Trials (RCTs) as the only valid test for HCQ;
the confounding factors in such studies and the problems replicating RCT results; and,
the publication in high-profile journals of studies structured for HCQ to fail to help infected patients.
Conclusion from Doige
Lots and lots of COVID-19 studies will come out—several hundred are in the works. People will hope more and more accumulating numbers—and more big data—will settle it. But big data, interpreted by people who have never treated any of the patients involved can be dangerous, a kind of exalted nonsense. It’s an old lesson: Quantity is not quality.
On this, I favor the all-available-evidence approach, which understands that large studies are important, but also that the medication that might be best for the largest number of people may not be best one for an individual patient. In fact, it would be typical of medicine that a number of different medications will be needed for COVID-19, and that there will be interactions of some with patient’s existing medications or conditions, so that the more medications we have to choose from, the better. We should be giving individual clinicians on the front lines the usual latitude to take account of their individual patient’s condition, and preferences, and encourage these physicians to bring to bear everything they have learned and read (they have been trained to read studies), and continue to read, but also what they have seen with their own eyes. Unlike medical bureaucrats or others who issue decrees from remote places physicians are literally on our front lines—actually observing the patients in question, and a Hippocratic Oath to serve them—and not the Lancet or WHO or CNN.
As contentious as this debate has been, and as urgent as the need for informed and timely information seems now, the reason to understand what happened with HCQ is for what it reflects about the social context within which science is now produced:
a landscape overly influenced by technology and its obsession with big data abstraction over concrete, tangible human experience;
academics who increasingly see all human activities as “political” power games, and so in good conscience can now justify inserting their own politics into academic pursuits and reporting;
extraordinarily powerful pharmaceutical companies competing for hundreds of billions of dollars;
politicians competing for pharmaceutical dollars as well as public adoration—both of which come these days too much from social media; and,
the decaying of the journalistic and scholarly super-layers that used to do much better holding everyone in this pyramid accountable, but no longer do, or even can.
If you think this year’s controversy is bad, consider that hydroxychloroquine is given to relatively few people with COVID-19, all sick, many with nothing to lose. It enters the body, and leaves fairly quickly, and has been known to us for decades. COVID vaccines, which advocates will want to be mandatory and given to all people—healthy and not, young and old—are being rushed past their normal safety precautions and regulations, and the typical five-to-10-year observation period is being waived to get “Operation Warp Speed” done as soon as possible.
This is being done with the endorsement of public health officials—the same ones, in many cases who are saying HCQ is suddenly extremely dangerous.
Philosophically, and psychologically, it is a fantastic spectacle to behold, a reversal, the magnitude and the chutzpah of which must inspire awe: a public health establishment, showing extraordinary risk aversion to medications and treatments that are extremely well known, and had been used by billions, suddenly throwing caution to the wind and endorsing the rollout of treatments that are entirely novel—and about which we literally can’t possibly know anything, as regards to their long-term effects. Their manufacturers know this well themselves, which is why they have aimed for, insisted on, and have already been granted indemnification—guaranteed, by those same public health officials and government that they will not be held legally accountable should their product cause injury.
From unheard of extremes of caution and “unwishful thinking,” to unheard of extremes of risk-taking, and recklessly wishful thinking, this double standard, this about-face, is not happening because this issue of public safety is really so complex a problem that only our experts can understand it; it is happening because there is, right now, a much bigger problem: with our experts, and with the institutions that we had trusted to help solve our most pressing scientific and medical problems.
Unless these are attended to, HCQ won’t be remembered simply as that major medical issue that no one could agree on, and which left overwhelming controversy, confusion, and possibly unnecessary deaths of tens of thousands in its wake; it will be one of many in a chain of such disasters.
Norman Doidge, a contributing writer for Tablet, is a psychiatrist, psychoanalyst, and author of The Brain That Changes Itself and The Brain’s Way of Healing.
The map shows that in Canada 9206 deaths have been attributed to Covid19, meaning people who died having tested positive for SARS CV2 virus. This number accumulated over a period of 198 days starting January 31. The daily death rate reached a peak of 177 on May 6, 2020, and is down to 6 as of yesterday. More details on this below, but first the summary picture. (Note: 2019 is the latest demographic report)
Canada Pop
Ann Deaths
Daily Deaths
Risk per Person
2019
37589262
330786
906
0.8800%
Covid 2020
37589262
9206
46
0.0245%
Over the epidemic months, the average Covid daily death rate amounted to 5% of the All Causes death rate. During this time a Canadian had an average risk of 1 in 5000 of dying with SARS CV2 versus a 1 in 114 chance of dying regardless of that infection. As shown later below the risk varied greatly with age, much lower for younger, healthier people.
Background Updated from Previous Post
In reporting on Covid19 pandemic, governments have provided information intended to frighten the public into compliance with orders constraining freedom of movement and activity. For example, the above map of the Canadian experience is all cumulative, and the curve will continue upward as long as cases can be found and deaths attributed. As shown below, we can work around this myopia by calculating the daily differentials, and then averaging newly reported cases and deaths by seven days to smooth out lumps in the data processing by institutions.
A second major deficiency is lack of reporting of recoveries, including people infected and not requiring hospitalization or, in many cases, without professional diagnosis or treatment. The only recoveries presently to be found are limited statistics on patients released from hospital. The only way to get at the scale of recoveries is to subtract deaths from cases, considering survivors to be in recovery or cured. Comparing such numbers involves the delay between infection, symptoms and death. Herein lies another issue of terminology: a positive test for the SARS CV2 virus is reported as a case of the disease COVID19. In fact, an unknown number of people have been infected without symptoms, and many with very mild discomfort.
August 7 in the UK it was reported (here) that around 10% of coronavirus deaths recorded in England – almost 4,200 – could be wiped from official records due to an error in counting. Last month, Health Secretary Matt Hancock ordered a review into the way the daily death count was calculated in England citing a possible ‘statistical flaw’. Academics found that Public Health England’s statistics included everyone who had died after testing positive – even if the death occurred naturally or in a freak accident, and after the person had recovered from the virus. Numbers will now be reconfigured, counting deaths if a person died within 28 days of testing positive much like Scotland and Northern Ireland…
Professor Heneghan, director of the Centre for Evidence-Based Medicine at Oxford University, who first noticed the error, told the Sun:
‘It is a sensible decision. There is no point attributing deaths to Covid-19 28 days after infection…
For this discussion let’s assume that anyone reported as dying from COVD19 tested positive for the virus at some point prior. From the reasoning above let us assume that 28 days after testing positive for the virus, survivors can be considered recoveries.
Recoveries are calculated as cases minus deaths with a lag of 28 days. Daily cases and deaths are averages of the seven days ending on the stated date. Recoveries are # of cases from 28 days earlier minus # of daily deaths on the stated date. Since both testing and reports of Covid deaths were sketchy in the beginning, this graph begins with daily deaths as of April 24, 2020 compared to cases reported on March 27, 2020.
The line shows the Positivity metric for Canada starting at nearly 8% for new cases April 24, 2020. That is, for the 7 day period ending April 24, there were a daily average of 21,772 tests and 1715 new cases reported. Since then the rate of new cases has dropped down, now holding steady at ~1% since mid-June. Yesterday, the daily average number of tests was 47,221 with 377 new cases. So despite more than doubling the testing, the positivity rate is not climbing. Another view of the data is shown below.
The scale of testing has increased and has now reached nearly 50,000 a day, while positive tests (cases) are hovering at 1% positivity. The shape of the recovery curve resembles the case curve lagged by 28 days, since death rates are a small portion of cases. The recovery rate has grown from 83% to 98% steady over the last 3 weeks, so that recoveries now exceed new positives. This approximation surely understates the number of those infected with SAR CV2 who are healthy afterwards, since antibody studies show infection rates multiples higher than confirmed positive tests (8 times higher in Canada). In absolute terms, cases are now down to 377 a day and deaths 6 a day, while estimates of recoveries are 386 a day.
Summary of Canada Covid Epidemic
It took a lot of work, but I was able to produce something akin to the Dutch advice to their citizens.
The media and governmental reports focus on total accumulated numbers which are big enough to scare people to do as they are told. In the absence of contextual comparisons, citizens have difficulty answering the main (perhaps only) question on their minds: What are my chances of catching Covid19 and dying from it?
A previous post reported that the Netherlands parliament was provided with the type of guidance everyone wants to see.
The table presents only those cases with a full clinical documentation, which included some 2194 deaths compared to the 5842 total reported. The numbers show that under 60 years old, few adults and almost no children have anything to fear.
Update May 20, 2020
It is really quite difficult to find cases and deaths broken down by age groups. For Canadian national statistics, I resorted to a report from Ontario to get the age distributions, since that province provides 69% of the cases outside of Quebec and 87% of the deaths. Applying those proportions across Canada results in this table. For Canada as a whole nation:
Age
Risk of Test +
Risk of Death
Population per 1 CV death
<20
0.05%
None
NA
20-39
0.20%
0.000%
431817
40-59
0.25%
0.002%
42273
60-79
0.20%
0.020%
4984
80+
0.76%
0.251%
398
In the worst case, if you are a Canadian aged more than 80 years, you have a 1 in 400 chance of dying from Covid19. If you are 60 to 80 years old, your odds are 1 in 5000. Younger than that, it’s only slightly higher than winning (or in this case, losing the lottery).
As noted above Quebec provides the bulk of cases and deaths in Canada, and also reports age distribution more precisely, The numbers in the table below show risks for Quebecers.
Age
Risk of Test +
Risk of Death
Population per 1 CV death
0-9 yrs
0.13%
0
NA
10-19 yrs
0.21%
0
NA
20-29 yrs
0.50%
0.000%
289,647
30-39
0.51%
0.001%
152,009
40-49 years
0.63%
0.001%
73,342
50-59 years
0.53%
0.005%
21,087
60-69 years
0.37%
0.021%
4,778
70-79 years
0.52%
0.094%
1,069
80-89
1.78%
0.469%
213
90 +
5.19%
1.608%
62
While some of the risk factors are higher in the viral hotspot of Quebec, it is still the case that under 80 years of age, your chances of dying from Covid 19 are better than 1 in 1000, and much better the younger you are.
The annual competition between ice and water in the Arctic ocean is approaching the maximum for water, which typically occurs mid September. After that, diminishing energy from the slowly setting sun allows oceanic cooling causing ice to regenerate. Those interested in the dynamics of Arctic sea ice can read numerous posts here. This post provides a look at mid August from 2007 to yesterday as a context for anticipating this year’s annual minimum. Note that for climate purposes the annual minimum is measured by the September monthly average ice extent, since the daily extents vary and will go briefly lower on or about day 260.
The melting season in August up to yesterday shows 2020 below average but appearing to consolidate in the recent days.
Both MASIE and SII show 2020 ice extents below average and other years beginning August and matching 2019 by mid month. In contrast 2007 melted more slowly than other years reaching average later in August before dropping at the end. 2012 was an average year until the 2012 Great Cyclone, whose effects started after day 230 precipitating a drop of 1.7M km2 of ice in just two weeks. And as we know, 2012 went on to record the lowest September in the record.
The table for day 228 shows how the ice is distributed across the various seas comprising the Arctic Ocean.
Region
2020228
Day 228 Average
2020-Ave.
2007228
2020-2007
(0) Northern_Hemisphere
5081593
5844411
-762818
5640240
-558648
(1) Beaufort_Sea
831909
664315
167594
769154
62755
(2) Chukchi_Sea
405793
398698
7094
256889
148903
(3) East_Siberian_Sea
274583
552107
-277523
163257
111326
(4) Laptev_Sea
21598
253760
-232161
292592
-270994
(5) Kara_Sea
17604
86914
-69311
192800
-175196
(6) Barents_Sea
3285
27907
-24622
15859
-12574
(7) Greenland_Sea
235942
221912
14030
308560
-72618
(8) Baffin_Bay_Gulf_of_St._Lawrence
11620
55856
-44236
81722
-70102
(9) Canadian_Archipelago
359629
415244
-55615
379795
-20166
(10) Hudson_Bay
48519
71815
-23296
90668
-42149
(11) Central_Arctic
2870439
3094846
-224407
3087687
-217247
The extent numbers show that this year’s melt is dominated by the surprisingly hot Siberian summer, leading to major deficits in all the Eurasian shelf seas–East Siberian, Laptev, Kara. As well, the bordering parts of the Central Arctic show a sizeable deficit to average.
It is also the case that many regions have already registered their 2020 minimums. And as discussed below, the marginal basins have little ice left to lose.
The Bigger Picture
We are close to the annual Arctic ice extent minimum, which typically occurs on or about day 260 (mid September). Some take any year’s slightly lower minimum as proof that Arctic ice is dying, but the image above shows the Arctic heart is beating clear and strong.
Over this decade, the Arctic ice minimum has not declined, but since 2007 looks like fluctuations around a plateau. By mid-September, all the peripheral seas have turned to water, and the residual ice shows up in a few places. The table below indicates where we can expect to find ice this September. Numbers are area units of Mkm2 (millions of square kilometers).
Day 260
13 year
Arctic Regions
2007
2010
2012
2014
2015
2016
2017
2018
2019
Average
Central Arctic Sea
2.67
3.16
2.64
2.98
2.93
2.92
3.07
2.91
2.97
2.93
BCE
0.50
1.08
0.31
1.38
0.89
0.52
0.84
1.16
0.46
0.89
LKB
0.29
0.24
0.02
0.19
0.05
0.28
0.26
0.02
0.11
0.16
Greenland & CAA
0.56
0.41
0.41
0.55
0.46
0.45
0.52
0.41
0.36
0.46
B&H Bays
0.03
0.03
0.02
0.02
0.10
0.03
0.07
0.05
0.01
0.04
NH Total
4.05
4.91
3.40
5.13
4.44
4.20
4.76
4.56
3.91
4.48
The table includes three early years of note along with the last 6 years compared to the 13 year average for five contiguous arctic regions. BCE (Beaufort, Chukchi and East Siberian) on the Asian side are quite variable as the largest source of ice other than the Central Arctic itself. Greenland Sea and CAA (Canadian Arctic Archipelago) together hold almost 0.5M km2 of ice at annual minimum, fairly consistently. LKB are the European seas of Laptev, Kara and Barents, a smaller source of ice, but a difference maker some years, as Laptev was in 2016. Baffin and Hudson Bays are inconsequential as of day 260.
For context, note that the average maximum has been 15M, so on average the extent shrinks to 30% of the March high before growing back the following winter. In this context, it is foolhardy to project any summer minimum forward to proclaim the end of Arctic ice.
The best context for understanding decadal temperature changes comes from the world’s sea surface temperatures (SST), for several reasons:
The ocean covers 71% of the globe and drives average temperatures;
SSTs have a constant water content, (unlike air temperatures), so give a better reading of heat content variations;
A major El Nino was the dominant climate feature in recent years.
HadSST is generally regarded as the best of the global SST data sets, and so the temperature story here comes from that source, the latest version being HadSST3. More on what distinguishes HadSST3 from other SST products at the end.
The Current Context
The chart below shows SST monthly anomalies as reported in HadSST3 starting in 2015 through July 2020. A global cooling pattern is seen clearly in the Tropics since its peak in 2016, joined by NH and SH cycling downward since 2016. In 2019 all regions had been converging to reach nearly the same value in April.
Then NH rose exceptionally by almost 0.5C over the four summer months, in August exceeding previous summer peaks in NH since 2015. In the last 4 months of 2019 that warm NH pulse reversed sharply. Now in 2020 the first 4 months show little change from last December. June dropped sharply in SH and Tropics, but now in July we again see a pulse of warm water in the NH along with a smaller rise in the Tropics. NH anomaly in July 2020 matches July a year ago, and may set up for an even warmer August.
I am surprised since the UAH ocean air anomaly for July 2020 did not show such a warming spike.
Note that higher temps in 2015 and 2016 were first of all due to a sharp rise in Tropical SST, beginning in March 2015, peaking in January 2016, and steadily declining back below its beginning level. Secondly, the Northern Hemisphere added three bumps on the shoulders of Tropical warming, with peaks in August of each year. A fourth NH bump was lower and peaked in September 2018. As noted above, a fifth peak in August 2019 exceeded the four previous upward bumps in NH.
And as before, note that the global release of heat was not dramatic, due to the Southern Hemisphere offsetting the Northern one. The major difference between now and 2015-2016 is the absence of Tropical warming driving the SSTs.
A longer view of SSTs
The graph below is noisy, but the density is needed to see the seasonal patterns in the oceanic fluctuations. Previous posts focused on the rise and fall of the last El Nino starting in 2015. This post adds a longer view, encompassing the significant 1998 El Nino and since. The color schemes are retained for Global, Tropics, NH and SH anomalies. Despite the longer time frame, I have kept the monthly data (rather than yearly averages) because of interesting shifts between January and July.
1995 is a reasonable (ENSO neutral) starting point prior to the first El Nino. The sharp Tropical rise peaking in 1998 is dominant in the record, starting Jan. ’97 to pull up SSTs uniformly before returning to the same level Jan. ’99. For the next 2 years, the Tropics stayed down, and the world’s oceans held steady around 0.2C above 1961 to 1990 average.
Then comes a steady rise over two years to a lesser peak Jan. 2003, but again uniformly pulling all oceans up around 0.4C. Something changes at this point, with more hemispheric divergence than before. Over the 4 years until Jan 2007, the Tropics go through ups and downs, NH a series of ups and SH mostly downs. As a result the Global average fluctuates around that same 0.4C, which also turns out to be the average for the entire record since 1995.
2007 stands out with a sharp drop in temperatures so that Jan.08 matches the low in Jan. ’99, but starting from a lower high. The oceans all decline as well, until temps build peaking in 2010.
Now again a different pattern appears. The Tropics cool sharply to Jan 11, then rise steadily for 4 years to Jan 15, at which point the most recent major El Nino takes off. But this time in contrast to ’97-’99, the Northern Hemisphere produces peaks every summer pulling up the Global average. In fact, these NH peaks appear every July starting in 2003, growing stronger to produce 3 massive highs in 2014, 15 and 16. NH July 2017 was only slightly lower, and a fifth NH peak still lower in Sept. 2018.
The highest summer NH peak came in 2019, only this time the Tropics and SH are offsetting rather adding to the warming. Since 2014 SH has played a moderating role, offsetting the NH warming pulses. (Note: these are high anomalies on top of the highest absolute temps in the NH.) July 2020 showed a sharp rise to match 2019 and may exceed last August.
What to make of all this? The patterns suggest that in addition to El Ninos in the Pacific driving the Tropic SSTs, something else is going on in the NH. The obvious culprit is the North Atlantic, since I have seen this sort of pulsing before. After reading some papers by David Dilley, I confirmed his observation of Atlantic pulses into the Arctic every 8 to 10 years.
But the peaks coming nearly every summer in HadSST require a different picture. Let’s look at August, the hottest month in the North Atlantic from the Kaplan dataset. The AMO Index is from from Kaplan SST v2, the unaltered and not detrended dataset. By definition, the data are monthly average SSTs interpolated to a 5×5 grid over the North Atlantic basically 0 to 70N. The graph shows warming began after 1992 up to 1998, with a series of matching years since. Because the N. Atlantic has partnered with the Pacific ENSO recently, let’s take a closer look at some AMO years in the last 2 decades.
This graph shows monthly AMO temps for some important years. The Peak years were 1998, 2010 and 2016, with the latter emphasized as the most recent. The other years show lesser warming, with 2007 emphasized as the coolest in the last 20 years. Note the red 2018 line is at the bottom of all these tracks.
The black line shows that 2020 began near average, but is showing higher temperatures the last three months than any year in the record except for tracking 2010. Now this year is matching 2016 as the warmest in recent decades. It appears that the Atlantic is driving warming in NH and Tropics this year. If 2020 does average out higher than 2019, remember that it came from the ocean, in particular the North Atlantic.
Summary
The oceans are driving the warming this century. SSTs took a step up with the 1998 El Nino and have stayed there with help from the North Atlantic, and more recently the Pacific northern “Blob.” The ocean surfaces are releasing a lot of energy, warming the air, but eventually will have a cooling effect. The decline after 1937 was rapid by comparison, so one wonders: How long can the oceans keep this up? If the pattern of recent years continues, NH SST anomalies may rise slightly in coming months, but once again, ENSO which has weakened will probably determine the outcome.
Footnote: Why Rely on HadSST3
HadSST3 is distinguished from other SST products because HadCRU (Hadley Climatic Research Unit) does not engage in SST interpolation, i.e. infilling estimated anomalies into grid cells lacking sufficient sampling in a given month. From reading the documentation and from queries to Met Office, this is their procedure.
HadSST3 imports data from gridcells containing ocean, excluding land cells. From past records, they have calculated daily and monthly average readings for each grid cell for the period 1961 to 1990. Those temperatures form the baseline from which anomalies are calculated.
In a given month, each gridcell with sufficient sampling is averaged for the month and then the baseline value for that cell and that month is subtracted, resulting in the monthly anomaly for that cell. All cells with monthly anomalies are averaged to produce global, hemispheric and tropical anomalies for the month, based on the cells in those locations. For example, Tropics averages include ocean grid cells lying between latitudes 20N and 20S.
Gridcells lacking sufficient sampling that month are left out of the averaging, and the uncertainty from such missing data is estimated. IMO that is more reasonable than inventing data to infill. And it seems that the Global Drifter Array displayed in the top image is providing more uniform coverage of the oceans than in the past.
USS Pearl Harbor deploys Global Drifter Buoys in Pacific Ocean


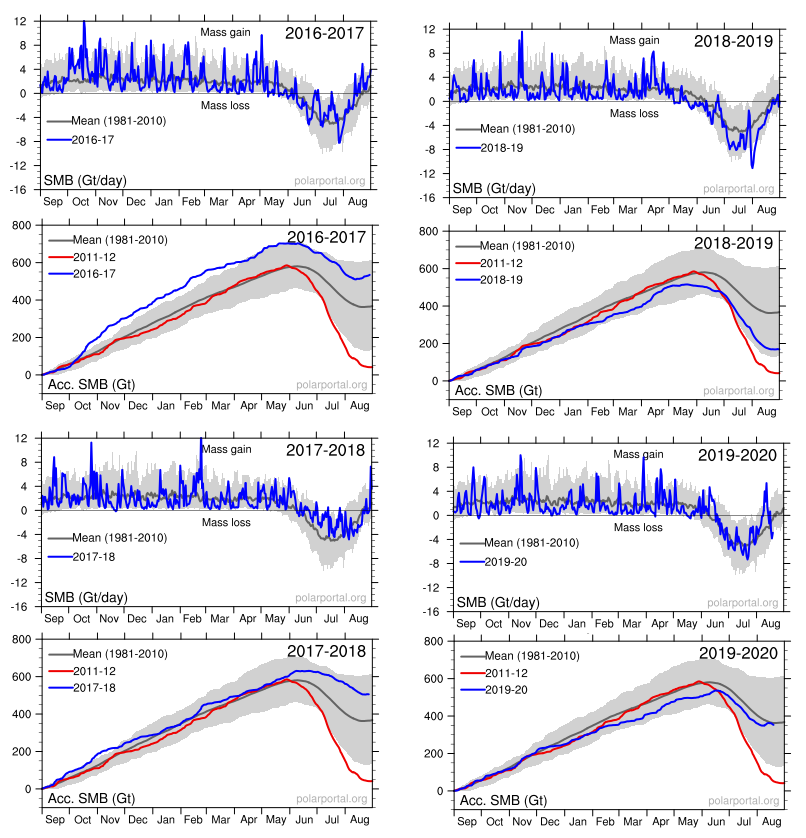
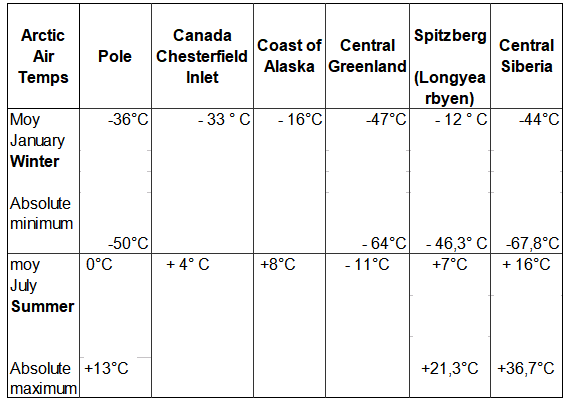
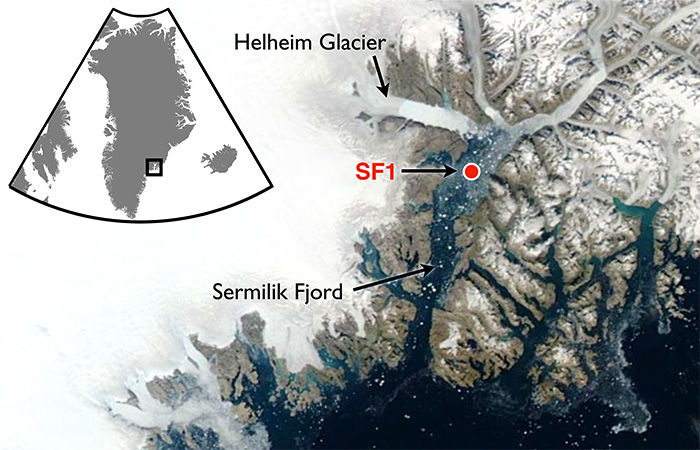


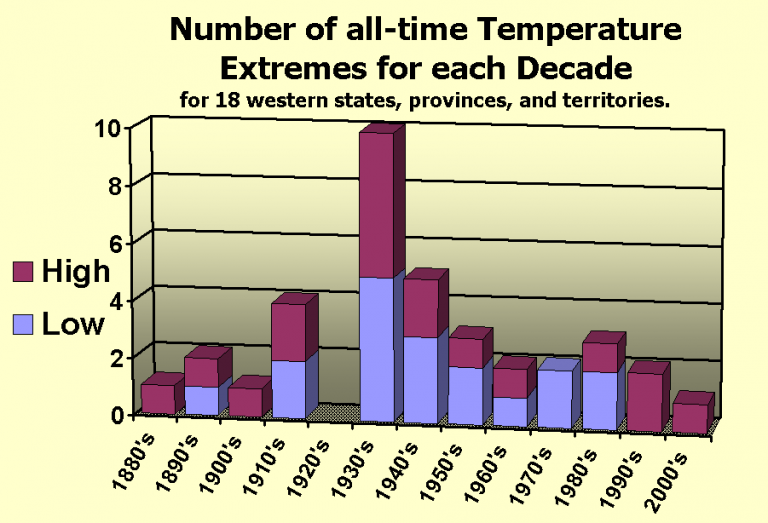


 Others think it means: It is real that using fossil fuels causes global warming. This too lacks persuasive evidence.
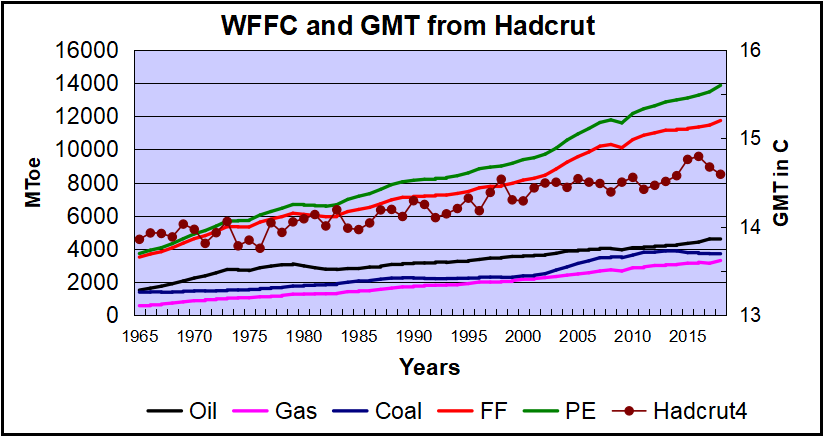 Over the last five decades the increase in fossil fuel consumption is dramatic and monotonic, steadily increasing by 234% from 3.5B to 11.7B oil equivalent tons. Meanwhile the GMT record from Hadcrut shows multiple ups and downs with an accumulated rise of 0.74C over 53 years, 5% of the starting value.
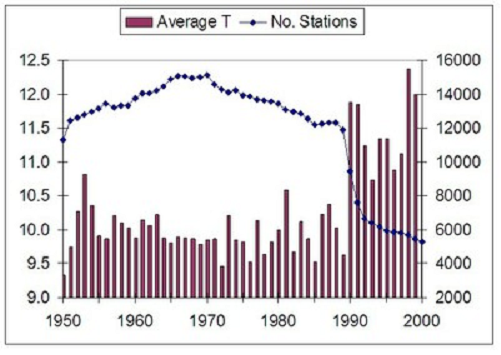
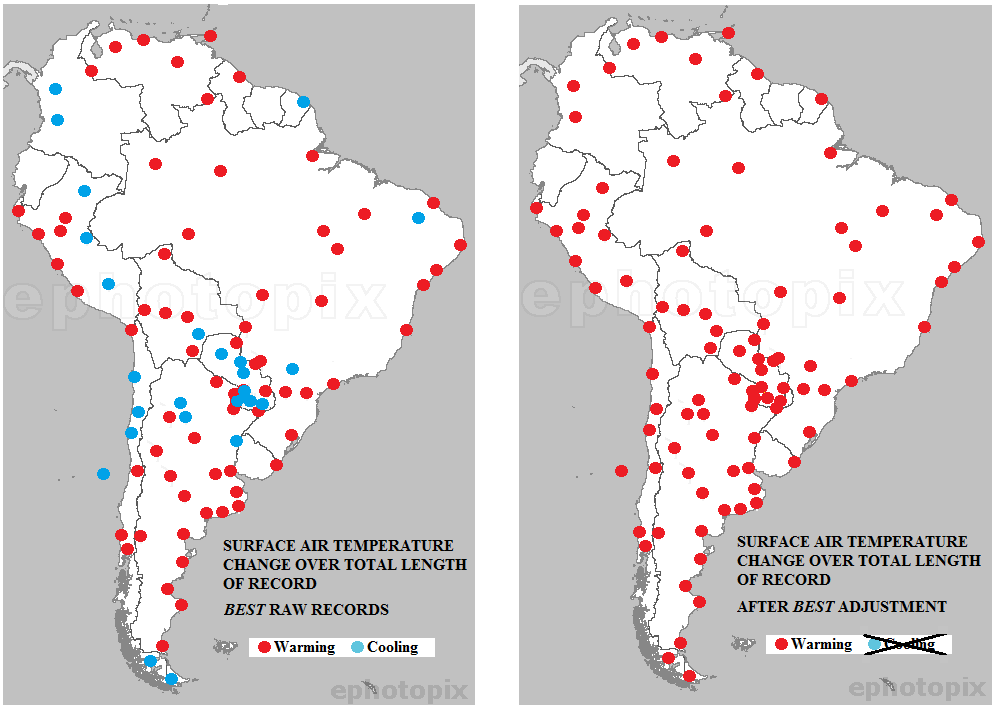 Conclusion
 Norman Doige writes in The Tablet
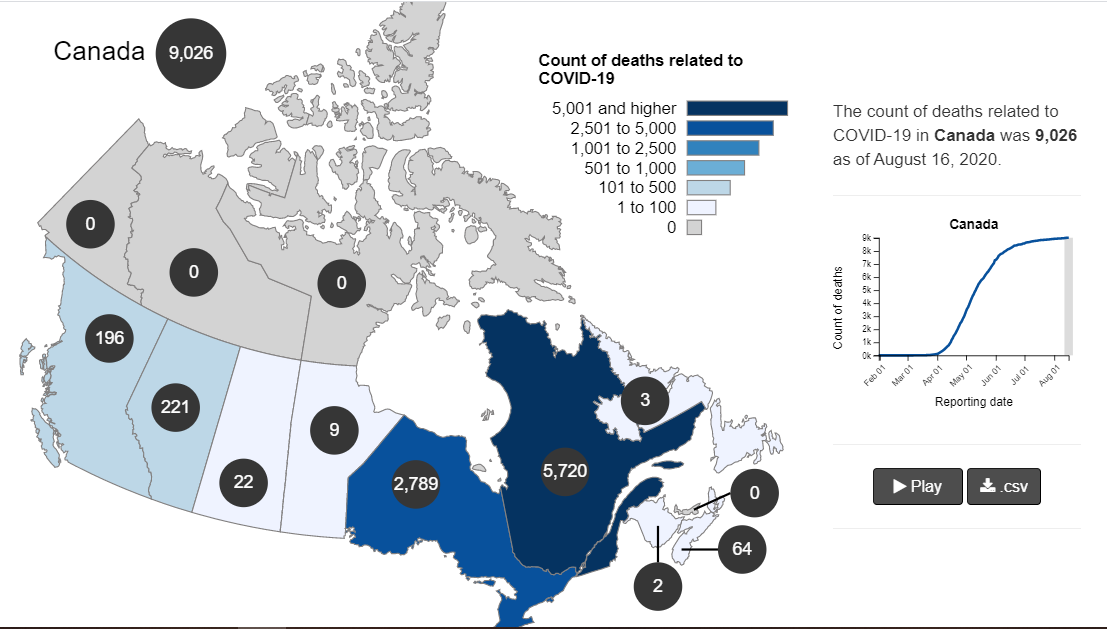
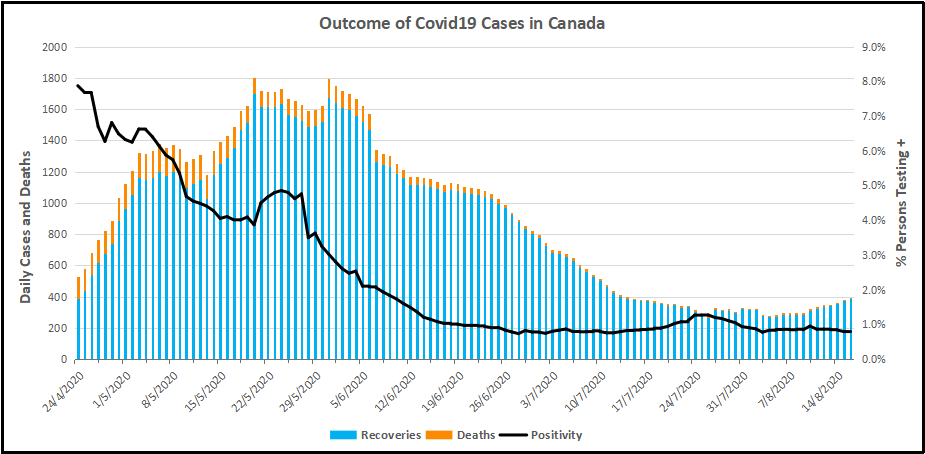
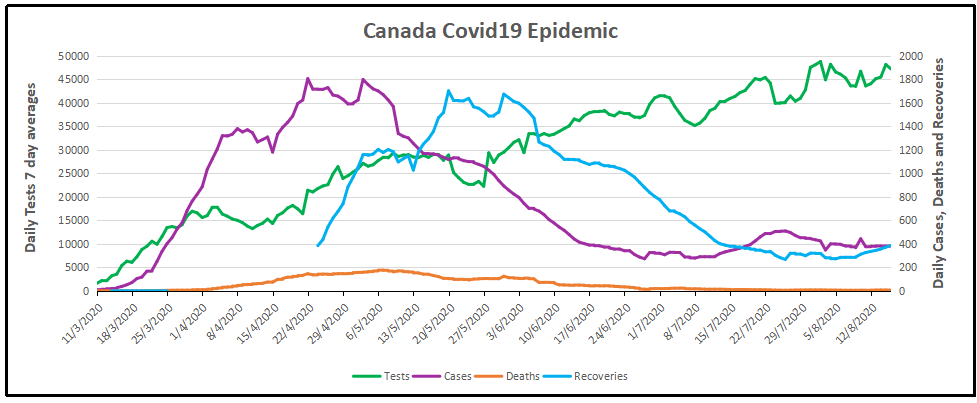

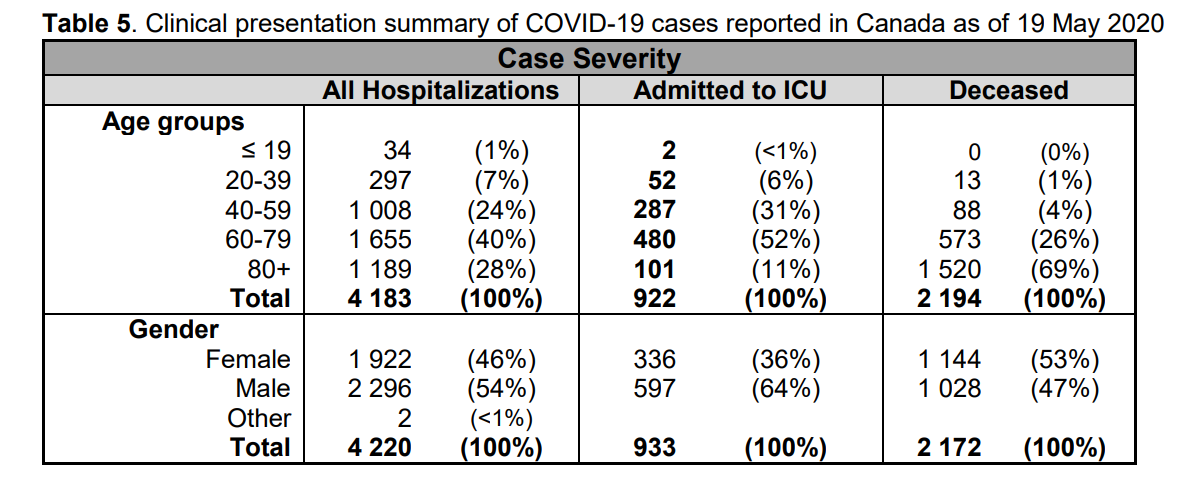

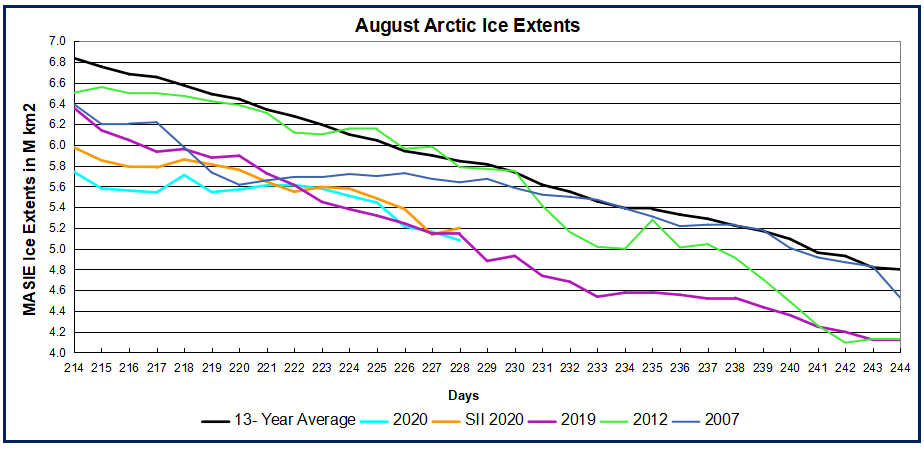


 The best context for understanding decadal temperature changes comes from the world’s sea surface temperatures (SST), for several reasons: