Early Arctic Minimum?
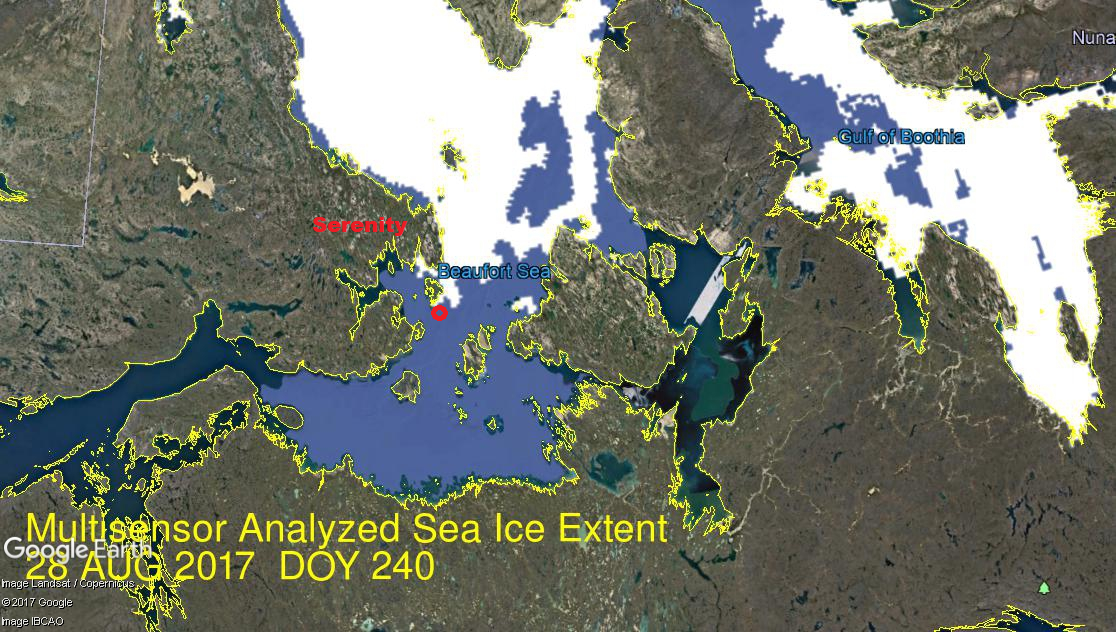
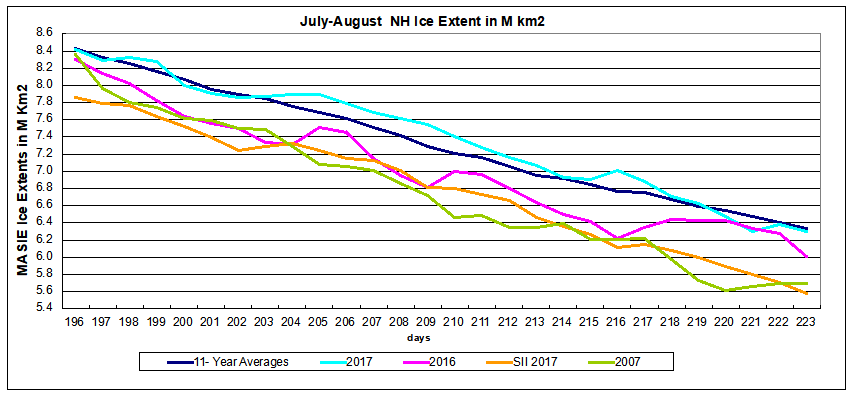
It is a few days earlier than usual, but MASIE shows ice extents stabilizing near 4.7M km2 in recent days, and more importantly, some refreezing in the central seas. As discussed in Arctic Heart Beat, the marginal shelf seas seldom have ice at annual minimum, typically on or about day 260. The image below shows the progression of ice extents from 2007 to 2017.
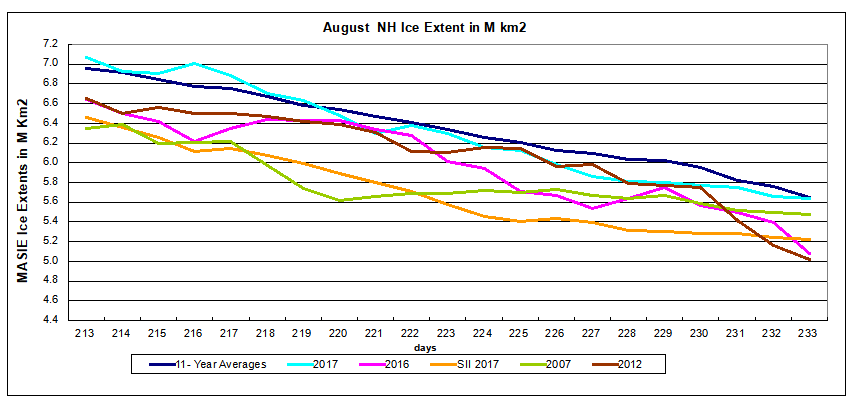
Yesterday was day 251 and the graph below shows 2017 compared with other years and the decadal average during the last 3 weeks.
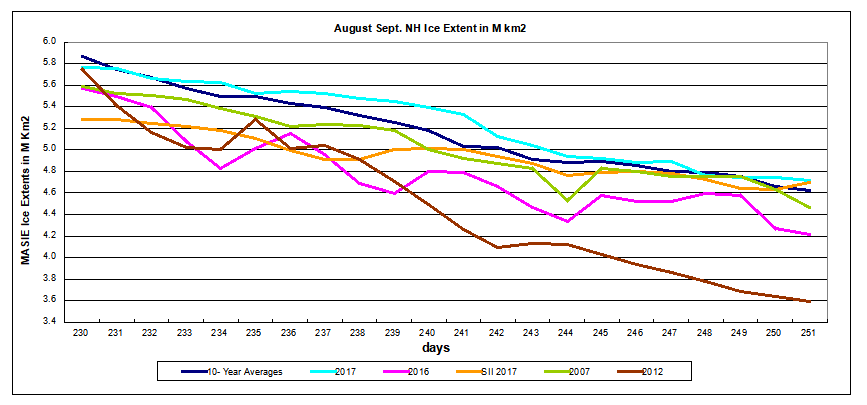
At this point MASIE and SII are showing the same extent, about 100k km2 above the 10 year average. 2007 is 250k km2 lower, 2016 500k km2 lower, and at the bottom is 2012 1.1M km2 below 2017. The table compares 2017, decadal average and 2007 for the regions containing ice at this time.
| Region | 2017251 | Day 251 Average |
2017-Ave. | 2007251 | 2017-2007 |
| (0) Northern_Hemisphere | 4716948 | 4619900 | 97048 | 4467771 | 249177 |
| (1) Beaufort_Sea | 409067 | 492365 | -83298 | 643868 | -234801 |
| (2) Chukchi_Sea | 133345 | 185601 | -52257 | 95240 | 38105 |
| (3) East_Siberian_Sea | 279966 | 301146 | -21180 | 311 | 279655 |
| (4) Laptev_Sea | 196236 | 152840 | 43396 | 252479 | -56243 |
| (5) Kara_Sea | 22449 | 30277 | -7828 | 59593 | -37144 |
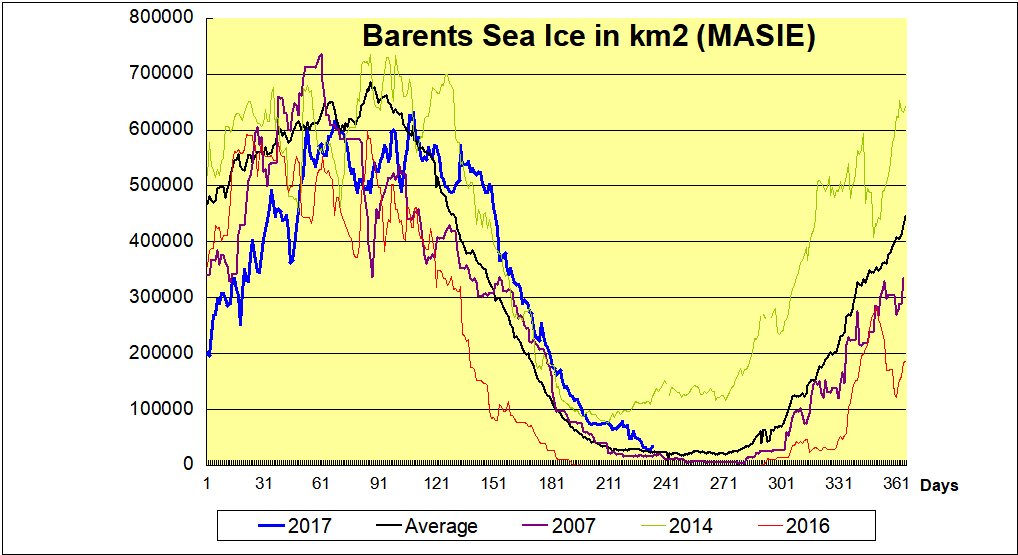
| (6) Barents_Sea | 23123 | 20028 | 3095 | 5882 | 17240 |
| (7) Greenland_Sea | 116132 | 196719 | -80586 | 315125 | -198993 |
| (8) Baffin_Bay_Gulf_of_St._Lawrence | 46799 | 21575 | 25224 | 17173 | 29626 |
| (9) Canadian_Archipelago | 374084 | 268736 | 105348 | 236583 | 137501 |
| (10) Hudson_Bay | 1191 | 11933 | -10743 | 22646 | -21455 |
| (11) Central_Arctic | 3113399 | 2937746 | 175653 | 2817614 | 295785 |
The deficits continue to be on the Pacific side, especially Beaufort, and also Greenland Sea is down this year. These are more than offset by large surpluses in the Central Arctic and Canadian Archipelago, and also Laptev. East Siberian sea also has surplus ice this year compared to 2007.

aer Atmospheric and Environmental Research
September 5, 2017 Dr. Judah Cohen of AER posted his monthly forecast for the Arctic and NH based on the Arctic Oscillation (AO) and North Atlantic Oscillation (NAO). Excerpts below.
The AO is currently slightly negative (Figure 1), reflective of mostly positive geopotential height anomalies across the Arctic and mixed geopotential height anomalies across the mid-latitudes of the NH (Figure 2). Geopotential height anomalies are mostly negative across Greenland and Iceland (Figure 2), and therefore the NAO is slightly positive.
 Figure 1. (a) The predicted daily-mean near-surface AO from the 00Z 5 September 2017 GFS ensemble. Gray lines indicate the AO index from each individual ensemble member, with the ensemble-mean AO index given by the red line with squares.
The AO is predicted to straddle neutral next week as geopotential height anomalies remain mixed across the Arctic. Similarly, with mixed geopotential height anomalies stretching across Greenland and Iceland, the NAO will likely be near neutral as well.
(Note: AO and NAO are signed differently than one might expect; the reference point is outside the Arctic itself. Thus negative phases of these indices mean higher pressures in the Arctic and lower outside, while positive phases indicate lower pressures in the Arctic. Now that the Arctic sun is setting, the main issue for ice extent is storminess which requires low Arctic pressures.)
Impacts
It is the first week of fall, a season of transition from summer to winter. One important sign IMO of this seasonal transition is the return of the polar vortex in the stratosphere. The models predict the possible formation of the polar vortex sometime next week. Starting in October, I will be watching variability in the polar vortex for signs of pattern changes in the weather across the NH.
Another sign of the seasonal transition is the minimum in Arctic sea ice extent, which will be achieved in the coming days and/or weeks. The trajectory of sea ice melt has slowed since early August. In my last blog I suggested the possibility that the sea ice minimum could be similar to the years 2008 and 2010 and that is looking more likely but is difficult to predict. Over the coming months, I will be following Arctic sea ice variability for signs of the severity of the upcoming winter. Our understanding for how anomalies in sea ice extent influence the weather in the mid-latitudes is still immature IMO but I do think that important progress has been made recently.
Another sign of the transition from summer to winter is the return of snowfall to the NH. Snowfall over the sea ice in August probably helped retard the melt of sea ice and snowfall is now even occurring over Siberia and Alaska but is still very regionalized. Again I will be monitoring the advance of snow cover extent across the continents for signs of the strength of the polar vortex and the possible resultant weather.
Finally I find it interesting that while the atmospheric circulation has transitioned from the dominant summer pattern across Eurasia it has not across North America. The dominant summer pattern across Eurasia was ridging across Europe (with the exception of Northern Europe) and East Asia but with troughing in Western Asia. The forecast for the coming weeks is the opposite with troughs across Europe and East Asia but ridging in Western Asia. This is an overall cooler pattern than the dominant summer pattern. However across North America there are no similar signs of transition. The dominant summer pattern was strong ridging across western North America and troughing in eastern North America and at least for now that pattern looks to continue for much of the month of September. I don’t know the reason behind the persistent western ridge/eastern trough pattern across North America but how long this pattern can persist will obviously have important implications for the weather across North America in the coming months.
Summary
Bottom line, looks like September weather will be ordinary in the Arctic with seasonal cooling in the NH. Dr. Cohen also thinks the annual ice extent minimum will be near average for the decade. While the monthly average is final only at September end, the next week will set the tone and likely result.