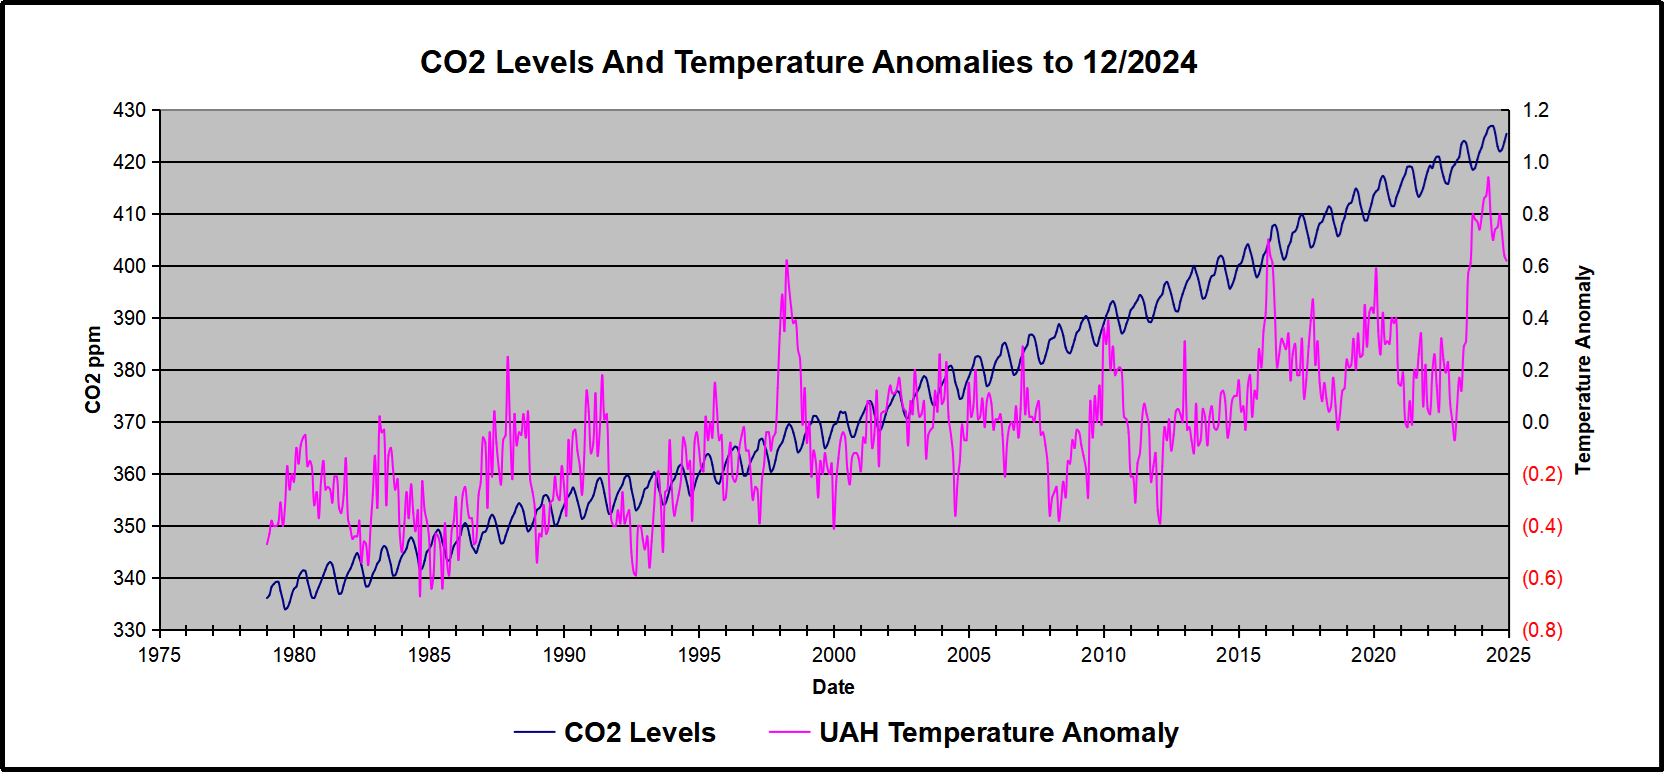


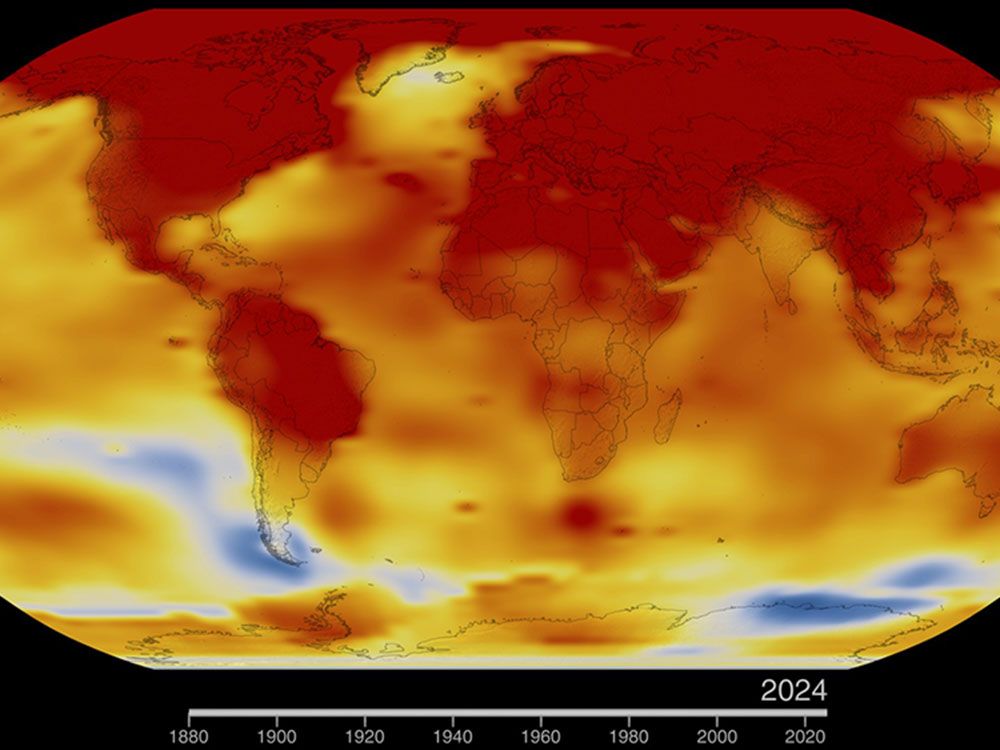
In 2024, mainstream media and political leaders aggressively promoted the alarming narrative that Earth had just experienced its hottest year ever recorded. National Geographic dramatically proclaimed, “2024 was the hottest year ever … and the coldest year of the rest of your life,” while the Vancouver Sun declared unequivocally, “Scientists confirm 2024 was Canada’s and world’s hottest year on record.” Canadian political figures reinforced this narrative, with prime minister Justin Trudeau characterizing the year’s warmth as an urgent call for immediate climate action.
About That Annoying DOE Climate Review

When it comes to the recent DOE Climate Review, legacy media coverage is lop-sided and limited to declarations of disgust and dismissal from climate insiders. Andrew Bolt in Australia is an exception, interested as he is in why climatists find the study so annoying. So his interview with one of the authors explores the controversy and why the media is averting their attention.
For those preferring to read, below is a transcript from the closed captions in italics wtih my bolds and added images. AB refers to Bolt and SK to Koonin
AB: I’m amazed how little attention the media has given to a new report on global warming I mentioned last week. I’m not that surprised to be honest. I mean, I’ve seen how the media ignores proof that the warming scare is grossly exaggerated, but I think you deserve to know more about this report.

In the United States, Chris Wright is the brilliant gas tycoon who now leads the US Department of Energy. He hired five very prominent climate experts to report back to the government on what the climate was really doing and whether we could trust predictions by the most popular climate models that we’re facing dangerous warming of at least 3 degrees this century and we’re already copying all sorts of climate disasters.
Well, the authors’ conclusion was that the climate models are actually unreliable. They’re all over the shop. They predict probably one degree more warming than is likely and we aren’t getting many of the predicted climate disasters. Plus, global warming also has benefits that are often ignored, especially a big increase in trees and crops that we’ve been seeing, a greening of the planet.
And in this report, the authors sum it all up like this. models, the climate models and experience suggests that carbon dioxide induced warming may be less damaging economically than commonly believed and excessively aggressive mitigation policies, you might include our own net zero schemes, could prove more detrimental than beneficial. [See DOE Climate Team: Twelve Keys in Assessing Climate Change]
So, you can understand why the authors have since been absolutely trashed for daring to doubt the climate scare and upsetting the climate industry. They’ve been called all sorts of names painted as fools, frauds, Donald Trump Toadies, even Stalinists, would you believe? But don’t be fooled by the abuse because the five authors are in fact very prominent experts. Professor emeritus Judith Curry has published 192 peer-reviewed papers on the climate. Dr. Roy Spencer, NASA senior scientist runs probably the most accurate measure of world temperature. Professor Ross McKitrick is an expert reviewer of the last three reports of the IPCC (intergovernmental panel on climate change). And distinguished professor John Christie, is a former lead author of an IPCC report. I mean, these are very serious people.
Plus Steven Koonin. He’s a physicist and former under secretary of science for President Barack Obama, a Democrat. And I am joined by Steven, Steve thank you so much for your time. Why did you and the other four experts behind this report actually agree to do it when you must have known the climate industry and the media would really go after you?
SK: Indeed. But you know, all five of us scientists have long felt that the science was misrepresented to the public and the decision makers, and we wanted to do our best to set the record straight.

AB: Well, on many points your report agrees with what I’ll call the consensus, the alarmist position, perhaps the position of the United Nations Intergovernmental Panel on Climate Change. You say, “Yes, global warming is real. Yes, it’s a problem. Yes, it’s caused in part by humans.” Now, tell us where you disagree with this consensus.
SK: Well, you know, people have said 95% of our report agrees with or is taken right out of the IPCC. It’s just that there are aspects of what the consensus says that do not find their way to the public. For example:
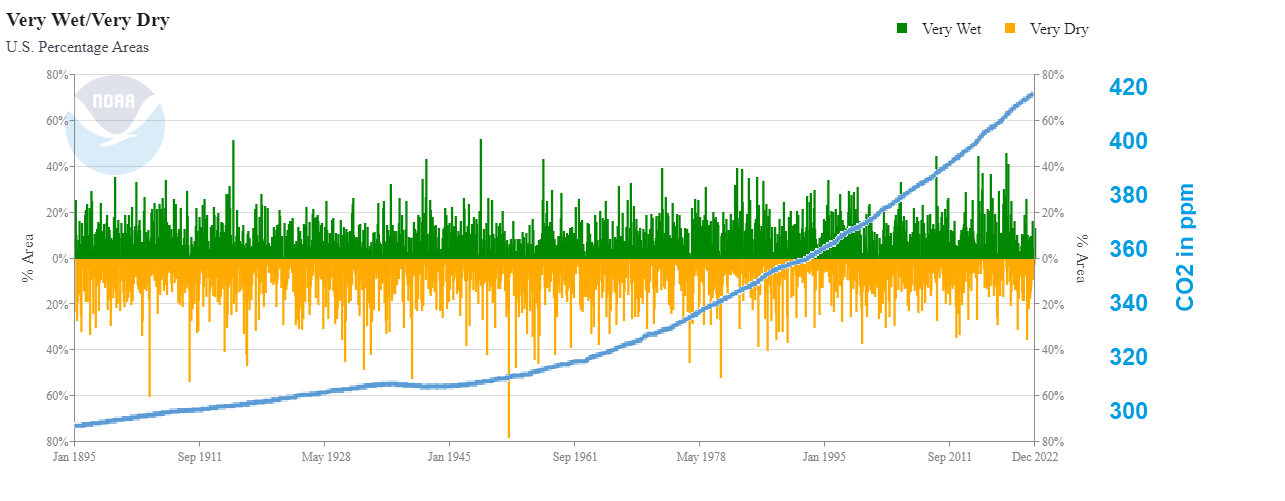
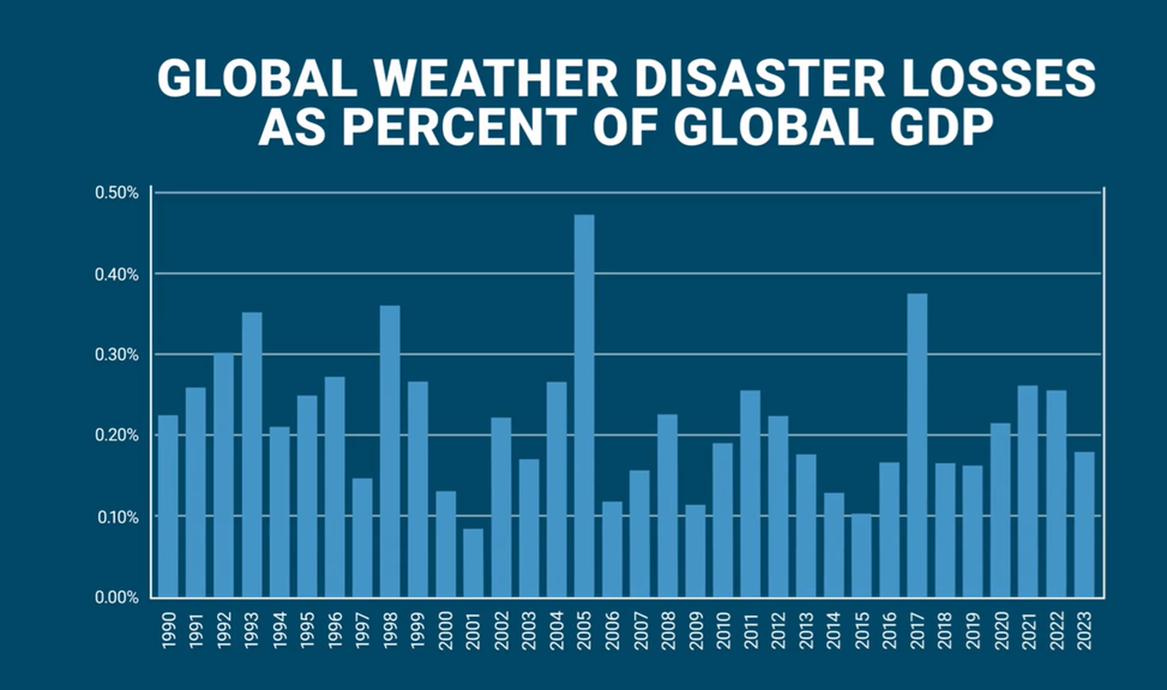
♦ There are no detectable trends in the great majority of extreme weather types.
♦ The models that we use to project climates into the future are demonstrably deficient. They’re in many ways all over the place in terms of their projections. And,
♦ The projected impacts of future climate change, even using those deficient models, are minimal.
These are very important central points that are there in the report
but do not make their way into the public discussion.
AB: You actually point out that the models tend to run hot, as in predict more warming than we’ve had. They’re unreliable. A number of basing false assumptions of how much emissions we’re going to get. You actually predict almost one degree less warming over the century than the IPCC model consensus. How important is that?
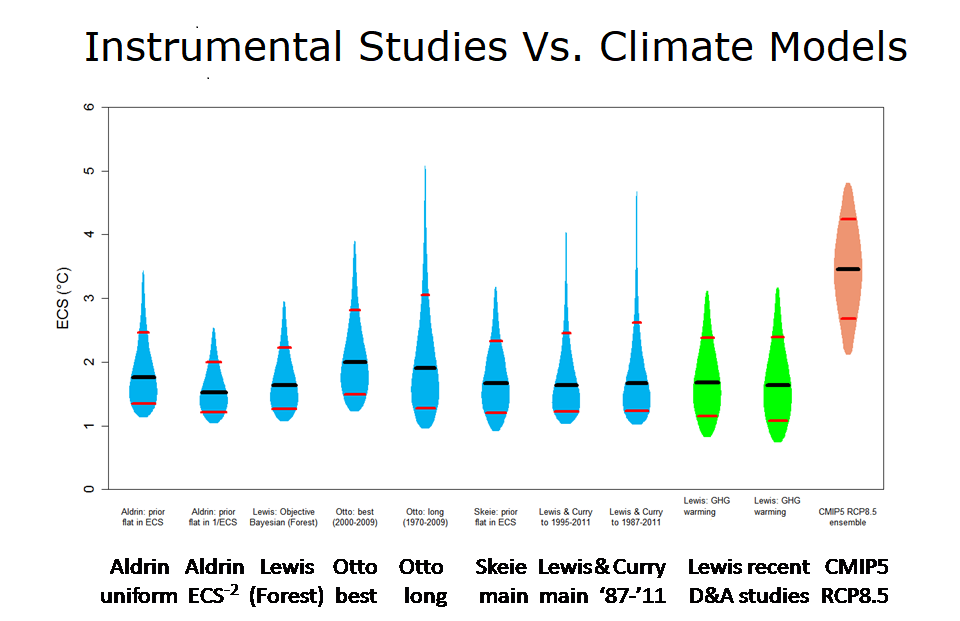
SK: Well, to be clear, we don’t predict. We simply cite and assess the work of others. But certainly, if the warming is a degree less than what the IPCC consensus says, that’s a big deal.
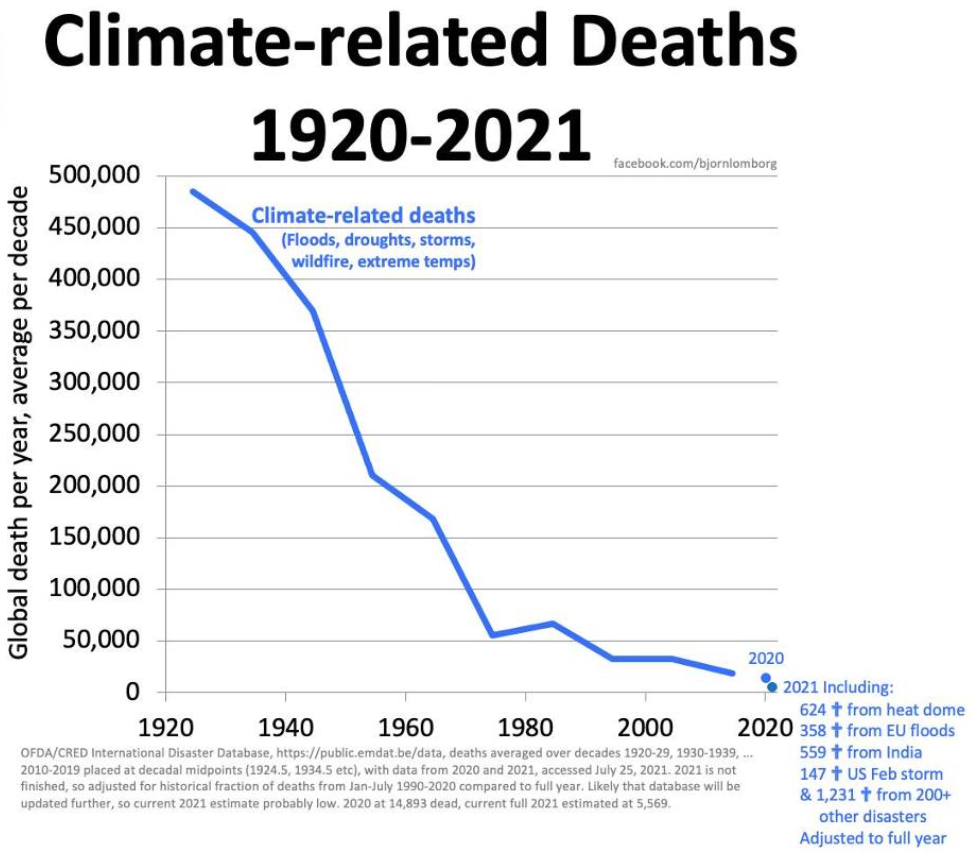
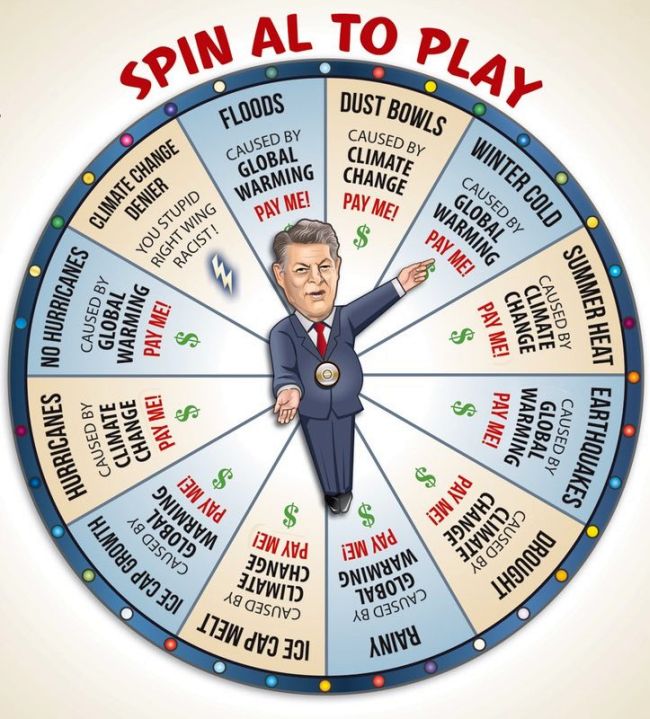
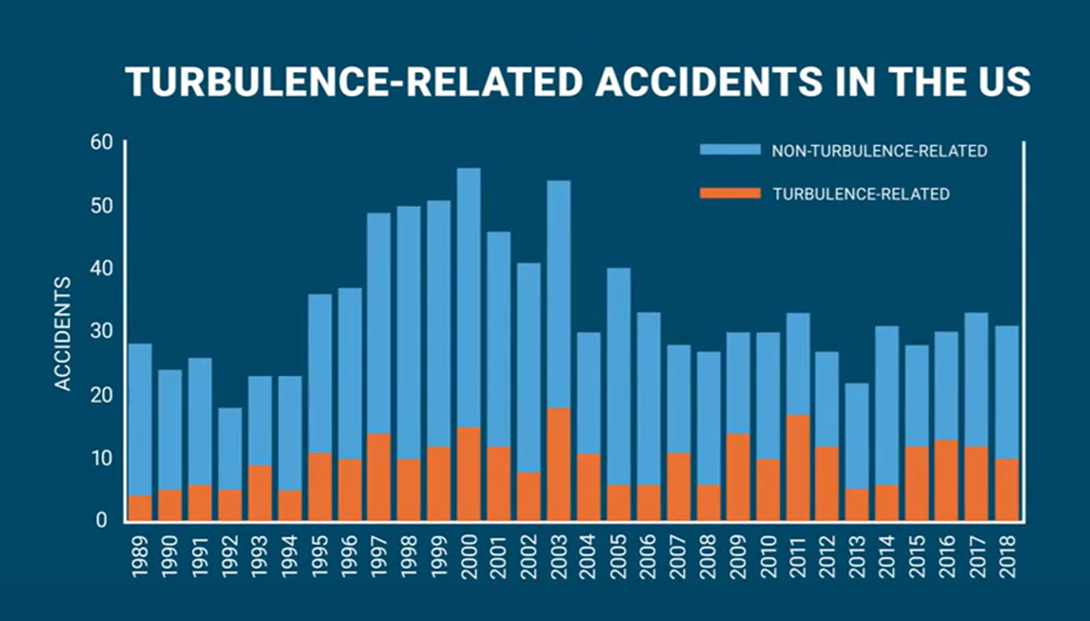
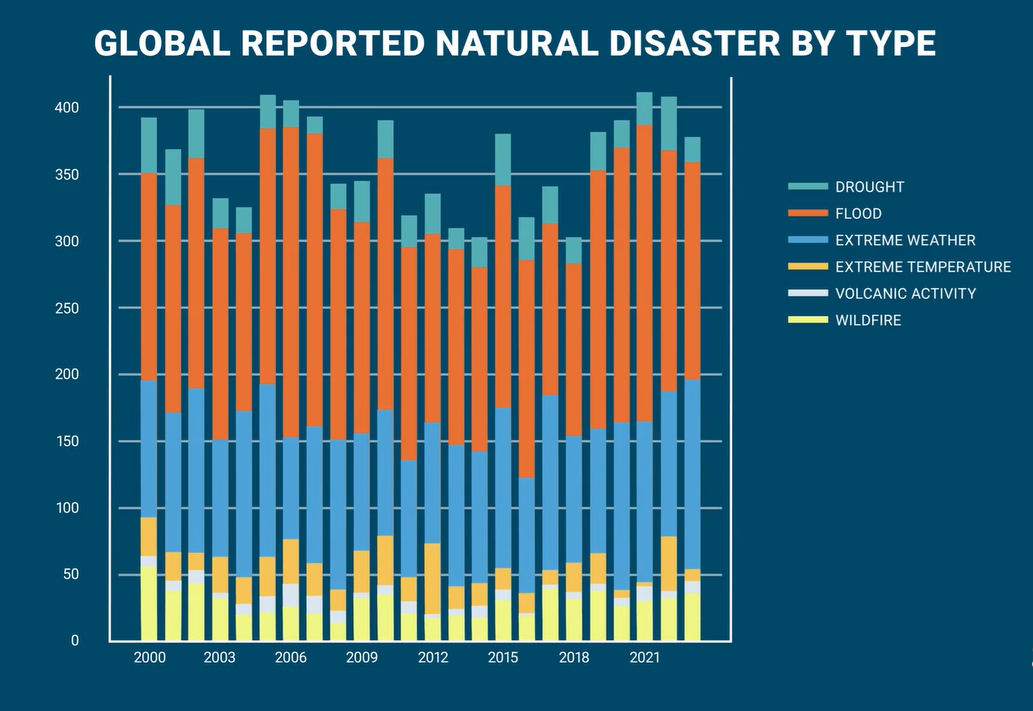
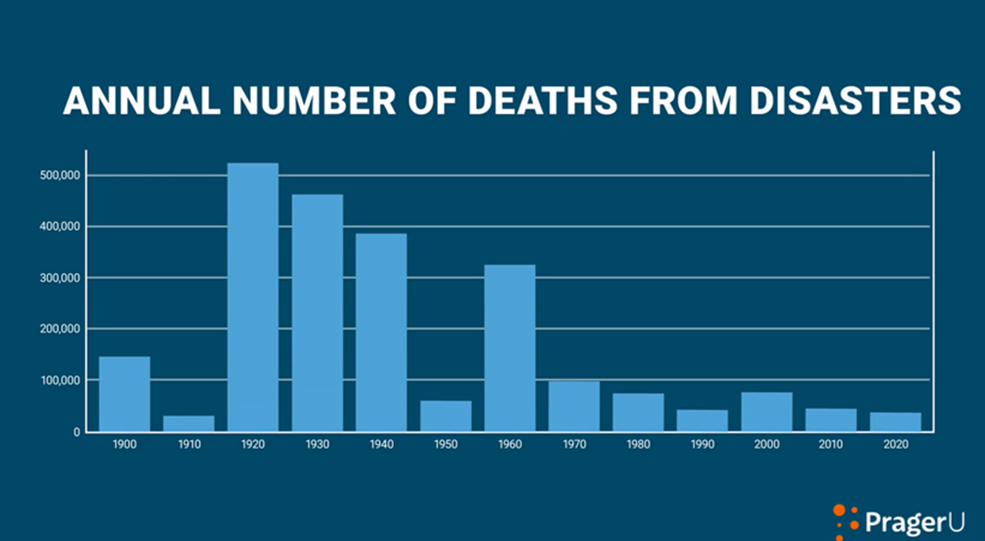
AB: And what about the climate disasters? I mean, every time like we’ve got it right now, you know, we’ve got some algae blooming off the South Australian coast. Global warming. We get heavy rain, global warming. We get a drought, global warming. How much influence has man-made warming really had from the work that you’ve done in this report? How much has it really influenced the natural disasters we tend to see?
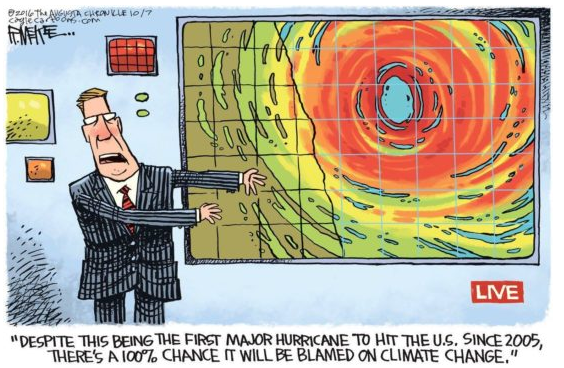
SK: Yeah, you know, people have a very short memory for weather disasters. There’s a lovely example that turned up at the beginning of July, having to do with the floods in Texas that we that were a terrible tragedy. But if you look back in the records, you can find the same kind of event happening in the same place in 1900. And of course, human influences on the climate were much smaller in 1900. And so you have a very hard time to logically attributing the recent disaster to carbon dioxide.
The same is true for many other severe weather phenomena.
They happened in the past. They’re just relatively rare. And so
we get surprised when we see them happen in the present day.
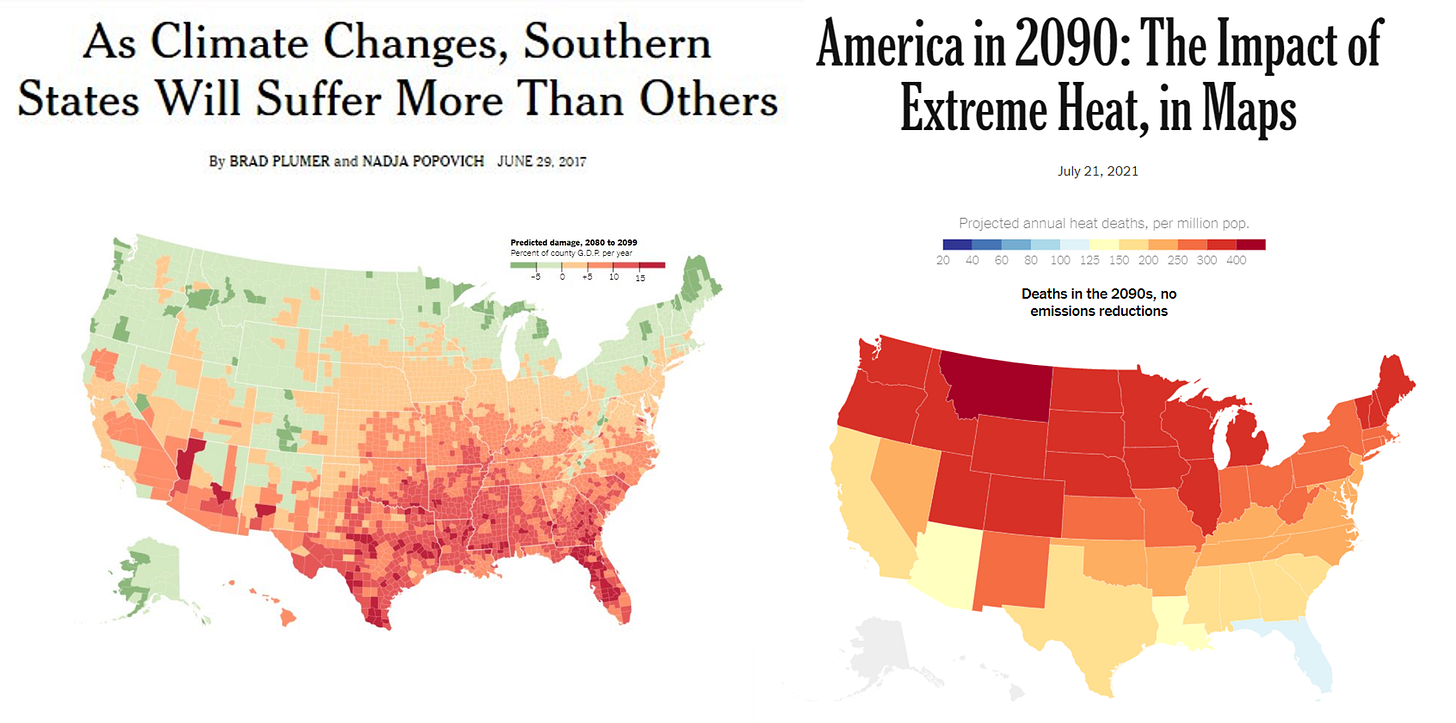
AB: Yeah. I noticed for instance in your report you say the number of heat waves in America actually peaked nearly 100 years ago.
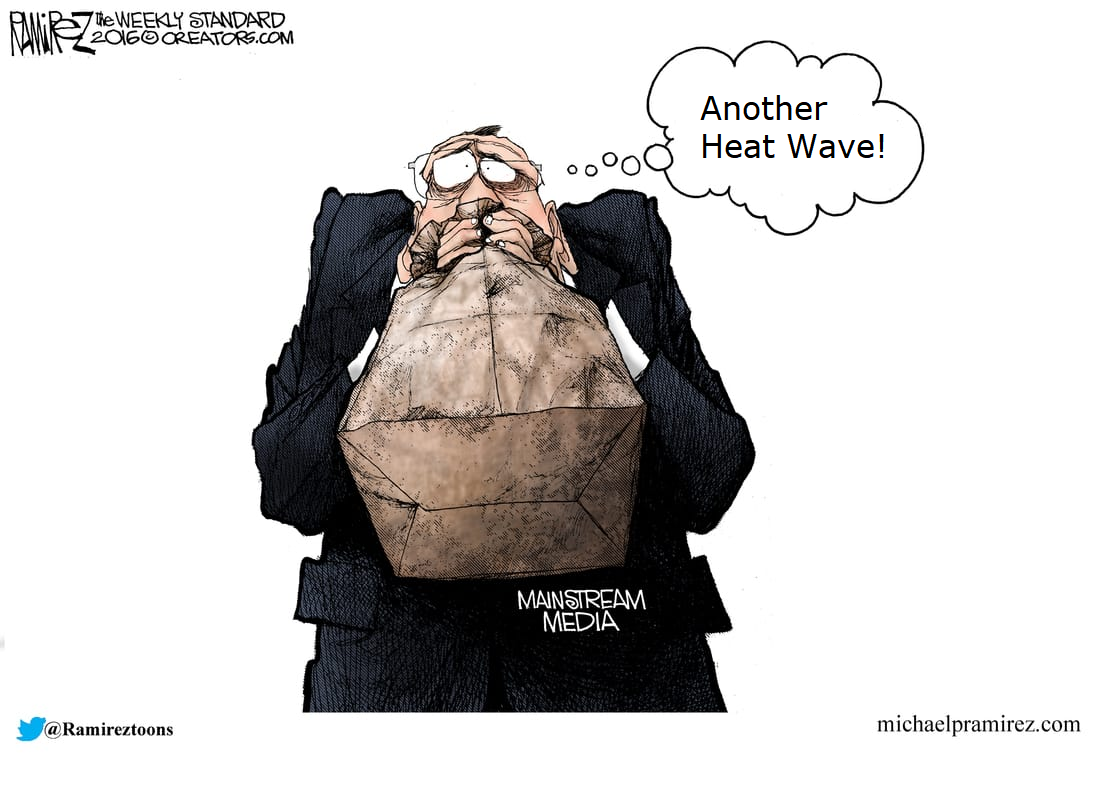
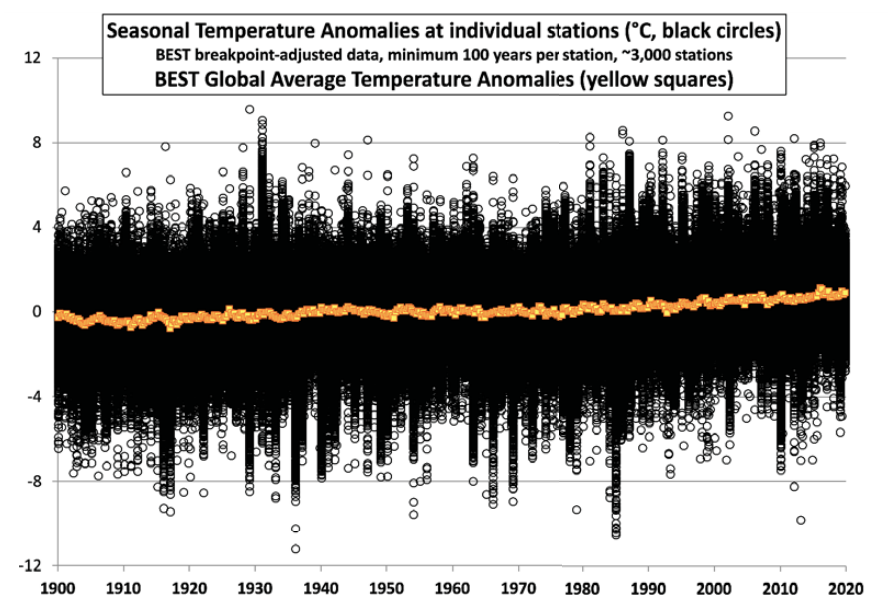
SK: The number of heat waves that were striking America at the time, and what we see now is much less, you know. The damning thing about the heat waves is that we really don’t understand why the 30s were so much warmer than it has been in many subsequent decades. And that speaks to our rather poor understanding of the ways in which the climate varies.

AB: I think the real thing about your report that’s annoying so many people in the climate industry is this. You say the warming will be less than what most people are claiming. You say the disasters from the warming we’ve seen are basically exaggerated. They’re not that many that you can point to. And the the attempts we make to stop all this are very expensive. And well, do they really work? Isn’ it the takeaway here, that it might not actually be worth trying to stop what isn’t the the climate disaster that many claim.
SK: Absolutely. You know, in deciding what to do, we have to balance the hazards, the certainties and uncertainties in the changing climate against other considerations. Like the world needs more and more energy, and in deciding what to do you have to look at the costs. Are they going to be effective? What about equity between generations, between countries, and so on. It’s not simply that, oh my god, we’ve broken the climate and we’ve got to fix it. And I do think some people get annoyed when we start to expose those nuances of the situation.
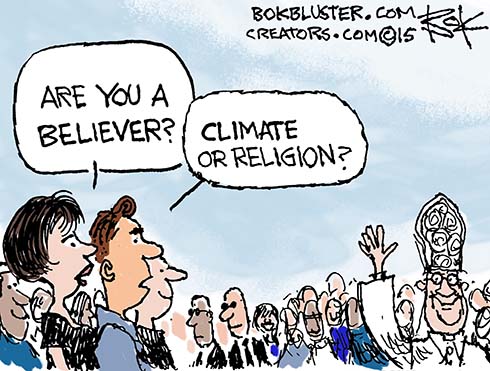
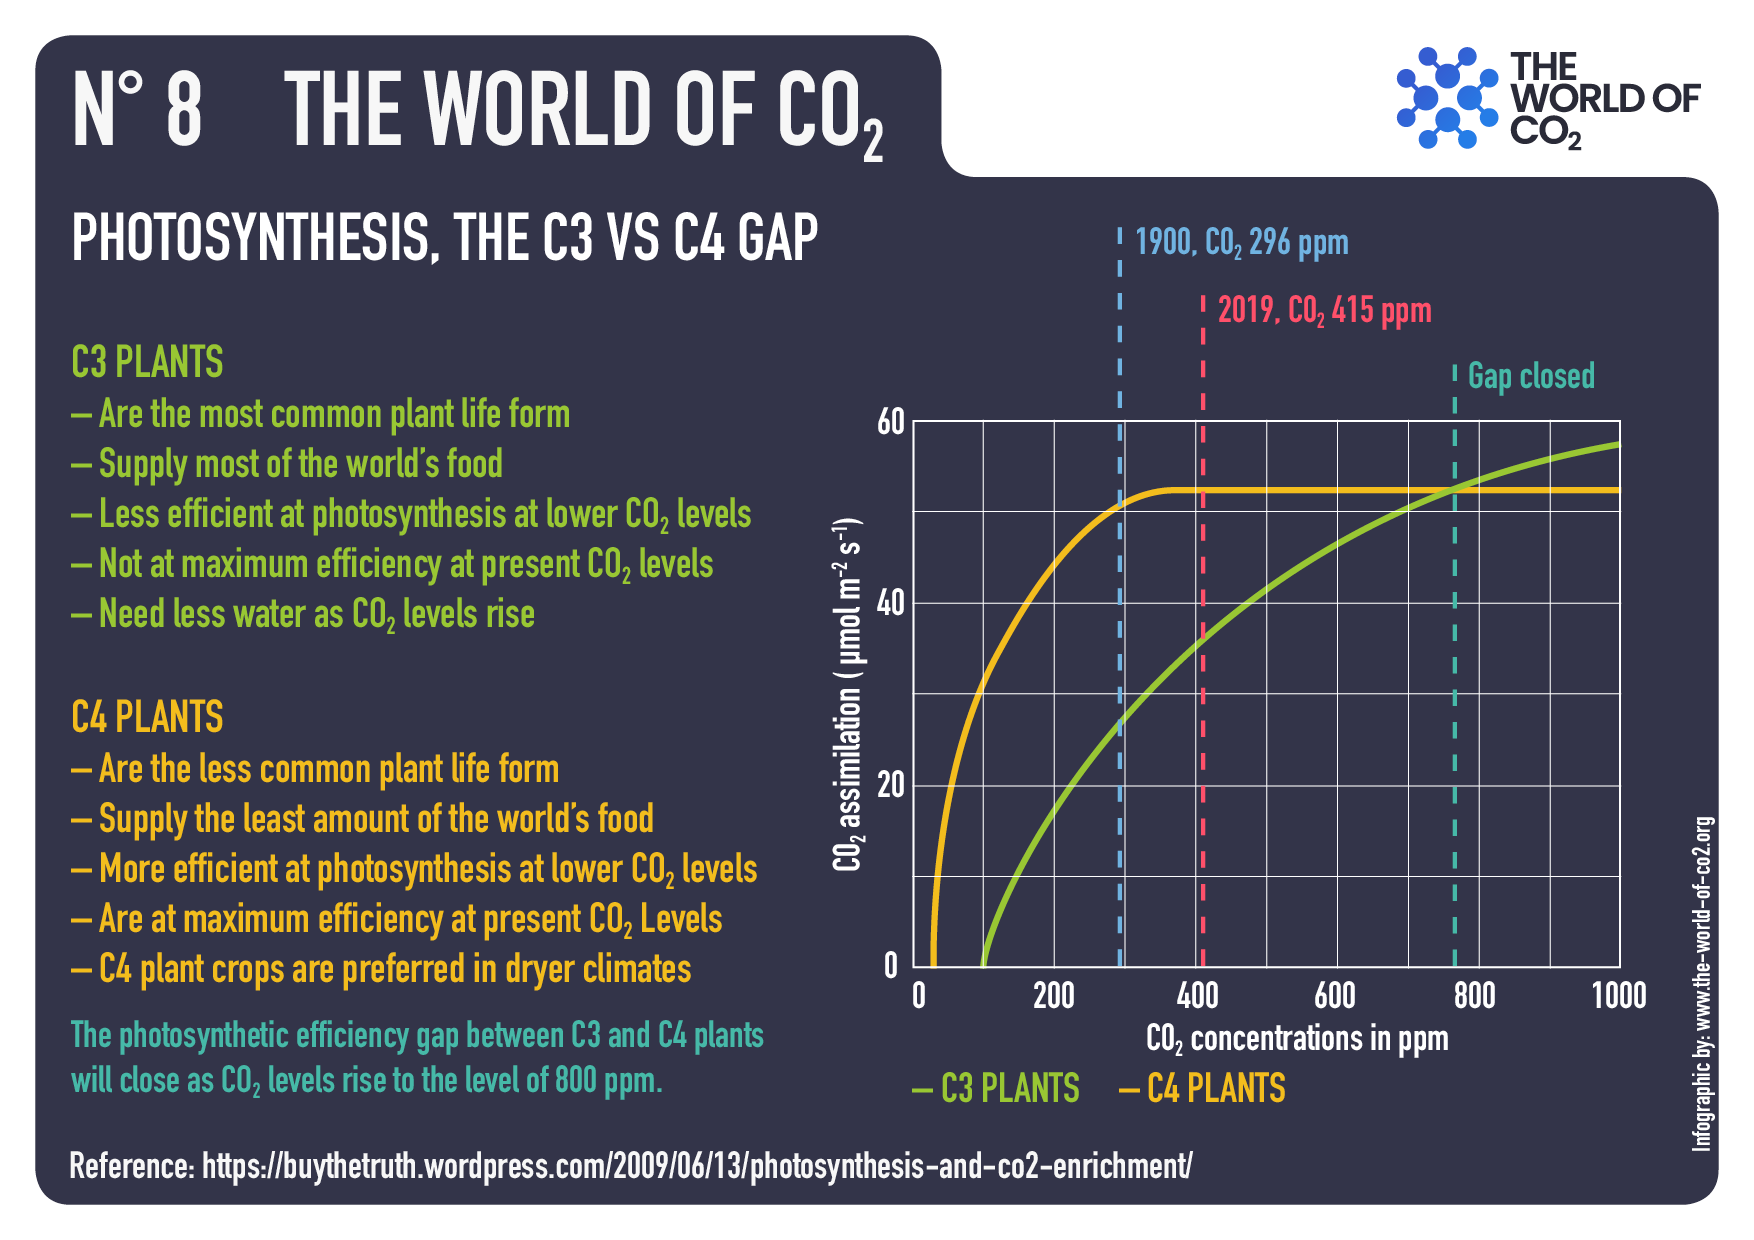
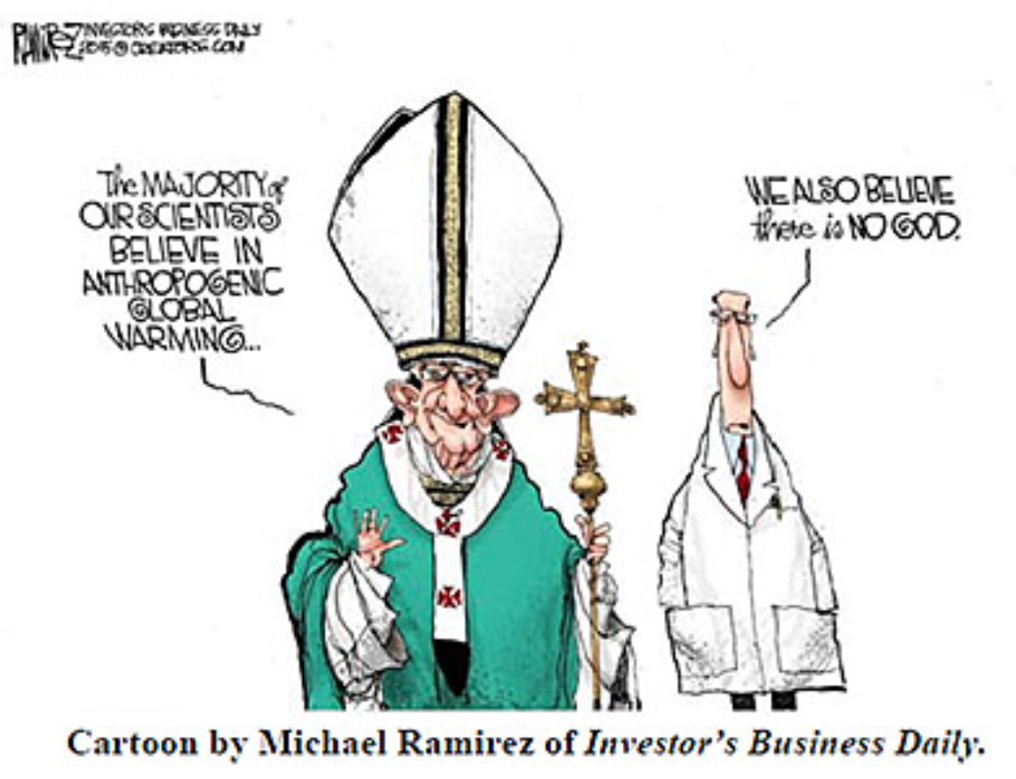
AB: Oh yes. So you’ve really offended in the church of climate. And of course you also stress what’s undeniably true. The greening of the planet is actually a benefit of extra carbon dioxide in the atmosphere. More trees, more plants, more food.
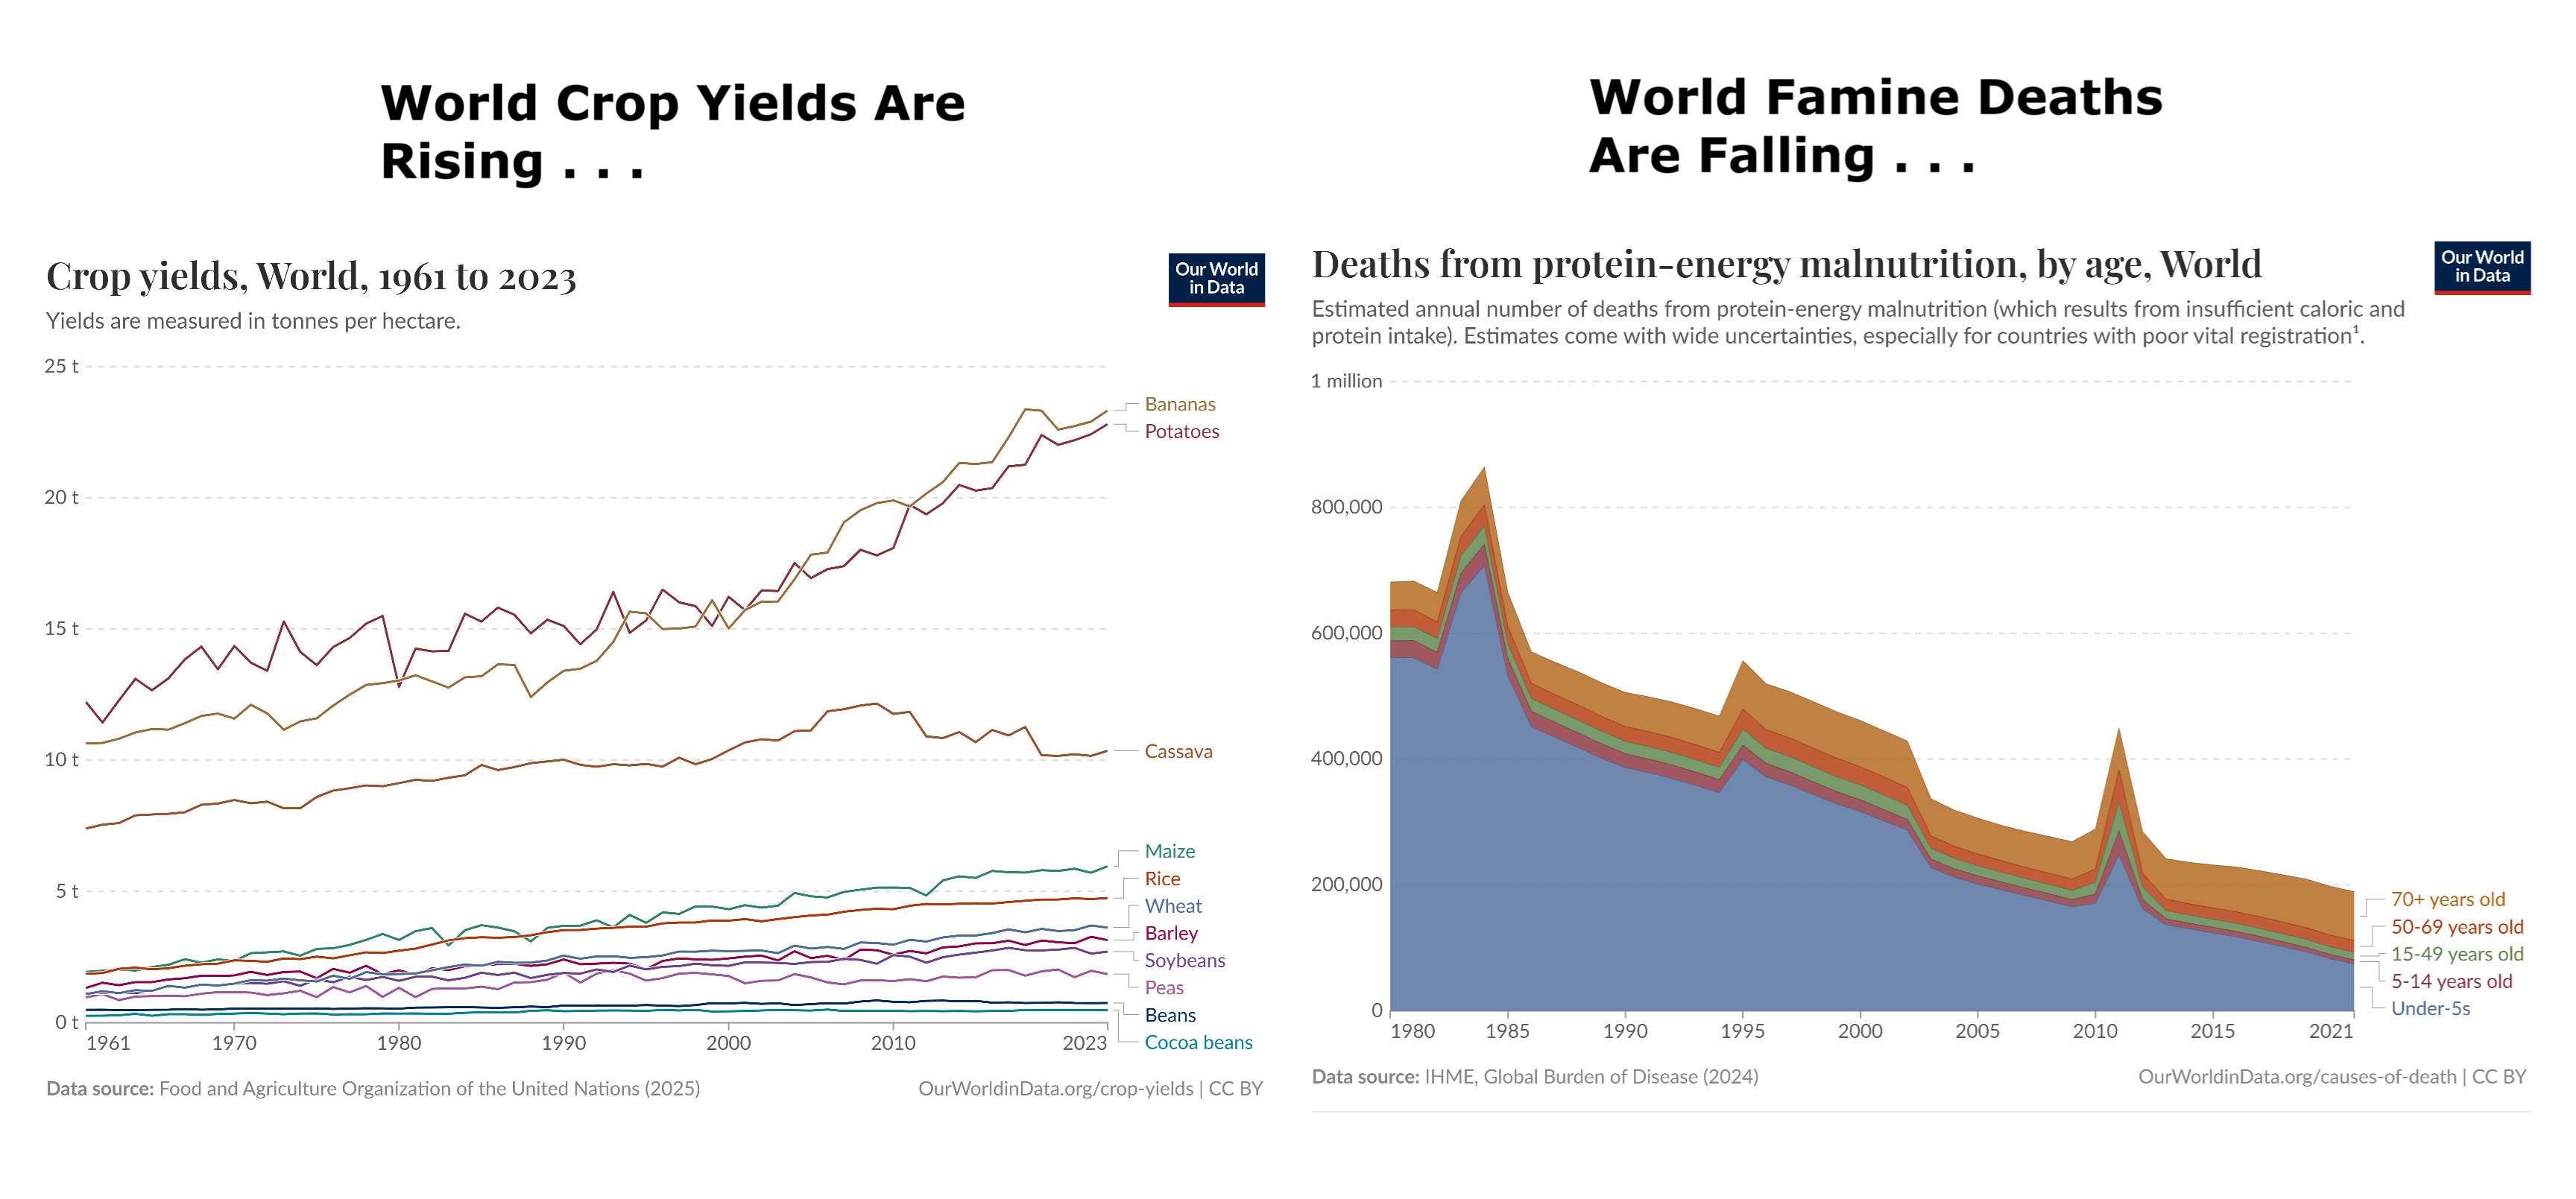
SK: Agricultural yields have in fact doubled over the last 60 years or so. And a good fraction of that, NASA says 75% is attributable to higher carbon dioxide levels. You know, if you look inside a hot house, we put the carbon dioxide levels typically up to about 1,200 parts per million, which is just about three times what you find in the atmosphere even now.
AB: Now, you’ve come under massive attack, of course, Steve Koonin. I mean, environmental groups are even suing to censor the report. You’ve got media outlets of the left demonizing you, running so-called fact checks. I’ve had a look at a few, and they’re not persuasive. Some climate scientists are abusing you, claiming, you know, the group of you are just handpicked skeptics, even though you used to be with the Obama administration. Have there been any criticisms of your report that you think, “Yep, that’s fairenough. we’ve goofed here or we haven’t taken this into consideration. Any criticism you think you can you should take on the chin?
SK: Well, we’ve seen one already that we basically made a a typographical error in one of the footnotes. We have acknowledged that to the person who pointed it out and of course we will fix it. But you know, we’re refraining right now from looking in detail at the criticisms till they come in over the next couple weeks through the public portal. Then as we have promised, we will deal with every serious criticism seriously and like good scientists we will modify the report as might be warranted from those criticisms.
AB: Steve Koonin, you’ve been fighting the alarmism for some time now. I think this is your your weightiest blow against the scaremongering. So congratulations and thank you so much for your time.


 From Inside Climate News comes this example,