With the nomination of Brett Kavanaugh to the Supreme Court, there is lots of speculation about what rulings might be revisited and possibly changed with his addition to the Supreme bench. One topic is the Massachusetts vs. EPA decision which gave EPA the opening to decide CO2 endangered the US population. But many do not yet grasp how flimsy and limited is the CO2 endangerment decision by EPA. As we shall see below, it was narrowly constrained to mobile sources of emissions. To extend that to stationary sources like power plants is a whole different ballgame, and one EPA is unlikely to win even if it tried. That is why the Supreme court stayed the Clean Power Plan, even with Judge Kennedy active. More detail and the technical issues are expounded below.
Robert Henneke writes a fine article in Washington Examiner Trump has a chance to rein in Obama’s out-of-control EPA Henneke is is the general counsel and director of the Center for the American Future at the Texas Public Policy Foundation. Excerpts below in italics with my bolds.
The Environmental Protection Agency has sent its replacement for the Clean Power Plan to the White House. We don’t know what’s in it (it won’t be released until the White House has a chance to review it), but we know what should be and what shouldn’t.
The new plan should restore the rule of law to an out-of-control agency. The EPA must abide by the rules set by Congress, particularly in the Clean Air Act, rather than lawlessly assuming authority it doesn’t have, as it did through the Clean Power Plan. The new plan must not repeat the mistakes of the CPP.
Carbon dioxide is the supervillain in the story of global climate change. The EPA declared even naturally-occurring CO2 as a pollutant in 2009, then sought to regulate it in the Clean Power Plan. Fortunately, the plan was stayed by the Supreme Court before it went into effect, and it remains in legal limbo.
But in December of that year, the advance notice of the new rules, the EPA indicated it would repeat some of the same mistakes of the CPP in its new guidelines.
First, EPA is not allowed to regulate greenhouse gas emissions from stationary sources (power plants) under Section 111 of the Clean Air Act. Why not? Because all emissions from such sources are already regulated under Section 112. Regulators don’t get two bites at that apple.
Congress expressly prohibited such overregulation to avoid burdensome, duplicative rules, and it required the EPA to choose only one avenue. But EPA has regulated coal-and-oil-fired electric generation unit emissions under Section 112 since 2000, and in 2012, it began regulating all fossil fuel-fired electric generation unit emissions under that section.
Second, to proceed under Section 111, the EPA is required to make an endangerment finding under the criteria for stationary sources. But there is no endangerment finding – not under the Obama administration and not now. To justify its overreach, the EPA has pointed to the endangerment finding it made in 2009 in connection with mobile source emissions (cars and trucks, etc.) under a different provision of the Clean Air Act (Section 202).
But that endangerment finding simply doesn’t apply. It doesn’t meet the criteria of Section 111, that a pollutant from stationary sources endangers the public health and welfare. Instead, it found that an aggregate of six different greenhouse gases, emitted by mobile sources, is a danger.
Why is this difference important? Section 111 permits regulation only from “a category of sources . . . [which] significantly causes or contributes significantly to air pollution [that endangers health or welfare].” This “significance” requirement is not found in Section 202.
So, the EPA would have an insurmountable task in finding that American power plants “significantly” cause or contribute to the levels of carbon dioxide thought to aggravate climate change. Carbon dioxide is ubiquitous and worldwide in scope, making any such finding fraught with peril. Given emissions of carbon dioxide worldwide, it is highly unlikely that the EPA can specifically point to greenhouse gas emissions from American power plants as a significant cause of endangerment of health or welfare.
Finally, if the EPA is to regulate carbon dioxide emissions from power plants, it must proceed under Section 108 of the Clean Air Act, not Section 111. Section 108 is the regulatory path Congress prescribed for air pollutants in the “ambient air” emitted from “numerous or diverse” sources, while Section 111 is the instrument for emissions from specific source categories that pose local pollution concerns. Carbon dioxide is the very model of a ubiquitous substance emitted into the “ambient air” from “numerous or diverse” sources. EPA cannot short-circuit the regulatory framework hard written into the Clean Air Act under section 108 by jumping to another section of the act.
The Clean Power Plan represents the worst of the regulatory abuses of the Obama administration. Its mistakes must not be repeated.
When it comes to the new plan, less is more. Texas serves as the model for success, where a deregulated electricity markethas resulted in abundant energy and cleaner power plants as electricity companies adopt the latest technologies as a way to increase efficiencies and maximize profit, all while resulting in a cleaner environment.
That’s the way forward for the Clean Power Plan’s replacement.
Economist Joseph Stiglitz writes of climate change: “There is a point at which, once this harm occurs, it cannot be undone at any reasonable cost or in any reasonable period of time. Based on the best available science, our country is close to approaching that point.” Credit: Win McNamee/Getty Images
One of the world’s top economists has written an expert court report that forcefully supports a group of children and young adults who have sued the federal government for failing to act on climate change. (Source: Inside Climate News here) Excerpts in italics with my bolds.
Stiglitz, a Columbia University economics professor and former World Bank chief economist, concludes that increasing global warming will have huge costs on society and that a fossil fuel-based system “is causing imminent, significant, and irreparable harm to the Youth Plaintiffs and Affected Children more generally.” He explains in a footnote that his analysis also examines impacts on “as-yet-unborn youth, the so-called future generations.”
But, he says, acting on climate change now—by imposing a carbon tax and cutting fossil fuel subsidies, among other steps—is still manageable and would have net-negative costs. He argues that if the government were to pursue clean energy sources and energy-smart technologies, “the net benefits of a policy change outweigh the net costs of such a policy change.”
“Defendants must act with all deliberate speed and immediately cease the subsidization of fossil fuels and any new fossil fuel projects, and implement policies to rapidly transition the U.S. economy away from fossil fuels,” Stiglitz writes. “This urgent action is not only feasible, the relief requested will benefit the economy.”
Stiglitz has been examining the economic impact of global warming for many years. He was a lead author of the 1995 report of the UN’s Intergovernmental Panel on Climate Change, an authoritative assessment of climate science that won the IPCC the 2007 Nobel Peace Prize, shared with Al Gore.
The Stiglitz expert report submitted to the court is here.
An Example of Intentional Omissions
Since this is a legal proceeding, Stiglitz wrote a brief telling the plaintiffs’ side of the story. In a scientific investigation, parties would assert theories attempting to explain all of the evidence at hand. Legal theories have no such requirement to incorporate all the facts, but rather present conclusions informed by the evidence deemed strongest and most pertinent to one party’s interests.
While the Pope accuses us with the Sin of Emissions, we counter with the Sins of Omissions by him and his fellow activists.
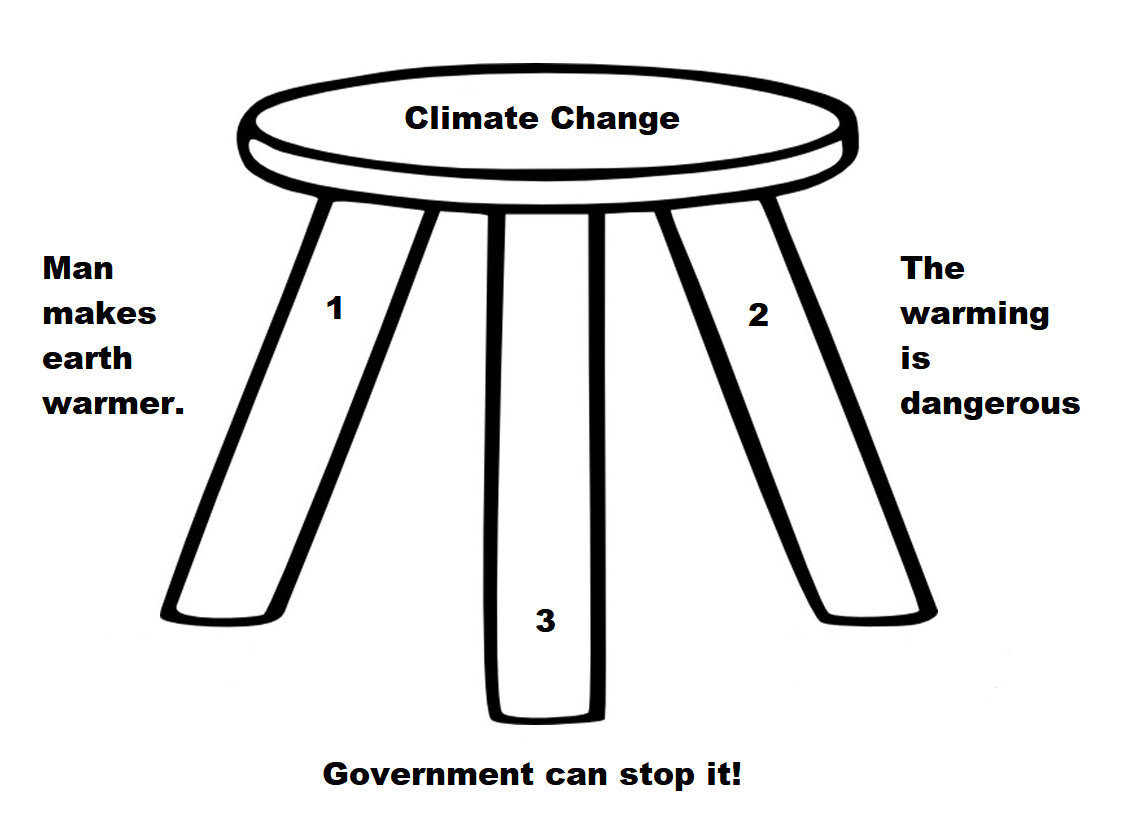
Let’s consider the Stiglitz brief according to the three suppositions comprising the Climatist (Activists and Alarmists) position. Climate change is a bundle that depends on all three assertions to be true.
Supposition 1: Humans make the climate warmer.
As an economist, Stiglitz defers to the IPCC on this scientific point, with references to reports by those deeply involved and committed to Paris Accord and other UN climate programs. In the recent California District Court case (Cities suing Big Oil companies), both sides in a similar vein stipulated their acceptance of IPCC reports as authoritative regarding global warming/climate change.
Skeptical observers must attend to the nuances of what is referenced and what is hidden or omitted in these testimonies. For example, Chevron’s attorney noted that IPCC’s reports express various opinions over time as to human influence on the climate. They noted that even today, the expected temperature effect from doubling CO2 ranges widely from 1.5C to 4.5C. No mention is made that several more recent estimates from empirical data (rather than GCMs) are at the low end or lower.
In addition, there is no mention that GCMs projections are running about twice as hot as observations. Omitted is the fact GCMs correctly replicate tropospheric temperature observations only when CO2 warming is turned off. In the effort to proclaim scientific certainty, neither Stiglitz nor IPCC discuss the lack of warming since the 1998 El Nino, despite two additional El Ninos in 2010 and 2016.
Figure 5. Simplification of IPCC AR5 shown above in Fig. 4. The colored lines represent the range of results for the models and observations. The trends here represent trends at different levels of the tropical atmosphere from the surface up to 50,000 ft. The gray lines are the bounds for the range of observations, the blue for the range of IPCC model results without extra GHGs and the red for IPCC model results with extra GHGs.The key point displayed is the lack of overlap between the GHG model results (red) and the observations (gray). The nonGHG model runs (blue) overlap the observations almost completely.
Further they exclude comparisons between fossil fuel consumption and temperature changes. The legal methodology for discerning causation regarding work environments or medicine side effects insists that the correlation be strong and consistent over time, and there be no confounding additional factors. As long as there is another equally or more likely explanation for a set of facts, the claimed causation is unproven. Such is the null hypothesis in legal terms: Things happen for many reasons unless you can prove one reason is dominant.
Finally, Stiglitz and IPCC are picking on the wrong molecule. The climate is controlled not by CO2 but by H20. Oceans make climate through the massive movement of energy involved in water’s phase changes from solid to liquid to gas and back again. From those heat transfers come all that we call weather and climate: Clouds, Snow, Rain, Winds, and Storms.
Esteemed climate scientist Richard Lindzen ended a very fine recent presentation with this description of the climate system:
I haven’t spent much time on the details of the science, but there is one thing that should spark skepticism in any intelligent reader. The system we are looking at consists in two turbulent fluids interacting with each other. They are on a rotating planet that is differentially heated by the sun. A vital constituent of the atmospheric component is water in the liquid, solid and vapor phases, and the changes in phase have vast energetic ramifications. The energy budget of this system involves the absorption and reemission of about 200 watts per square meter. Doubling CO2 involves a 2% perturbation to this budget. So do minor changes in clouds and other features, and such changes are common. In this complex multifactor system, what is the likelihood of the climate (which, itself, consists in many variables and not just globally averaged temperature anomaly) is controlled by this 2% perturbation in a single variable? Believing this is pretty close to believing in magic. Instead, you are told that it is believing in ‘science.’ Such a claim should be a tip-off that something is amiss. After all, science is a mode of inquiry rather than a belief structure.
Supposition 2: The Warming is Dangerous
Billions of dollars have been spent researching any and all negative effects from a warming world: Everything from Acne to Zika virus. Stiglitz links to a recent Climate Report that repeats the usual litany of calamities to be feared and avoided by submitting to IPCC demands. The evidence does not support these claims.
Stiglitz: It is scientifically established that human activities produce GHG emissions, which accumulate in the atmosphere and the oceans, resulting in warming of Earth’s surface and the oceans, acidification of the oceans, increased variability of climate, with a higher incidence of extreme weather events, and other changes in the climate.
Moreover, leading experts believe that there is already more than enough excess heat in the climate system to do severe damage and that 2C of warming would have very significant adverse effects, including resulting in multi-meter sea level rise.
Experts have observed an increased incidence of climate-related extreme weather events, including increased frequency and intensity of extreme heat and heavy precipitation events and more severe droughts and associated heatwaves. Experts have also observed an increased incidence of large forest fires; and reduced snowpack affecting water resources in the western U.S. The most recent National Climate Assessment projects these climate impacts will continue to worsen in the future as global temperatures increase.
Alarming Weather and Wildfires
But: Weather is not more extreme. And Wildfires were worse in the past. But: Sea Level Rise is not accelerating. Litany of Changes
Seven of the ten hottest years on record have occurred within the last decade; wildfires are at an all-time high, while Arctic Sea ice is rapidly diminishing.
We are seeing one-in-a-thousand-year floods with astonishing frequency.
When it rains really hard, it’s harder than ever.
We’re seeing glaciers melting, sea level rising.
The length and the intensity of heatwaves has gone up dramatically.
Plants and trees are flowering earlier in the year. Birds are moving polewards.
We’re seeing more intense storms.
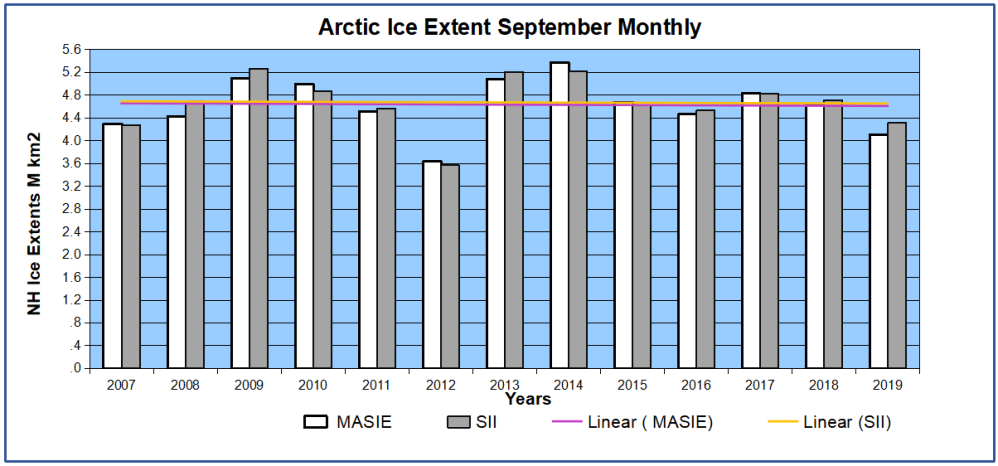
But: Arctic Ice has not declined since 2007.
But: All of these are within the range of past variability.
In fact our climate is remarkably stable.
And many aspects follow quasi-60 year cycles.
Climate is Changing the Weather
Stiglitz: Other potential examples include agricultural losses. Whether or not insurance reimburses farmers for their crops, there can be food shortages that lead to higher food prices (that will be borne by consumers, that is, Youth Plaintiffs and Affected Children). There is a further risk that as our climate and land use pattern changes, disease vectors may also move (e.g., diseases formerly only in tropical climates move northward).36 This could lead to material increases in public health costs
But: Actual climate zones are local and regional in scope, and they show little boundary change.
But: Ice cores show that it was warmer in the past, not due to humans.
Supposition 3: Government Can Stop it!
Here it is blithely assumed that the court can rule the seas to stop rising, heat waves to cease, and Arctic ice to grow (though why we would want that is debatable). All this will be achieved by leaving fossil fuels in the ground and powering civilization with windmills and solar panels. While admitting that our way of life depends on fossil fuels, they ignore the inadequacy of renewable energy sources at their present immaturity.
Stiglitz: Conclusion The choice between incurring manageable costs now and the incalculable, perhaps even irreparable, burden Youth Plaintiffs and Affected Children will face if Defendants fail to rapidly transition to a non-fossil fuel economy is clear. While the full costs of the climate damages that would result from maintaining a fossil fuel-based economy may be incalculable, there is already ample evidence concerning the lower bound of such costs, and with these minimum estimates, it is already clear that the cost of transitioning to a low/no carbon economy are far less than the benefits of such a transition. No rational calculus could come to an alternative conclusion. Defendants must act with all deliberate speed and immediately cease the subsidization of fossil fuels and any new fossil fuel projects, and implement policies to rapidly transition the U.S. economy away from fossil fuels.
But CO2 relation to Temperature is Inconsistent.
But: The planet is greener because of rising CO2.
But: Modern nations (G20) depend on fossil fuels for nearly 90% of their energy.
But: Renewables are not ready for prime time.
People need to know that adding renewables to an electrical grid presents both technical and economic challenges. Experience shows that adding intermittent power more than 10% of the baseload makes precarious the reliability of the supply. South Australia is demonstrating this with a series of blackouts when the grid cannot be balanced. Germany got to a higher % by dumping its excess renewable generation onto neighboring countries until the EU finally woke up and stopped them. Texas got up to 29% by dumping onto neighboring states, and some like Georgia are having problems.
But more dangerous is the way renewables destroy the economics of electrical power. Seasoned energy analyst Gail Tverberg writes:
In fact, I have come to the rather astounding conclusion that even if wind turbines and solar PV could be built at zero cost, it would not make sense to continue to add them to the electric grid in the absence of very much better and cheaper electricity storage than we have today. There are too many costs outside building the devices themselves. It is these secondary costs that are problematic. Also, the presence of intermittent electricity disrupts competitive prices, leading to electricity prices that are far too low for other electricity providers, including those providing electricity using nuclear or natural gas. The tiny contribution of wind and solar to grid electricity cannot make up for the loss of more traditional electricity sources due to low prices.
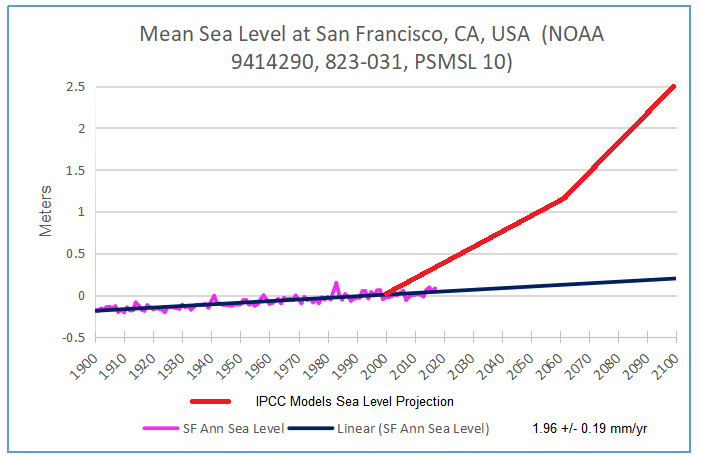
Footnote regarding mention of “multi-meter” sea level rise. It is all done with computer models. For example, below is San Francisco. More at USCS Warnings of Coastal Floodings
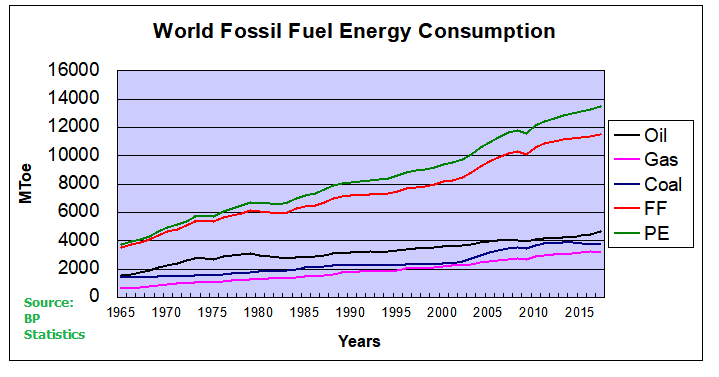
Previous posts addressed the claim that fossil fuels are driving global warming. This post updates that analysis with the latest (2017) numbers from BP Statistics and compares World Fossil Fuel Consumption (WFFC) with three estimates of Global Mean Temperature (GMT). More on both these variables below.
The reporting categories are:
Oil
Natural Gas
Coal
Nuclear
Hydro
Renewables (other than hydro)
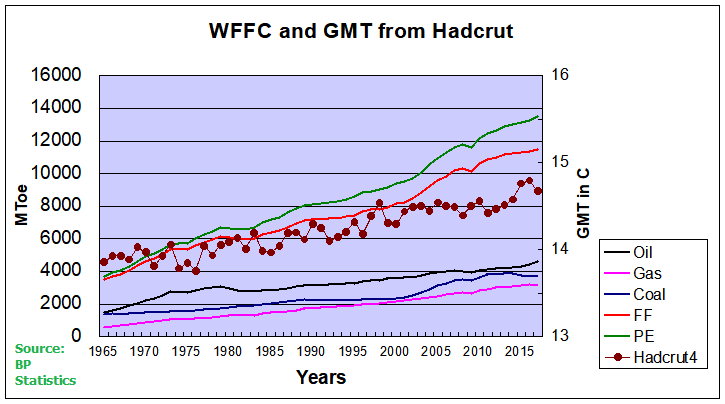
This analysis combines the first three, Oil, Gas, and Coal for total fossil fuel consumption world wide. The chart below shows the patterns for WFFC compared to world consumption of Primary Energy from 1965 through 2017.
The graph shows that Primary Energy consumption has grown continuously for 5 decades. Over that period oil, gas and coal (sometimes termed “Thermal”) averaged 89% of PE consumed, ranging from 94% in 1965 to 85% in 2017. MToe is millions of tons of oil equivalents.
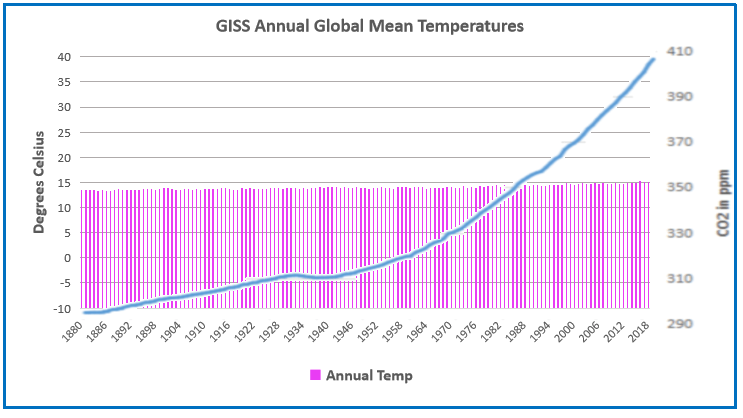
Global Mean Temperatures
Everyone acknowledges that GMT is a fiction since temperature is an intrinsic property of objects, and varies dramatically over time and over the surface of the earth. No place on earth determines “average” temperature for the globe. Yet for the purpose of detecting change in temperature, major climate data sets estimate GMT and report anomalies from it.
UAH record consists of satellite era global temperature estimates for the lower troposphere, a layer of air from 0 to 4km above the surface. HadSST estimates sea surface temperatures from oceans covering 71% of the planet. HADCRUT combines HadSST estimates with records from land stations whose elevations range up to 6km above sea level.
Both GISS LOTI (land and ocean) and HADCRUT4 (land and ocean) use 14.0 Celsius as the climate normal, so I will add that number back into the anomalies. This is done not claiming any validity other than to achieve a reasonable measure of magnitude regarding the observed fluctuations.
No doubt global sea surface temperatures are typically higher than 14C, more like 17 or 18C, and of course warmer in the tropics and colder at higher latitudes. Likewise, the lapse rate in the atmosphere means that air temperatures both from satellites and elevated land stations will range colder than 14C. Still, that climate normal is a generally accepted indicator of GMT.
Correlations of GMT and WFFC
The next graph compares WFFC to GMT estimates over the five decades from 1965 to 2017 from HADCRUT4, which includes HadSST3.
Over the last five decades the increase in fossil fuel consumption is dramatic and monotonic, steadily increasing by 227% from 3.5B to 11.5B oil equivalent tons. Meanwhile the GMT record from Hadcrut shows multiple ups and downs with an accumulated rise of 0.9C over 52 years, 6% of the starting value.
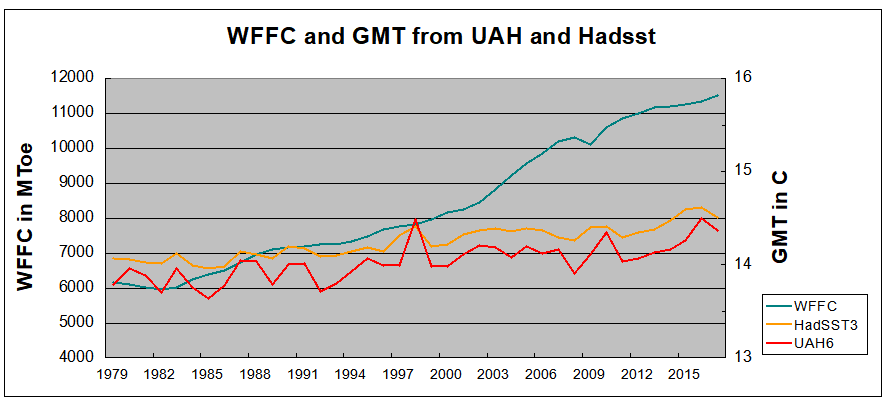
The second graph compares to GMT estimates from UAH6, and HadSST3 for the satellite era from 1979 to 2017, a period of 38 years.
In the satellite era WFFC has increased at a compounded rate of nearly 2% per year, for a total increase of 87% since 1979. At the same time, SST warming amounted to 0.44C, or 3.1% of the starting value. UAH warming was 0.58C, or 4.2% up from 1979. The temperature compounded rate of change is 0.1% per year, an order of magnitude less. Even more obvious is the 1998 El Nino peak and flat GMT since.
Summary
The climate alarmist/activist claim is straight forward: Burning fossil fuels makes measured temperatures warmer. The Paris Accord further asserts that by reducing human use of fossil fuels, further warming can be prevented. Those claims do not bear up under scrutiny.
It is enough for simple minds to see that two time series are both rising and to think that one must be causing the other. But both scientific and legal methods assert causation only when the two variables are both strongly and consistently aligned. The above shows a weak and inconsistent linkage between WFFC and GMT.
Going further back in history shows even weaker correlation between fossil fuels consumption and global temperature estimates:
Figure 5.1. Comparative dynamics of the World Fuel Consumption (WFC) and Global Surface Air Temperature Anomaly (ΔT), 1861-2000. The thin dashed line represents annual ΔT, the bold line—its 13-year smoothing, and the line constructed from rectangles—WFC (in millions of tons of nominal fuel) (Klyashtorin and Lyubushin, 2003). Source: Frolov et al. 2009
In legal terms, as long as there is another equally or more likely explanation for the set of facts, the claimed causation is unproven. The more likely explanation is that global temperatures vary due to oceanic and solar cycles. The proof is clearly and thoroughly set forward in the post Quantifying Natural Climate Change.
As the stool above shows, the climate change package sits on three premises. The first is the science bit, consisting of an unproven claim that observed warming is caused by humans burning fossil fuels. The second part rests on impact studies from billions of research dollars spent uncovering any and all possible negatives from warming. And the third leg is climate policies showing how governments can “fight climate change.”
The call for climate action depends on proponents providing convincing answers to questions regarding all three dimensions. H/T to Master Resource for pointing to essays by William Niskonen and Steven Horwitz setting forth the issues to be resolved. I will refer to excerpts from Global Warming Is about Social Science Too by Horowitz.
To help clarify what’s at stake, I offer a list of questions that are (or should be) at the center of the debate over anthropogenic (human-caused) global warming. I will provide some quick commentary on some to note their importance and then conclude with what I see as the importance of this list.
Matters of Science
1. Is the planet getting warmer?
2. If it’s getting warmer, is that warming caused by humans? Obviously this is a big question because if warming is not human-caused, then it’s not clear how much we can do to reduce it. What we might do about the consequences, however, remains an open question.
3. If it’s getting warmer, by what magnitude? If the magnitude is large, then there’s one set of implications. But if it’s small, then, as we’ll see, it might not be worth responding to. This is a good example of a scientific question with large implications for policy.
My Comment: Most people studying climate science agree that it has warmed about a degree celsius since the end of the Little Ice Age (~1850). But there have been multi-decadal periods of warming and cooling as well as the current plateau in temperatures. As well, there are many places (e.g.almost 1/3 of US stations) showing cooling while other places have warming trends. Skeptics note that no one has yet separated natural warming from man-made warming. In the record, natural warming prior to the 1940s matches almost exactly the warming from 1970s to 2000, claimed to be man-made.
Horowitz continues: All these questions are presumably matters of science. In principle we ought to be able to answer them using the tools of science, even if they are complex issues that involve competing interpretations and methods. Let’s assume the planet is in fact warming and that humans are the reason.
Impacts of Warming
4. What are the costs of global warming? This question is frequently asked and answered.
5. What are the benefits of global warming? This question needs to be asked as well, as global warming might bring currently arctic areas into a more temperate climate that would enable them to become sources of food. Plus, a warmer planet might decrease the demand for fossil fuels for heating homes and businesses in those formerly colder places.
6. Do the benefits outweigh the costs or do the costs outweigh the benefits? This is also not frequently asked. Obviously, if the benefits outweigh the costs, then we shouldn’t be worrying about global warming. Two other points are worth considering. First, the benefits and costs are not questions of scientific fact because how we do the accounting depends on all kinds of value-laden questions. But that doesn’t mean the cost-benefit comparison isn’t important. Second, this question might depend greatly on the answers to the scientific questions above. In other words: All questions of public policy are ones that require both facts and values to answer. One cannot go directly from science to policy without asking the kinds of questions I’ve raised here.
Rotterdam Adaptation Policy–Ninety years thriving behind dikes and dams.
Climate Policies
7. If the costs outweigh the benefits, what sorts of policies are appropriate? There are many too many questions here to deal with in detail, but it should be noted that disagreements over what sorts of policies would best deal with the net costs of global warming are, again, matters of both fact and value, or science and social science.
8. What are the costs of the policies designed to reduce the costs of global warming? This question is not asked nearly enough. Even if we design policies on the blackboard that seem to mitigate the effects of global warming, we have to consider, first, whether those policies are even likely to be passed by politicians as we know them, and second, whether the policies might have associated costs that outweigh their benefits with respect to global warming. So if in our attempt to reduce the effects of global warming we slow economic growth so far as to impoverish more people, or we give powers to governments that are likely to be used in ways having little to do with global warming, we have to consider those results in the total costs and benefits of using policy to combat global warming. This is a question of social science that is no less important than the scientific questions I began with.
I could add more, but this is sufficient to make my key points. First, it is perfectly possible to accept the science of global warming but reject the policies most often put forward to combat it. One can think humans are causing the planet to warm but logically and humanely conclude that we should do nothing about it.
Second, people who take that position and back it up with good arguments should not be called “deniers.” They are not denying the science; they are questioning its implications. In fact, those who think they can go directly from science to policy are, as it turns out, engaged in denial – denial of the relevance of social science.
Steven Horwitz is the Schnatter Distinguished Professor of Free Enterprise in the Department of Economics at Ball State University, where he also is a Fellow at the John H. Schnatter Institute for Entrepreneurship and Free Enterprise. He is the author of Hayek’s Modern Family: Classical Liberalism and the Evolution of Social Institutions.
Climate science, impacts and policies also appear as a house of cards.
A recently published study on climate change predicts catastrophic changes to the planet’s ecology, even if global temperatures rise by only 1.5 degrees Celsius, a cap on warming the Paris Climate Accord aims to secure.
Foretelling the Future
The new study, performed by an international research group and published in the journal Nature on June 7, predicts catastrophic changes to the planet even if Paris Accord emission targets are met.
According to Phys.org, many studies predict that a 2 degree increase would lead to massive climatic and ecological changes, but few have examined what would happen if the temperature rose by only 1.5 degrees instead. While this fraction of a degree might seem unimportant, it actually means a lot on a global scale, researchers say.
Apocalypse Now
If today’s temperature trend continues until 2100, then many inhabited islands as well as many coastal cities will be swallowed by the sea, with the Maldives being just one example. The Paris Agreement was signed with the stated aim of preventing this catastrophe by limiting global warming to only 1.5 C.
However, the new study says that while a hard limit keeping the temperature increase fewer than 2 C would avert drastic changes, such as the Mediterranean drying up or US cities getting 5 C hotter than they are now, the exact character of the global warming curve is more important to overall climate change effects than most people understand. For example, if global temperature even briefly increases by 2 C overall but then falls back, that would also cause irreparable damage.
“The extinction of species during a phase of excess temperatures couldn’t be undone, even if the level of warming was then reduced and limited to a 1.5 C increase,” says ETH Zurich (Swiss Federal Institute of Technology) professor Sonia Seneviratne, one of the lead authors of the study.
No Escape, No Silver Bullet
According to Seneviratne, many existing scenarios on climate change mitigation actually allow for a temporary 2 C degree increase and also involve vast CO2-reducing measures, which include reforestation, carbon capture and storage operations (CCS). However, CCS is not yet a viable option, as humanity does not have any effective and scalable means to return carbon from the air to the ground for good. Even the much-advertised “negative emissions” power plant in Iceland is not as great in reality as it looks on paper. Besides, even in theory, CCS needs so much space to work that it’s comparable to the world’s food production operations.
Therefore, Seneviratne says, the only way to save the world now is to immediately and dramatically cut CO2 emissions.
“It’s clear that we must urgently reduce emissions if we want to stand a chance of meeting the 1.5 C goal and keeping any temperature overshoot as low as possible,” Seneviratne emphasized.
The Usual Bad Guys
In 2015, China was the number one carbon dioxide-emitting country, with almost 30 percent of the world’s fossil fuel CO2 emissions, according to the data from the EU’s Emissions Database for Global Atmospheric Research. The US took second place, emitting almost half as much as China does, slightly below 15 percent of the world’s total. Despite all their efforts, the European Union as a whole takes proud third place with 9.6 percent, followed by India, which produces 6.8 percent of the world’s fossil fuel carbon emissions.
Women, Children and Minorities Hit Hardest By the World Ending
Unfortunately, drastic carbon emission cuts will also mean drastic changes to modern social and economic life, consequences the US has recently and notably refused to countenance by backing out of the global climate accord.
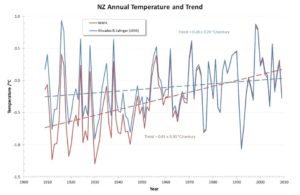
de Freitas finds that New Zealand has experienced an insignificant warming trend of 0.28°C/century during 1909-2008. Using the same data, the Mullan Report calculates that trend at 0.91°C/century. Both studies claim to apply the statistical technique described in RS93, and each alleges that the other has departed from that methodology. This core issue has been described in the graph above but has not been addressed in this note.
A second core issue relates to reliance upon inhomogeneous Auckland and Wellington data despite the extensive contamination of both sites by sheltering and UHI. That matter has not been addressed here either.
Instead, this limited reply deals with the raft of peripheral allegations contained in the NIWA Comment. In particular, it sets out to show that all plausible published records, as well as the scientific literature, support the view that New Zealand’s temperature record has remained remarkably stable over the past century or so.
Some of the Issues Rebutted
Other temperature records:
The de Freitas warming trend of 0.28°C/century is wholly consistent with the synchronous Southern Hemisphere trend reported in IPPC’s AR5. Both the IPCC and NIWA have long reported that anthropogenic warming trends in ocean-dominated New Zealand would be materially lower than global averages. The S81/Mullan Report trend of 0.91°C/century is clearly anomalous.
Official New Zealand temperature records for eight years in the 1860s, which are both reliable and area-representative, show the absolute mean temperature was then 13.1°C. A 30-year government record for the period ending 1919 shows the mean temperature to be 12.8°C. The current normal (30-year) mean 7SS temperature is 12.9°C. Clearly, New Zealand mean temperatures have remained almost perfectly stable during the past 150 years.
Use of RS93 Statistical Method:
The Mullan Report (along with other NIWA articles that are not publicly available) does purport to use RS93 comparison techniques, so this assertion is naturally accepted whenever these ‘grey’ papers are mentioned in the peer-reviewed literature. However, the Mullan Report sits outside the literature and clearly fails to execute its stated intention to apply RS93 methods. The de Freitas paper rectifies those omissions.
NZ Glaciers
In this area, the most recent authority is Mackintosh et al. (2017), entitled “Regional cooling caused recent New Zealand glacier advances in a period of global warming.” After observing that at least 58 Southern Alps glaciers advanced during the period 1983-2008, the abstract notes:
“Here we show that the glacier advance phase resulted predominantly from discrete periods of reduced air temperature, rather than increased precipitation. The lower temperatures were associated with anomalous southerly winds and low sea surface temperature in the Tasman Sea region. These conditions result from variability in the structure of the extratropical atmospheric circulation over the South Pacific.”
This Nature paper, of which James Renwick was an author, notes that the World Glacier Monitoring Service database shows that in 2005 “15 of the 26 advancing glaciers observed worldwide were in New Zealand.”
BEST Data
Using up to 52 auto-adjusted datasets1, the Berkeley Earth group derives an absolute New Zealand temperature range of 9.5°C to 11°C over the 160-year period from 1853 to 2013.
The mid-point of this range is very far from the mid-point of the 12.3°C to 13.2°C range recorded in the 7SS (whether raw or adjusted) and is clearly wrong. Nonetheless, for the 100-year period 1909-2008, the BEST adjusted anomalies are said to show a 100% perfect correlation with those of the Mullan Report (to three decimal points). The claimed independence of such an immaculate outcome is entirely implausible.
Anthropogenic Warming
The Mullan Report’s 1960-90 upwards spike could not have occurred whilst the south-west Pacific region was in a cooling phase – which is confirmed by Mackintosh et al. (2017). Further, the final 30-year period of the Mullan Report shows an insignificant trend of only 0.12°C/century, demonstrating that New Zealand has not yet been affected by global warming trends.
Summary
Good to see that de Fritas et al are again speaking climate truth to entrenched alarmists. Go Kiwis!
Thanks to Friends of Science in Calgary for hosting Award-winning Dutch filmmaker Marijn Poels and Canadian climate change scientist Dr. Madhav Khandekar. They dismantled the dogma of Global Editors Network and Dr. Suzuki-style climate hysteria in one evening at Friends of Science Society’s 15th Annual Event entitled: “Extreme Climate Uncertainty.”
Full story is Inquiry not Dogma, which includes links and background information. Excerpts with my bolds.
Poels challenged the audience with evidence that food security is at risk due to ‘green’ energy policies while Dr. Khandekar deconstructed climate alarmism with convincing evidence that extreme weather is mostly media hype.
Left-wing, progressive Poels recounted to the Friends of Science event audience how he had worked in conflict and poverty countries for nine years, making 50 films in that time. When he returned home to Europe for some recovery time in the pastoral countryside, he was surprised, then alarmed to find that EU climate and energy policies were trading food security for unreliable, expensive ‘energy’ security. Curious to find the root of this strange set of policies, Poels followed the money and policy to talk with climate scientists and agricultural experts.
Poels noted that he had a broad-reaching, very supportive media network for his human rights and justice films; this dried up the moment he broached the topic of climate change.His 2017 documentary film exposed how climate change policies are threatening modern civilization. Trailer can be viewed below. My recent post on this subject was Climate Policies Failure, the Movie.
Dr. Madhav Khandekar, former Environment Canada researcher, gave a lively, humorous presentation that debunked the claims of extreme weather being more frequent or caused by human influence on climate or human industrial carbon dioxide emissions. Khandekar explained some of the intricacies of the global effects of the natural, cyclical El Nino Southern Oscillation and its mirror image, La Nina. Overall, Khandekar says the only noticeable trends are toward longer cold snaps, a possible harbinger of long periods of cold and erratic weather as experienced in the Little Ice Age, during a solar minimum.
Khandekar was an instructor at the University of Alberta early on in his career, an institution now embroiled in a vigorous public debate about the propriety of conferring an honorary degree on Dr. David Suzuki at this spring’s convocation.
Friends of Science Society posted an open letter on their blog on May 9, 2018, addressed to the president of the University of Alberta, expressing their views on the matter. After describing the details of Suzuki’s destructive behavior, the letter concludes with the following summary:
Friends of Science Society University of Alberta grad members are not upset that Dr. Suzuki holds controversial views because they value freedom of speech. More so, they value scientific integrity. They are upset that he spouts false and misleading diatribes on scientific topics – contrary to all the careful and accurate scientific methods that they learned as students at the University of Alberta.
And they are very upset that you choose to honor that.
Our members have not only seen job loss for themselves or their employees, they have experienced the tragic consequences of lives lost through suicide as careers, finances, families and business enterprises fall apart.
For no good reason.
Under your leadership, Dr. Turpin, the University of Alberta embarked on a program entitled “For the Public Good.” Now you want to honor a high-profile public figure, someone whose uninformed and misleading activism, has aided the destruction of the economy in Alberta, whose unsupported activist rhetoric has done untold damage to the Canadian economy and whose statements have damaged our international reputation as a reliable and fair place to do business. The outcomes include personal catastrophe for hundreds of thousands of people, many of them University of Alberta alumni. How is that for the public good?
In our opinion, based on the foregoing evidence, Dr. Suzuki’s actions and words are not congruent with the skills learned in the physical sciences, environmental or business management at the University of Alberta. They are not in keeping with the expectations of its graduates or faculty members, nor with its own Code of Ethics, nor with the values you express in your statement meant to validate your decision to honor Dr. Suzuki.
We ask that you rescind the offer of the honorary degree to Dr. David Suzuki.
The video is a recent interview with Piers Corbyn of Weather Action making the case for a cooling climate over the next twenty years. H/T to iceagenow for the link. I made a loose transcription to express the main points made by Corbyn.
The sun rules the sea temperature and the sea temperature rules the climate.
The truth is the levels of CO2 in the atmosphere are beyond the control of man. And furthermore, the levels of CO2 themselves do not have any impact on climate.
All sides agree there are 50 times more CO2 in the ocean than in the air. The level between them and the saturation level in the atmosphere will be set by the ocean. Warm up the ocean a bit and more gas will come, cool it and more gas will be absorbed. Because oceanic CO2 is 50 times larger, anything man does to atmospheric levels does not matter. If man, or nature, or insects put more CO2 into the air, it will just go into the ocean, depending on the sea temperature. The equilibrium levels will follow Henry’s law of gas solubility.
What we have happening now is the start of a mini ice age. It began starting slowly around 2013, and the move is accelerating. In the immediate you can look at this winter and spring. We have had extreme snow, record low temperatures, all over the Northern Hemisphere.
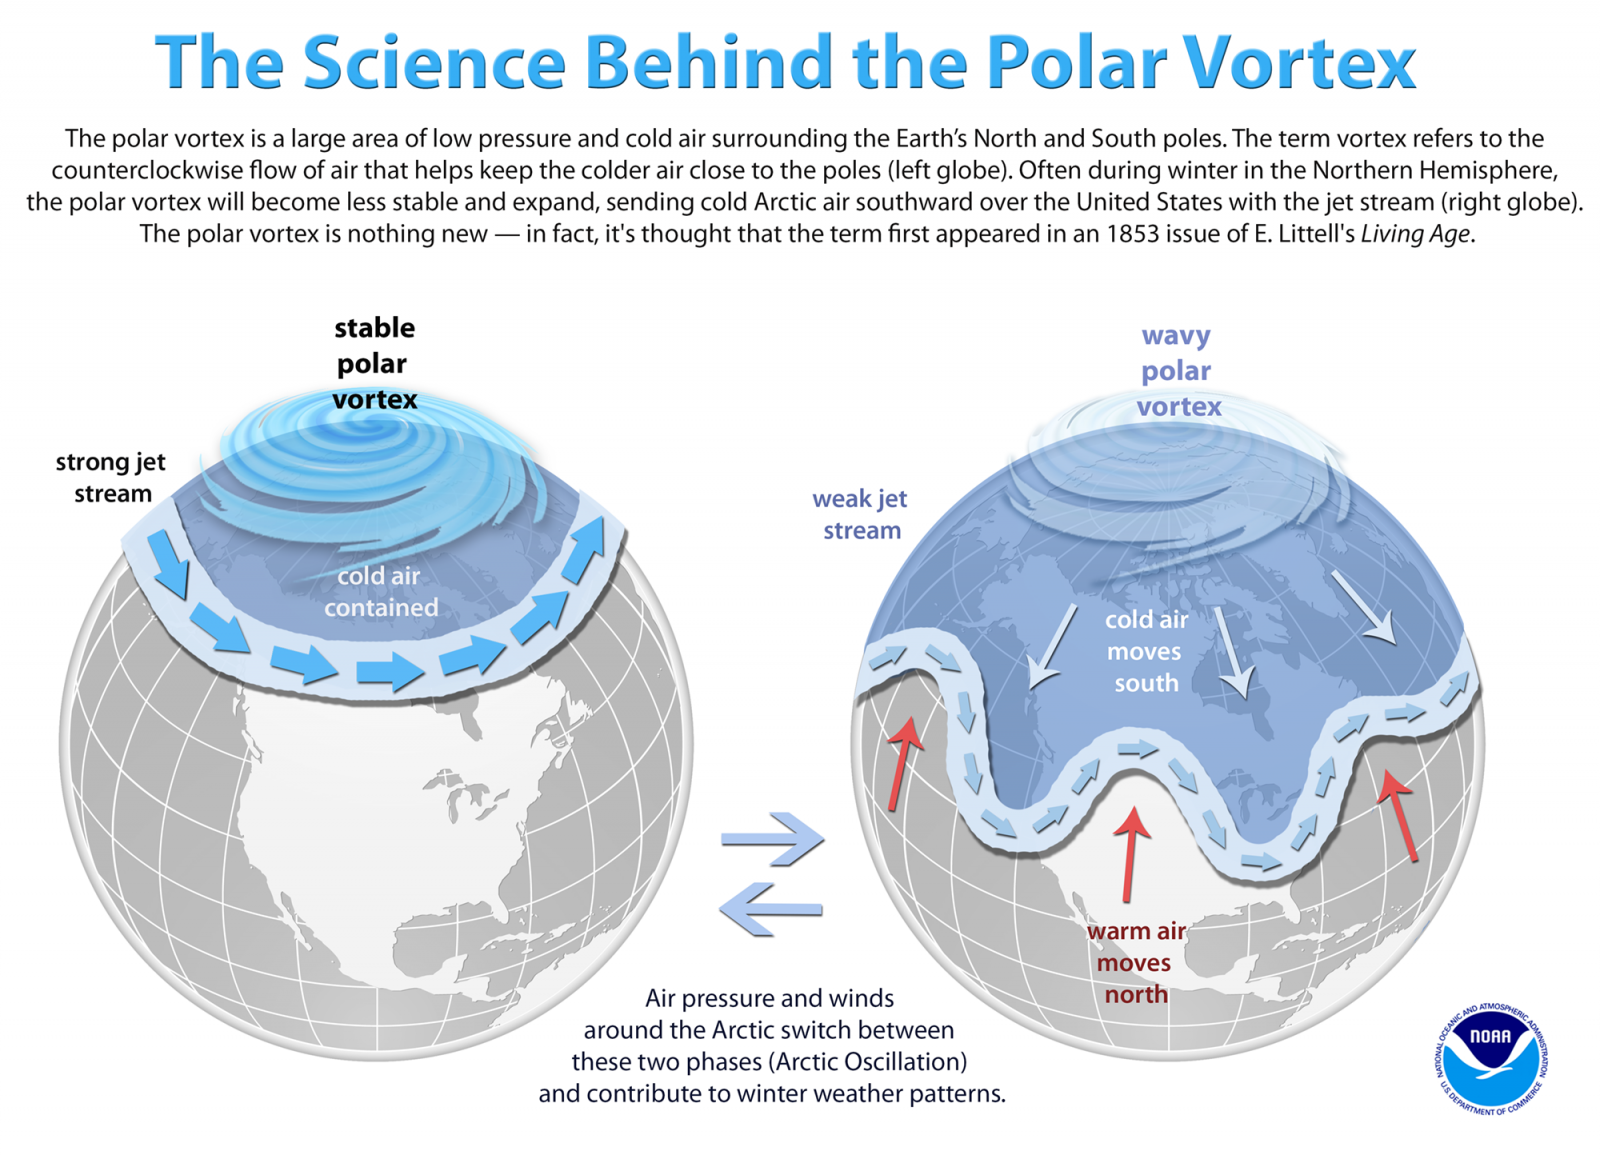
The main thing is the wild jet stream signifying onset of a mini ice age. Instead of staying in a high north zonal position associated with a warmer world, the jet stream has gotten wavy and descended into mid latitudes and lower, because of minimal solar activity.
North of the jet stream is colder air, and warmer air south of it. Under normal springtime conditions, the jet stream remains well North of the British Isles meaning warmer weather there. However presently the jet stream is both lower and extra wavy, meaning that loops bring cold arctic air over parts of NH. This behavior contradicts global warming theory, but confirms expectations of a mini ice age.
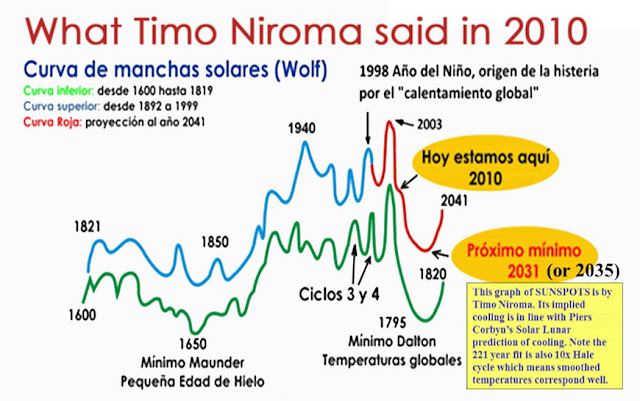
The graph compares average solar activity in the last 200 years with solar activity ten magnetic cycles previous to now. The correlation is impressive. We are at the knee of this curve, plus or minus three or four years. If the correlation holds, we are plunging into a mini ice age. So for the next two decades until about 2035 it will get cooler and cooler on average and there will more wild jet streams and weather. Growing seasons will be shorter and crop failures more frequent, resulting in economic difficulties.
The basic message is that the sun is controlling the climate, primarily by the sea. “The best thing to do now is to tell your politicians to stop believing nonsense, and to stop doing silly measures like the bird-killing machines of wind farms in order to save the planet (they say), but get rid of all those things, which cost money, and reduce electricity prices now.”
Summary
This winter and spring are inconsistent with global warming assumed to result from CO2. The wild jet stream (polar vortex) bringing these conditions does fit with solar activity fluxes. If the correlation holds, the planet will cool not warm. Governments would serve their citizens by shifting priorities from controlling emissions to ensuring robust infrastructure and reliable, affordable energy.
Last night PBS aired the most impressive presentation yet of “Official” climate doctrine. I don’t say “science” because it mounts a powerful advocacy for a particular viewpoint and entertains no alternative perspectives. The broadcast is extremely well crafted with great imagery, crisp sound bite dialogue and sincere acting.
With all the invested effort, talent and expense, it is probably the strongest yet Blue Team argument for climate alarm and against fossil fuel consumption. As such we can expect that large audiences of impressionable people of all ages will be exposed to it. It behooves anyone who stands on skeptical ground, who wants to hold that position, to study what is asserted and decide what points are acceptable and what claims are disputed.
The telecast will be repeatedly aired this month on NOVA on US PBS stations. The website apparently blocks viewing in foreign countries, but the transcript is available and I will refer to it in comments below.
Update April 20: An independent review of the documentary is added at the end.
Decoding the Weather Machine Discover how Earth’s intricate climate system is changing. Airing April 18, 2018 at 8 pm on PBS
Program Description Disastrous hurricanes. Widespread droughts and wildfires. Withering heat. Extreme rainfall. It is hard not to conclude that something’s up with the weather, and many scientists agree. It’s the result of the weather machine itself—our climate—changing, becoming hotter and more erratic. In this two-hour documentary, NOVA will cut through the confusion around climate change. Why do scientists overwhelmingly agree that our climate is changing, and that human activity is causing it? How and when will it affect us through the weather we experience? And what will it take to bend the trajectory of planetary warming toward more benign outcomes? Join scientists around the world on a quest to better understand the workings of the weather and climate machine we call Earth, and discover how we can be resilient—even thrive—in the face of enormous change.
Outline Of Themes (Excerpts in italics from the transcript with my added images and pushback)
Introduction (The video clip above) This is the essence of science …a global investigation of our climate machine.
We’re poking at the climate system with a long, sharp, carbon-tipped spear. And we cannot perfectly predict all of the consequences.
It’s a planetary crisis, but we’re clever enough to think our way out of this.
Alarming Weather and Wildfires
The rhythm of the atmosphere was off. We were seeing more freakish weather; storms were stronger and wetter. We’ve got a multitude of active large fires, and another megastorm en route.
Douglas had heard about global warming, but given all the crazy weather he’d experienced, he was skeptical. And he’s not alone. A third of Americans doubt humans are changing the climate.
But: Weather is not more extreme. And Wildfires were worse in the past. Litany of Changes
Seven of the ten hottest years on record have occurred within the last decade; wildfires are at an all-time high, while Arctic Sea ice is rapidly diminishing.
We are seeing one-in-a-thousand-year floods with astonishing frequency.
When it rains really hard, it’s harder than ever.
We’re seeing glaciers melting, sea level rising.
The length and the intensity of heatwaves has gone up dramatically.
Plants and trees are flowering earlier in the year. Birds are moving polewards.
We’re seeing more intense storms.
But: All of these are within the range of past variability.
In fact our climate is remarkably stable.
And many aspects follow quasi-60 year cycles.
Climate is Changing the Weather
Changes like these have led an overwhelming majority of climate scientists to an alarming conclusion: it isn’t just the weather that’s changing, it’s what drives the weather, Earth’s climate.
But: Actual climate zones are local and regional in scope, and they show little boundary change.
The Journey to Blaming CO2 and Humans
In 1824, Fourier was the first to deduce that it’s the composition of the atmosphere that governs the surface temperature of the earth; 1824, almost 200 years ago, and climate science has been accumulating ever since.
(Forty years later)Tyndall figured out that carbon dioxide traps heat. But even more importantly, Tyndall realized that when we dig up coal and burn it, it’s actually releasing more of these heat-trapping gases.
(In the 1950’s) This annual rise and fall of carbon dioxide is what Dave Keeling discovered. It is the breath of the world’s forests. The Keeling Curve established, without question, that the carbon dioxide content in the atmosphere was going up steeply, sharply, rapidly.
But these(Antarctic) ice cores can extend the Keeling Curve back in time and reveal that today’s concentration of carbon dioxide is unusually high. The current concentration of carbon dioxide in the atmosphere is higher than it has been for 800,000 years.
From ocean mud, emerges a record of temperature that goes back tens of millions of years. That record shows temperature swings from warm periods to ice ages triggered by changes in Earth’s orbit. But when these temperature changes are paired with the levels of carbon dioxide from ice cores, a startling correlation emerges. The two graphs are a near perfect match.
Fossil fuels have been locked up underground for millions of years. So, when we emit fossil fuels into the atmosphere, we’re emitting carbon that is very different. It has a very distinct fingerprint. This chemical fingerprint and many other lines of evidence leave no doubt that we are responsible for the skyrocketing levels of carbon dioxide.
But: Ice cores show that it was warmer in the past, not due to humans.
And CO2 relation to Temperature is Inconsistent.
Linking CO2 to Climate and Weather
Climate and weather are flip sides of the same coin. You impact climate, it’s going to impact weather. Weather is what is happening in the atmosphere at a given time and place: hot, cold, rain or snow. Climate is an average of that weather, over longer periods.
It is fundamentally these two factors, Earth’s spin and heat differences between the poles and the equator that create the weather patterns we know. So, if you trap more heat in the system, you change the weather.
We are more powerful than nature in the push we are putting on climate. And we don’t entirely understand and cannot perfectly predict all of the consequences. It’s not we’re worried because it’s never happened before, Earth’s climate has changed. What hasn’t happened before is to change it this quickly.
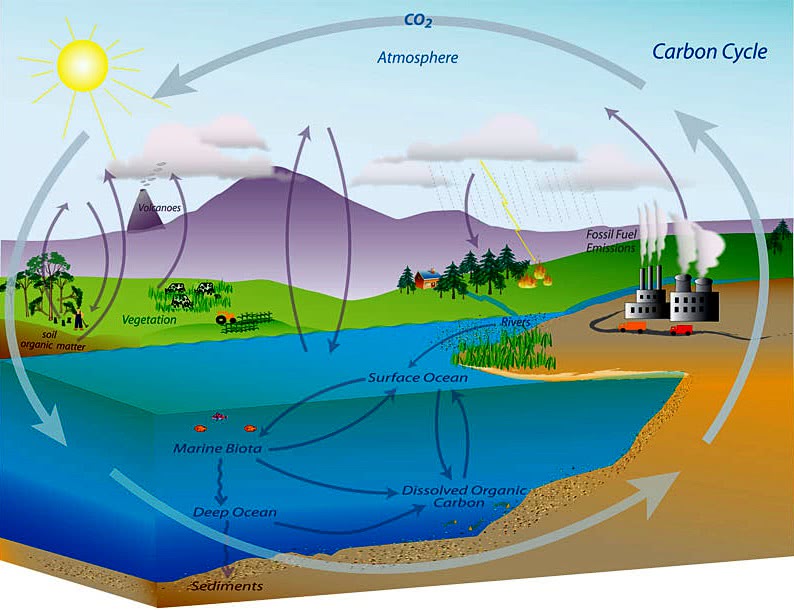
But: Human emissions are dwarfed by CO2 from estimated natural sources.
The Race to Understand the Climate Machine
Across the globe, scientists are now racing to understand and model Earth’s climate system, trying to figure out just how damaging climate change will be.
The evidence is clear that by burning fossil fuels, we humans have changed the composition of the atmosphere, which is now trapping more heat. How the other parts of the climate machine will respond will determine how much our climate will change and how much the great diversity of life that it supports will be affected.
The land, part of Earth’s climate machine, is playing an essential role, because trees are absorbing about 25 percent of the extra carbon dioxide that is heating our atmosphere. It turns out that the oceans are doing the same.
Probing the Ocean’s Mysteries
When we talk about warming of the climate system, we tend to focus on the atmosphere, but the lion’s share of the warming of our climate system is in the ocean.
Along with teams from around the world, (Stephen Riser) is building fleets of underwater drones, called “Argo floats,” to do the work. These robots are pioneering explorers, designed to probe parts of the earth never seen before.
The Southern Ocean is this gateway between the deep ocean and the atmosphere. There’s not many places in the global ocean where that deep water can contact the atmosphere. Once at the surface, the deep cold water, that scientists call “old water,” soaks up heat like a sponge.
The Argo floats reveal that over the last 30 years, the ocean has heated up by an average of a half-degree Fahrenheit. If we put all of that heat into the lower atmosphere, the atmosphere would heat up by about 20 degrees Fahrenheit, that’s how much heat we’re talking about here.
In all, a staggering 93 percent of the heat that we’re putting into our atmosphere is getting soaked up by our oceans. This comes with consequences. Heating the ocean and adding carbon dioxide are damaging to life in the sea.
But: The Argo record is short and shows a mixed picture.
Studying Ice and Sea Levels
The data from the motion trackers and other high tech devices, like this radar, are giving Holland new insights into how glaciers disappear. What he has found is surprising. For glaciers in contact with the ocean, warmer air causes some of the loss of ice, but the real trigger for intense calving is warmer water coming underneath the glacier and destabilizing it.
Locked up in the Antarctic ice sheet is a total of 200 feet of possible sea level rise. And this vast continent of ice, especially the western part, is breaking up faster than anyone thought possible.
The melting or break up of all that ice would devastate much of civilization as we know it, as sea levels rise and flood cities and coasts.
By mapping this ancient Australian reef, Andrea Dutton is able to tell how high sea levels were the last time Earth was as warm as today. Our research shows that with just the amount of warming we’ve seen today, the seas could rise much higher, up to 20 to 30 feet higher than today.
The big question is how fast? Does it take us 500 years to get there? Well that’s one thing. Or does it take us 100 years to get there. That’s three feet in a decade. That’s a lot.
But: Sea Level Rise is not accelerating.
Sea Level Rise Today
So, when will we start to feel the impact of sea level rise? Some people already are. The Marshall Islands are a nation of low-lying islands in the Pacific. They are home to 50,000 people and a vibrant culture. Today, they face becoming a new kind of refugee: a climate refugee.
Sea level rise is now a reality even in the United States. And low-lying cities, like Norfolk, Virginia, are on the front line.
But: On site observations show no alarming sea level rise.
Rising Costs and Feedbacks
For the people of Norfolk, climate change is already affecting their lives. And across all of America, the costs are mounting. 2017 was the costliest hurricane season on record. Harvey alone caused catastrophic flooding in southeastern Texas, with financial damages that rival Katrina, and Puerto Rico was devastated by Hurricane Maria.
Wildfires in the western United States have quadrupled since the 1980s, exacerbated by drought. Effects like these are being felt across the planet, and some are even accelerating the warming itself. When trees that have been helping by pulling carbon dioxide out of the atmosphere burn down, much of that carbon is pumped back into the air.
And in the Arctic, ice that has been cooling the planet by reflecting away some of the sun’s heat is melting. The loss of ice means more warming.
But: Arctic Ice has not declined since 2007.
Models Foretell the Future
Using nothing but basic physics, we can actually produce, in our computers, a virtual Earth. With this virtual Earth, scientists like Kirsten Findell work to predict where our climate is going, before it’s too late to change course.
Worldwide, there are dozens of models. They predict how each part of the climate machine will change, like sea surface temperature, storm intensity or the extent of the ice caps. Every detail is included. But the path to perfect models is still a work in progress, because Earth’s climate machine is such a complicated one.
The role that clouds play, for instance, is important, but poorly understood. And the speed at which ice sheets will break apart is another big unknown.
Computer models don’t exist in isolation. We calibrate them against what we’ve observed. We test them against the history of climate change. And we now know they’re pretty good.
But: Those models are running hot and vary greatly despite shared assumptions.
And the models only come close to observations when CO2 is left out. The Grim Outlook from Models
The models can be used to run a virtual experiment: if we continue emitting carbon dioxide on the path we are on, what do they say our world will look like in 2100?
This map shows how temperatures could change. The models predict the average temperature could be 5 to 10 degrees Fahrenheit hotter. That means in New York City, days with temperatures over 90 degrees would more than triple. And in the Arctic, which will heat up even faster, it could rise, on average, more than 15 degrees.
Their results suggest we will see more Category 4 and 5 hurricanes, and the prevalence of devastating heatwaves will be much more extreme.
The models also show that by the end of the century, it is likely the ocean will rise one-and-a-half to four feet. Without major changes, this would put parts of cities like Miami under water.
But: We have heard all this before.
What are The Options
The path ahead comes down to three basic options. We can do nothing and suffer the consequences; we can adapt as the changes unfold; or we can act now to mitigate, or limit the damage. The options are connected. The more we mitigate, the less we would need to adapt. The more we adapt and mitigate, the less we would suffer.
Adaptation is perhaps most urgent in the ocean, which, right now, is bearing the brunt of climate change by absorbing most of the heat. Billions of people depend on the sea for food or their livelihood. As temperatures rise, many species of marine life are moving to cooler waters, threatening local fisheries. And warmer water is killing off coral reefs, which support about 25 percent of all life in the sea.
Across America, cities are drawing up plans to adapt to the impacts of climate change, whether that’s too much water from rising sea levels and stronger storms, or too little water from harsher, longer droughts.
But there is a way to avoid the worst impacts of climate change in the first place. The more we mitigate, or limit, how much our climate changes, the less we will have to adapt. That will require shifting our economies away from burning fossil fuels. The good news is technology is moving so fast, there are many alternatives.
But: Fossil fuel consumption is poorly related to temperatures.
Technology Solutions
The scientific toolkit finally got big enough to crack this thing. Wind and solar are much further ahead than anybody ever thought they would be 10 years ago. They’re growing impossibly rapidly.
These turbines are 40 stories high, with rotors the size of a football field. Each can produce enough electricity to power up to 400 homes or make a lot of dishwashers. It’s time to innovate, and it’s time to change. Instead of having one plant that makes 1,000 megawatts, let’s have 100 plants and make 10 megawatts, or 1,000 plants that make one megawatt.
They’re working on endgame technologies that fully fill the gap between where we need to go and the track that we’ve been on since the beginning in the Industrial Revolution. So where do we need to go? Jet fuel made from plants; taller, more powerful wind turbines; better batteries; and the next generation solar cell.
Lisa Dyson envisions a day that our choices for solving the climate crisis are not just suffer, adapt or mitigate, but also prosper, by learning to recycle carbon dioxide into useful everyday products. If carbon capture and renewable technologies become more widespread, carbon dioxide levels will stop increasing.
But: Modern nations (G20) depend on fossil fuels for nearly 90% of their energy.
Negative Emissions
But even reaching that goal may not be enough, because we still would have record high levels, continuing to warm up our planet. We may need to find a way to pull more carbon dioxide out of the air than we emit into it, to go into what’s called “negative emissions.”
On most farms, the soil is tilled, or plowed, to reduce weeds and pests. But in the process, much of the carbon gets dug up and released back to the atmosphere. Dave decided to go another route called “no-till” farming. Every time you harvest, you leave the residue from that crop in place, so there is a protective blanket on the top of the soil. So, here we have residue left from last year’s corn crop. Corn stalks, leaves, an occasional corncob. Not tilling helped the soil become healthier.
We need to fundamentally rethink how we do agriculture, focused on soil building, soil health, putting carbon back in the ground. And if we’re able to do that, then agriculture could be a major contributor to very positive changes related to global climate.
But: The planet is greener because of rising CO2.
Summation
For over 200 years, in every corner of the globe, scientists have probed Earth’s climate machine, developing a deep understanding of how it works.
They have proven beyond reasonable doubt that climate change is happening and that burning fossil fuels is the primary cause. They have built computer models that can predict the road ahead, and they have come up with ways to adapt, or solutions to avoid the worst of the impacts. But there is one powerful piece of the climate machine so unpredictable and inconsistent that no computer model could ever guess how it will behave: us.
The scientific evidence is so clear about where we’re going, but there is an astonishing inertia. We’re not mitigating fast enough to stop the train crash. The technological solutions make it inevitable that we will solve this problem. The question is just how much damage we create before we finally reign it in.
Update April 20: This review of the documentary was posted by cerescokid at Climate Etc.
I watched the PBS show. Perfect……..for an 8 year old. Could it be more simplistic? It is warming. CO2 did it. That was the sum and substance of it.
No mention of previous warm periods or the debate about them. Not a word about questions over SLR acceleration. Nothing on previous warm periods in the Arctic. Silence on East Antarctica gaining ice or Antarctic Peninsula Cooling. Not a peep about geothermal activity in Greenland and Antarctica. Nothing about the 12 year hiatus in Cat 3 hurricanes. Nothing about trendless tornadic activity. Nothing about trendless snow levels in North America. Not any explanation why temperatures are believed to be unprecedented and not just natural variability. Why no discussion of endless stacked Oscillations. Why wasn’t the sun dismissed? Hasn’t glacier calving been happening for eons? They made a big deal of an iceberg the size of the Empire State Building. Big deal.
But there were plenty of pretty pictures and age appropriate explanations of the issues. See spot run.
It was nothing more than a propaganda piece, perfect for the marginally competent HP aficionados.
They did, however, have a nice voiceover stating that temperatures haven’t been this warm in 800,000 years while showing a graph, not of temperatures, but of spiking CO2 levels over the last 800,000 years. Nice Trick.
Over land the northern hemisphere Globsnow snow-water-equivalent SWE product and over sea the OSI-SAF sea-ice concentration product. Credit: Image courtesy of Finnish Meteorological Institute
Excerpts below include both factual and speculative content (with my bolds.)
The new Arctic Now product shows with one picture the extent of the area in the Northern Hemisphere currently covered by ice and snow. This kind of information, which shows the accurate state of the Arctic, becomes increasingly important due to climate change.
In the Northern Hemisphere the maximum seasonal snow cover occurs in March. “This year has been a year with an exceptionally large amount of snow, when examining the entire Northern Hemisphere. The variation from one year to another has been somewhat great, and especially in the most recent years the differences between winters have been very great,” says Kari Luojus, Senior Research Scientist at the Finnish Meteorological Institute.
The information has been gleaned from the Arctic Now service of the Finnish Meteorological Institute, which is unique even on a global scale. The greatest difference compared with other comparable services is that traditionally they only tell about the extent of the ice or snow situation.
“Here at the Finnish Meteorological Institute we have managed to combine data to form a single image. In this way we can get a better situational picture of the cryosphere — that is, the cold areas of the Northern Hemisphere,” Research Professor Jouni Pulliainen observes. In addition to the coverage, the picture includes the water value of the snow, which determines the water contained in the snow. This is important information for drafting hydrological forecasts on the flood situation and in monitoring the state of climate and environment in general.
Information on the amount of snow is also sent to the Global Cryosphere Watch service of the World Meteorological Organisation (WMP) where the information is combined with trends and statistics of past years. Lengthy series of observation times show that the total amount of snow in the Northern Hemisphere has declined in the spring period and that the melting of the snow has started earlier in the same period. Examination over a longer period (1980-2017) shows that the total amount of snow in all winter periods has decreased on average.
Also, the ice cover on the Arctic Ocean has grown thinner and the amount and expanse of perennial ice has decreased. Before 2000 the smallest expanse of sea ice varied between 6.2 and 7.9 million square kilometres. In the past ten years the expanse of ice has varied from 5.4 to 3.6 million square kilometres. Extreme weather phenomena — winters in which snowfall is sometimes quite heavy, and others with little snow, will increase in the future. (Speculation for sure.)
Here is the MASIE chart from yesterday, confirming extensive snow this year:


 In addition, there is no mention that GCMs projections are running about twice as hot as observations. Omitted is the fact GCMs correctly replicate tropospheric temperature observations only when CO2 warming is turned off. In the effort to proclaim scientific certainty, neither Stiglitz nor IPCC discuss the lack of warming since the 1998 El Nino, despite two additional El Ninos in 2010 and 2016.

 And Wildfires were worse in the past.
 But: Sea Level Rise is not accelerating.
 Litany of Changes