Rise and Fall of the Modern Warming Spike

image_thumb9

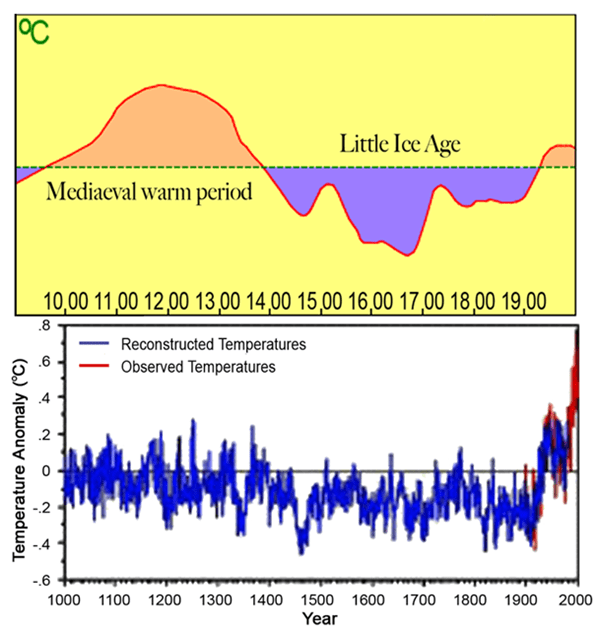
The first graph appeared in the IPCC 1990 First Assessment Report (FAR) credited to H.H.Lamb, first director of CRU-UEA. The second graph was featured in 2001 IPCC Third Assessment Report (TAR) the famous hockey stick credited to M. Mann.

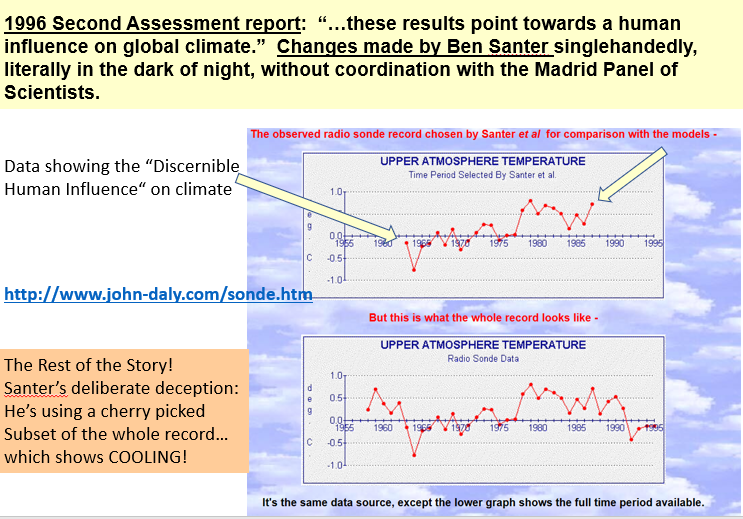
A previous post Rise and Fall of CAGW described the process that began with Hansen’s flashy Senate testimony in 1988, later supported by Santer’s flashy paper in 1996. This post traces a second iteration that ensued following Michael Mann’s production of the infamous Climate Hockey Stick graph in 1998. The image at the top comes from the 2001 IPCC TAR (Third Assessment Report) signifying the immediate embrace of this alarmist tool by consensus climatists.  The message of the graph was to assert a spike in modern warming unprecedented in the last 1000 years.  This claim of a “Modern Warming Spike” required a flat temperature profile throughout the Middle Ages (since 1000 AD).

The background to the process steps (image below) from Ross Pomeroy’s paper is provided followed by text and references for the rise and fall of the theory intended to erase Medieval Warming comparable to the present day. Sources of material are listed at the end and  included here with my bolds.

How Theories Advance and Collapse

Seeing how disarray defines psychology, it makes perfect sense that the field’s leading theories are vulnerable to collapse. Having watched this process play out a number of times, a clear pattern has emerged. Let’s call it the “Six Stages of a Failed Psychological or Sociological Theory.”

Stage 1: The Flashy Finding. An intriguing report is published with subject matter that lends itself to water cooler conversation, say, for example, that sticking a pen in your mouth to force a smile makes things seem funnier. Media outlets provide gushing coverage.

Stage 1 Modern Warming Spike Theory

fig2-20

Figure 2.20: Millennial Northern Hemisphere (NH) temperature reconstruction (blue) and instrumental data (red) from AD 1000 to 1999, adapted from Mann et al. (1999). Smoother version of NH series (black), linear trend from AD 1000 to 1850 (purple-dashed) and two standard error limits (grey shaded) are shown. Source: IPCC Third Assessment Report

Since the IPCC believes that the warming from 1975 to 1998 was mainly man-made, but not the warming in earlier centuries, it would like to be able to demonstrate that recent warming is ‘unprecedented’. But it isn’t. Temperatures in many parts of the world appear to be lower than they were in the Medieval Warm Period (MWP, c. 900-1400), and also in the earlier Roman Warm Period (c. 200 BC – 600 AD). During the MWP the Vikings tilled now-frozen farms in Greenland and were buried there in ground that is now permafrost (archaeology.org). Hundreds of peer-reviewed articles show that the MWP was a global phenomenon (Idso & Singer, 2009, 69-94; wattsupwiththat.com; co2science.org), and was not confined to parts of the northern hemisphere, as the IPCC likes to assert.

Those wanting to “get rid of” the MWP run into the problem that it shows up strongly in the data. Shortly after Deming’s article appeared, a group led by Shaopeng Huang of the University of Michigan completed a major analysis of over 6,000 borehole records from every continent around the world. Their study went back 20,000 years. The portion covering the last millennium is shown in Figure 4.

huang-pollack-boreholes-97-close-up-600

The similarity to the IPCC’s 1995 graph is obvious. The world experienced a “warm” interval in the medieval era that dwarfs 20th century changes. The present-day climate appears to be simply a recovery from the cold years of the “Little Ice Age.”

Huang and coauthors published their findings in Geophysical Research Letters 6 in 1997. The next year, Nature published the first Mann hockey stick paper, commonly called “MBH98.”7 Mann et al. followed up in 1999 with a paper in GRL (“MBH99”) extending their results from AD1400 back to AD1000.8 In early 2000 the IPCC released the first draft of the TAR. The hockey stick was the only paleoclimate reconstruction shown in the Summary, and was the only one in the whole report to be singled out for repeated presentation. The borehole data received a brief mention in Chapter 2 but the Huang et al. graph was not shown. A small graph of borehole data taken from another study and based on a smaller sample was shown, but it only showed a post-1500 segment, which, conveniently, trended upwards.

fig2-19

Figure 2.19: Reconstructed global ground temperature estimate from borehole data over the past five centuries, relative to present day. Shaded areas represent ± two standard errors about the mean history (Pollack et al., 1998). Superimposed is a smoothed (five-year running average) of the global surface air temperature instrumental record since 1860 (Jones and Briffa, 1992). Source: IPCC Third Assessment Report WG 1

Stage 2: The Fawning Replications. Other psychologists, usually in the early stages of their careers, leap to replicate the finding. Most of their studies corroborate the effect. Those that don’t are not published, perhaps because the researchers don’t want to step on any toes, or because journal editors would prefer not to publish negative findings.

Stage 2 Modern Warming Spike Theory

As the hockey stick began to appear in the scientific literature, it emerged that 1998 was the warmest year in Phil Jones’s 150-year record of thermometer data. The length of the hockey stick blade just grew. Those in charge of publicizing the work of climate scientists and making the case for man-made climate change were understandably excited. Controversial science swiftly morphed into a propaganda tool.

The World Meteorological Organization put the hockey stick on the cover of its 1999 report on climate change. Then IPCC chiefs decided to give it pride of place in their 2001 IPCC report. Moreover, based on the hockey stick, they stated that “it is likely that the 1990s was the warmest decade and 1998 the warmest year during the past thousand years”. That attracted attention — and trouble. The doubts expressed in that paper title about “uncertainties and limitations” were melting away.

wmo9131

1999 WMO statement on the Climate.

An article in the Guardian (here) describes the struggle leading to victory for the Hockey Stick.

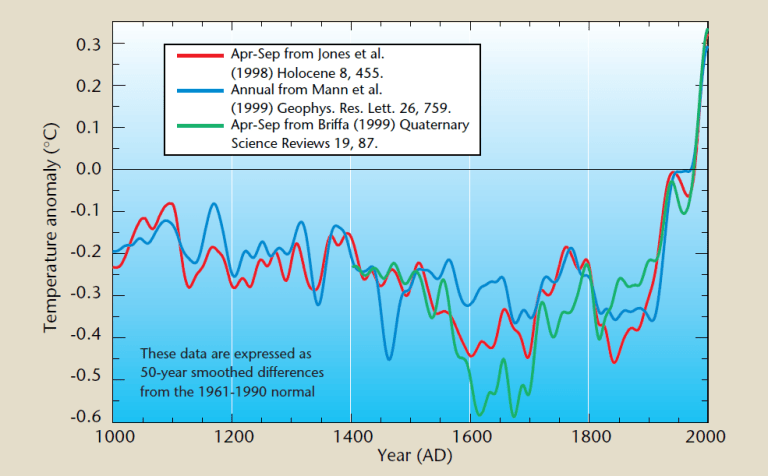
Emails exchanged in September 1999 reveal intense disagreement about whether Mann’s hockey stick should go into the IPCC summary for policymakers – the only bit of the report that usually gets read outside the scientific community – or whether other reconstructions using tree ring data alone should get priority. One of the main tree-ring constructions was by Briffa. The emails also expose major tensions between a desire for scrupulous honesty about uncertainties, and the desire for a simple story to tell the policymakers. The IPCC’s core job is to present a “consensus” on the science, but in this critical case there was no easy consensus.

The tensions were summed up in an email sent on 22 September 1999 by Met Office scientist Chris Folland, in which he alerted key researchers that a diagram of temperature change over the past thousand years “is a clear favourite for the policy makers’ summary”

But there were two competing graphs – Mann’s hockey stick and another, by Jones, Briffa and others. Mann’s graph was clearly the more compelling image of man-made climate change. The other “dilutes the message rather significantly,” said Folland. “We want the truth. Mike [Mann] thinks it lies nearer his result.” Folland noted that “this is probably the most important issue to resolve in chapter 2 at present.”

Mann, Jones and Briffa eventually settled their differences. And the hockey stick was given pride of place in the IPCC report. Folland says: “My recollection is that the final version [of the IPCC summary], which contains the hockey stick, satisfied Keith and everyone else in the end — after the usual vigorous scientific debate.” And after the three came under attack from climate sceptics, all reference to these past spats disappeared from the emails as they faced a common foe.

Stage 3: A Consensus Forms. The finding is now taken for granted, regularly appearing in pop psychology stories and books penned by writers like Malcolm Gladwell or Jonah Lehrer. Millions of people read about it and “armchair” explain it to their friends and family.

Stage 3 Modern Warming Spike Theory

In its 2001 Third Assessment Report, the IPCC used the iconic ‘hockey stick’ graph to try and show that modern warming was indeed ‘unprecedented’. The graph was produced by Michael Mann (now at Penn State University in the US), Ray Bradley and Malcolm Hughes (MBH), and published in Nature and Geophysical Research Letters in 1998 and 1999. At that time, the standard view was that the Medieval Warm Period and subsequent Little Ice Age (c. 1400-1850) were global events. But some climatologists saw the MWP as an embarrassment and spoke of the need to ‘get rid of it’. MBH’s temperature reconstruction did exactly that: it showed 900 years of gradually declining temperatures followed by a dramatic increase in the 20th century. The hockey stick played a central role in mobilizing political and public opinion in favour of drastic action to curb greenhouse gas emissions.

Al Gore with a version of the Hockey Stick graph in the 2006 movie An Inconvenient Truth

“As soon as the IPCC Report came out, the hockey stick version of climate history became canonical. Suddenly it was the “consensus” view, and for the next few years it seemed that anyone publicly questioning the result was in for a ferocious reception.” Ross McKitrick.What is the ‘Hockey Stick’ Debate About?  

Stage 4: The Rebuttal. After a few decades, a new generation of researchers look to make a splash by questioning prevailing wisdom. One team produces a more methodologically-sound study that debunks the initial finding. Media outlets blare the “counterintuitive” discovery.

Stage 4 Modern Warming Spike Theory

The hockey stick was based on historical temperature proxies (mainly tree rings), with the 20th-century instrumental temperature record tacked on the end. Incredibly, although the MBH articles were peer reviewed, nobody tried to replicate and verify the work, even though it overturned well-established views on climate history. It was only several years later that Steve McIntyre, a Canadian mathematician and retired mining consultant, began to investigate the matter. Mann did his best to obstruct him; he refused to release his computer code, saying that ‘giving them the algorithm would be giving in to the intimidation tactics that these people are engaged in’.

McIntyre, with the help of economist Ross McKitrick, went on to write several articles in 2003 and 2005, exposing the flaws in the hockey-stick reconstruction. They showed that the shape of the graph was determined mainly by suspect bristlecone/foxtail tree-ring data, and that Mann’s computer algorithm was so biased that it could produce hockey sticks even out of random noise; in short, Mann’s statistical methods ‘mined’ for hockey-stick signals in the proxy data, which were then assigned exaggerated weight in the reconstruction – thereby giving a whole new meaning to the term ‘Man(n)-made warming’!

In 2006 McIntyre & McKitrick’s criticisms were upheld by two expert committees in the US – the National Academy of Sciences (NAS) panel and a congressional panel headed by statistician Edward Wegman. Wegman pointed out that the palaeoclimate field is dominated by ‘a tightly knit group of individuals who passionately believe in their thesis’, and that ‘the work has been sufficiently politicized that they can hardly reassess their own public positions without losing credibility’.

McKitrick wrote in 2005:

Since our work has begun to appear we have enjoyed the satisfaction of knowing we are winning over the expert community, one at a time. Physicist Richard Muller of Berkeley studied our work last year and wrote an article about it:

“[The findings] hit me like a bombshell, and I suspect it is having the same effect on many others. Suddenly the hockey stick, the poster-child of the global warming community, turns out to be an artifact of poor mathematics.”

In an article in the Dutch science magazine Natuurwetenschap & Techniek, Dr. Rob van Dorland of the Dutch National Meteorological Agency commented “It is strange that the climate reconstruction of Mann passed both peer review rounds of the IPCC without anyone ever really having checked it. I think this issue will be on the agenda of the next IPCC meeting in Peking this May.”

In February 2005 the German television channel Das Erste interviewed climatologist Ulrich Cubasch, who revealed that he too had been unable to replicate the hockey stick (emphasis added):

He [Climatologist Ulrich Cubasch] discussed with his coworkers – and many of his professional colleagues – the objections, and sought to work them through… Bit by bit, it became clear also to his colleagues: the two Canadians were right. …Between 1400 and 1600, the temperature shift was considerably higher than, for example, in the previous century. With that, the core conclusion, and that also of the IPCC 2001 Report, was completely undermined.

Recently Steve MacIntyre and I received an email from Dr. Hendrik Tennekes, retired director of the Royal Meteorological Institute of the Netherlands. He wrote to convey comments he wished to be communicated publicly: “The IPCC review process is fatally flawed. The behavior of Michael Mann is a disgrace to the profession.”

Mann et al corrected

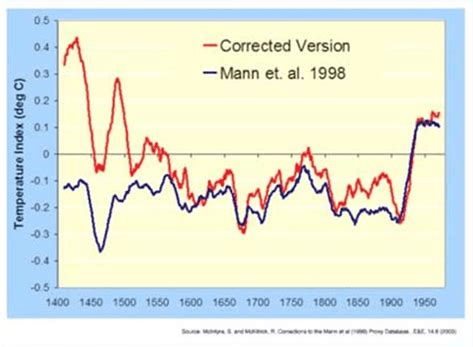
The original MBH graph compared to a corrected version produced by MacIntyre and McKitrick after undoing Mann’s errors.

Stage 5: Proper Replications Pour In. Research groups attempt to replicate the initial research with the skepticism and precise methodology that should’ve been used in the first place. As such, the vast majority fail to find any effect.

Stage 5 Modern Warming Spike Theory

The IPCC dealt with the devastating rebuttal by hiding the hockey stick within a spaghetti graph of various paleo proxies to diffuse the issue, while still claiming unprecedented modern warming.

In the IPCC’s 2007 Fourth Assessment Report, the hockey stick was included in a ‘spaghetti diagram’ alongside six other temperature reconstructions, which showed greater variability in the past but still no pronounced MWP. These ‘independent’ studies are the work of Mann’s colleagues and make use of the same flawed proxies as well as dubious statistical techniques (Montford, 2010, 266-308). The data were carefully cherry-picked to exclude tree-ring series that showed a prominent MWP (climateaudit.files.wordpress.com). Palaeoclimatologist Rosanne D’Arrigo actually told the NAS panel that cherry-picking was necessary if you wanted to make cherry pie (i.e. hockey sticks). And Jan Esper has stated: ‘The ability to pick and choose which samples to use is an advantage unique to dendroclimatology’ – a statement that would make any reputable scientist shudder (Montford, 236, 288-9).

Sixteen of the articles cited in AR4 failed to meet the IPCC’s own publication deadlines for cited references; all of them were written by IPCC contributing authors in support of the AGW cause. The most notable case is a paper by Eugene Wahl and Caspar Ammann. The authors of chapter 6 desperately needed this paper to counter McIntyre & McKitrick’s criticisms of the hockey stick, as the authors claimed to have validated Mann’s results. The leaked emails show that members of the Team pressurized Climatic Change editor Stephen Schneider to ensure that the paper was processed quickly enough to meet IPCC deadlines, though this was not entirely successful. Wahl and Ammann referred to arguments in another unpublished paper they had written, which was not even submitted until well after the first paper had gone forward for IPCC review. Jones advised the authors to be dishonest: ‘try and change the Received date! Don’t give those skeptics something to amuse themselves with’ (1189722851). Both papers finally appeared in September 2007. The authors conceded that the hockey stick failed a key test for statistical significance, but claimed it passed another test and promised to provide details in their Supplementary Information. When this was finally made available a year later, it became clear that torturous statistical manipulations were required to enable the test to be passed (Montford, 2010, 201-19, 338-42, 424-6; bishophill.squarespace.com). The shenanigans involved in the Wahl & Ammann saga are quite breathtaking.

But the credibility of the hockey stick claims was attacked repeatedly:

Stage 6: The Theory Lives On as a Zombie. Despite being debunked, the theory lingers on in published scientific studies, popular books, outdated webpages, and common “wisdom.” Adherents in academia cling on in a state of denial – their egos depend upon it.

Stage 6 Modern Warming Spike Theory

There are still hardcore alarmist blogs that defend the hockey stick graph, but IPCC itself has dropped it without explicitly disowning it.

About 1000 years ago, large parts of the world experienced a prominent warm phase which in many cases reached a similar temperature level as today or even exceeded present-day warmth. While this Medieval Warm Period (MWP) has been documented in numerous case studies from around the globe, climate models still fail to reproduce this historical warm phase. The problem is openly conceded in the most recent IPCC report from 2013 (AR5, Working Group 1) where in chapter 5.3.5. the IPCC scientists admit (pdf here):

“Continental-scale surface temperature reconstructions show, with high confidence, multi-decadal periods during the Medieval Climate Anomaly (950 to 1250) that were in some regions as warm as in the mid-20th century and in others as warm as in the late 20th century.”  pg.386

“The timing of warm and cold periods is mostly consistent across reconstructions (in some cases this is because they use similar proxy compilations) but the magnitude of the changes is clearly sensitive to the statistical method and to the target domain (land or land and sea; the full hemisphere or only the extra-tropics; Figure 5.7a). Even accounting for these uncertainties, almost all reconstructions agree that each 30-year (50-year) period from 1200 to 1899 was very likely colder in the NH than the 1983–2012 (1963–2012) instrumental temperature NH reconstructions covering part or all of the first millennium suggest that some earlier 50-year periods might have been as warm as the 1963–2012 mean instrumental temperature, but the higher temperature of the last 30 years appear to be at least likely the warmest 30-year period in all reconstructions (Table 5.4). However, the confidence in this finding is lower prior to 1200, because the evidence is less reliable and there are fewer independent lines of evidence. There are fewer proxy records, thus yielding less independence among the reconstructions while making them more susceptible to errors in individual proxy records. The published uncertainty ranges do not include all sources of error (Section 5.3.5.2), and some proxy records and uncertainty estimates do not fully represent variations on time scales as short as the 30 years considered in Table 5.4. Considering these caveats, there is medium confidence that the last 30 years were likely the warmest 30-year period of the last 1400 years.” Pg.410

Meanwhile a multitude of studies confirm that medieval warming was widespread and not limited to regions in the Northern Hemisphere, as Mann and others have claimed. For example the  MWP Mapping Project  led by Dr. Sebastian Luening, Prof. Dr. Fritz Vahrenholt (authors of ‘The neglected sun‘).

red: MWP warming
blue: MWP cooling (very rare)
yellow: MWP more arid
green: MWP more humid
grey: no trend or data ambiguous

Most of western North America and Africa were experiencing drought conditions during the MWP (except some areas in Southwest Africa). In contrast, Australia and the Carribean was more humid. Globally, 99% of all paleoclimatic temperature studies compiled in the map so far show a prominent warming during the MWP. This includes Antarctica and the Arctic.

Conclusion:

“Regarding the Hockey Stick of IPCC 2001 evidence now indicates, in my view, that an IPCC Lead Author working with a small cohort of scientists, misrepresented the temperature record of the past 1000 years by (a) promoting his own result as the best estimate, (b) neglecting studies that contradicted his, and (c) amputating another’s result so as to eliminate conflicting data and limit any serious attempt to expose the real uncertainties of these data.” – John Christy, Examining the Process concerning Climate Change Assessments,  Testimony 31 March 2011

Resources:

A BRIEF RETROSPECTIVE ON THE HOCKEY STICK Ross McKitrick 2014

Presentation to the National Academy of Sciences Expert Panel, “Surface Temperature Reconstructions for the Past 1,000-2,000 Years   Stephen Mcintyre and Ross McKitrick  2006

Climategate and the Inquiries,Ken Gregory

Climategate and the Corruption of Climate Science David Pratt

IPCC TAR and the hockey stick Judith Curry 2014

Global Warming Bombshell Richard Mueller 2004

When the IPCC ‘disappeared’ the Medieval Warm Period Frank Lansner 2010

Footnote:

Todays temperatures are cooler than the Medieval Warming Period, which was preceded by an even warmer Roman Warm Period, which followed an even warmer Minoan Warm Period.  We are in an Interglacial age about 11,500 years old, and the overall trend is cooling.

Figure 37. Holocene global temperature change reconstruction. a. Red curve, global average temperature reconstruction from Marcott et al., 2013, figure 1. The averaging method does not correct for proxy drop out which produces an artificially enhanced terminal spike, while the Monte Carlo smoothing eliminates most variability information. b. Black curve, global average temperature reconstruction from Marcott et al., 2013, using proxy published dates, and differencing average. Temperature anomaly was rescaled to match biological, glaciological, and marine sedimentary evidence, indicating the Holocene Climate Optimum was about 1.2°C warmer than LIA. c. Purple curve, Earth’s axis obliquity is shown to display a similar trend to Holocene temperatures. Source: Marcott et al., 2013.
Source:Judith Curry Nature Unbound III: Holocene climate variability (Part A)

CO2 Not Dangerous


Figure 1 depicts EPA’s endangerment chain of reasoning.

Scientists are putting forward the case against CO2 endangerment by making submissions to inform EPA’s reconsideration of that erroneous finding some years ago. As noted previously, the Supreme Court had ruled that EPA has authority to regulate CO2, but left it to the agency to study and decide the endangerment. H/T to GWPF and WUWT for providing links to the documents submitted to EPA on this topic. This post provides a synopsis with some of the key exhibits (my bolds)

The first supplement (here) addressed the first part of the scientific case, namely that fossil fuel emissions cause warming in earth’s atmosphere. The rebuttal consists of three points:

First, Research Reports failed to find that the steadily rising atmospheric CO2 concentrations have had a statistically significant impact on any of the 14 temperature data sets that were analyzed. The tropospheric and surface temperature data measurements that were analyzed were taken by many different entities using balloons, satellites, buoys and various land based techniques.

Second, new information is submitted regarding the logically invalid use of climate models in the attribution of warming to human greenhouse gas (GHG) emissions.

Third, new information is submitted relevant to the invalidation of the “Tropical Hot Spot” and the resulting implications for the three lines of evidence, a subject that was also discussed in our original Petition.

Now we have a Fifth Supplement (here) which rebuts in detail the “lines of evidence” which claim to prove man-made global warming is causing observable changes in nature.

Claim #1: Heat Waves are increasing at an alarming rate and heat kills

Summary of Rebuttal There has been no detectable long-term increase in heat waves in the United States or elsewhere in the world. Most all-time record highs here in the U.S. happened many years ago, long before mankind was using much fossil fuel. Thirty-eight states set their all-time record highs before 1960 (23 in the 1930s!). Here in the United States, the number of 100F, 95F and 90F days per year has been steadily declining since the 1930s. The Environmental Protection Agency Heat Wave Index confirms the 1930s as the hottest decade.

Claim #2: Global warming is causing more hurricanes and stronger hurricanes

Summary of RebuttalThere has been no detectable long-term trend in the number and intensity of hurricane activity globally. The activity does vary year to year and over multidecadal periods as ocean cycles including El Nino/La Nina,multidecadal cycles in the Pacific (PDO) and Atlantic (AMO) favor some basins over others.  The trend in landfalling storms in the United States has been flat to down since the 1850s. Before the active hurricane season in the United States in 2017, there had been a lull of 4324 days (almost 12 years) in major hurricane landfalls, the longest lull since the 1860s.

isaac-and-co2

[The graph above shows exhibit 2a from Truchelut and Staehling overlaid with the record of atmospheric CO2 concentrations.  From NOAA combining Mauna Loa with earlier datasets.]

To determine Integrated Storm Activity Annually over the Continental U.S. (ISAAC) from 1900 through 2017, we summed this landfall ACE spatially over the entire continental U.S. and temporally over each hour of each hurricane season. We used the same methodology to calculate integrated annual landfall ACE for five additional geographic subsets of the continental U.S.

Claim #3: Global warming is causing more and stronger tornadoes

Summary of Rebuttal Tornadoes are failing to follow “global warming” predictions. Big tornadoes have seen a decline in frequency since the 1950s. The years 2012, 2013, 2014, 2015 and 2016 all saw below average to near record low tornado counts in the U.S. since records began in 1954. 2017 to date has rebounded only to the long-term mean. This lull followed a very active and deadly strong La Nina of 2010/11, which like the strong La Nina of 1973/74 produced record setting and very deadly outbreaks of tornadoes. Population growth and expansion outside urban areas have exposed more people to the tornadoes that once roamed through open fields.

Claim #4: Global warming is increasing the magnitude and frequency of droughts and floods.

Summary of Rebuttal Our use of fossil fuels to power our civilization is not causing droughts or floods. NOAA found there is no evidence that floods and droughts are increasing because of climate change. The number, extend or severity of these events does increase dramatically for a brief period of years at some locations from time to time but then conditions return to more normal. This is simply the long-established constant variation of weather resulting from a confluence of natural factors.

us-wet-dry-co2rev-1

Claim #5: Global Warming has increased U.S. Wildfires

Summary of Rebuttal  Wildfires are in the news almost every late summer and fall. The National Interagency Fire Center has recorded the number of fires and acreage affected since 1985. This data show the number of fires trending down slightly, though the acreage burned had increased before leveling off over the last 20 years. The NWS tracks the number of days where conditions are conducive to wildfires when they issue red-flag warnings. It is little changed.

Claim #6: Global warming is causing snow to disappear

Summary of Rebuttal This is one claim that has been repeated for decades even as nature showed very much the opposite trend with unprecedented snows even to the big coastal cities. Every time they repeated the claim, it seems nature upped the ante more. Alarmists have eventually evolved to crediting warming with producing greater snowfall, because of increased moisture but the snow events in recent years have usually occurred in colder winters with high snow water equivalent ratios in frigid arctic air.

Claim #7: Global warming is resulting in rising sea levels as seen in both tide gauge and satellite technology.

Summary of Rebuttal This claim is demonstrably false. It really hinges on this statement: “Tide gauges and satellites agree with the model projections.” The models project a rapid acceleration of sea level rise over the next 30 to 70 years. However, while the models may project acceleration, the tide gauges clearly do not.  All data from tide gauges in areas where land is not rising or sinking show instead a steady linear and unchanging sea level rate of rise from 4 up to 6 inches/century, with variations due to gravitational factors.

Figure 1. Modelled and observed sea-level changes, 1840-2010. The curve marked “Models” represents the IPCC’s combination of selected tide-gauge records and corrected satellite altimetry data. The curve marked “Observations” represents the observed eustatic sea level changes in the field up to 1960 according to Mörner (1973) and (in this paper) thereafter. After 1965, the two curves start to diverge, presenting two totally different views, separated by the area with the question mark. Which of these views is tenable?

Claim #8: Arctic, Antarctic and Greenland ice loss is accelerating due to global warming

Summary of Rebuttal Satellite and surface temperature records and sea surface temperatures show that both the East Antarctic Ice Sheet and the West Antarctic Ice Sheet are cooling, not warming and glacial ice is increasing, not melting. Satellite and surface temperature measurements of the southern polar area show no warming over the past 37 years. Growth of the Antarctic ice sheets means sea level rise is not being caused by melting of polar ice and, in fact, is slightly lowering the rate of rise. Satellite Antarctic temperature records show 0.02C/decade cooling since 1979. The Southern Ocean around Antarctica has been getting sharply colder since 2006. Antarctic sea ice is increasing, reaching all-time highs. Surface temperatures at 13 stations show the Antarctic Peninsula has been sharply cooling since 2000.
Claim #9: Rising atmospheric CO2 concentrations are causing ocean acidification, which is catastrophically harming marine life

Summary of Rebuttal As the air’s CO2 content rises in response to ever-increasing anthropogenic CO2 emissions, more and more carbon dioxide is expected to dissolve into the surface waters of the world’s oceans, which dissolution is projected to cause a 0.3 to 0.7 pH unit decline in the planet’s oceanic waters by the year 2300.

The ocean chemistry aspect of the ocean acidification hypothesis is rather straightforward, but it is not as solid as it is often claimed to be. For one thing, the work of a number of respected scientists suggests that the drop in oceanic pH will not be nearly as great as the IPCC and others predict. And, as with all phenomena involving living organisms, the introduction of life into the analysis greatly complicates things. When a number of interrelated biological phenomena are considered, it becomes much more difficult, if not impossible, to draw such sweeping negative conclusions about the reaction of marine organisms to ocean acidification. Quite to the contrary, when life is considered, ocean acidification is often found to be a non-problem, or even a benefit. And in this regard, numerous scientific studies have demonstrated the robustness of multiple marine plant and animal species to ocean acidification—when they are properly performed under realistic experimental conditions.

Graph showing a typical oceanic situation. Over a 60 day period, pH fluxes are far greater than claims of global shifts toward 7 (neutral) or lower (acidity).

Claim #10: Carbon pollution is a health hazard

Summary of Rebuttal The term “carbon pollution” is a deliberate, ambiguous, disingenuous term, designed to mislead people into thinking carbon dioxide is pollution. It is used by the environmentalists to confuse the environmental impacts of CO2 emissions with the impact of the emissions of unwanted waste products of combustion. The burning of carbon-based fuels (fossil fuels – coal, oil, natural gas – and biofuels and biomass) converts the carbon in the fuels to carbon dioxide (CO2), which is an odorless invisible gas that is plant food and it is essential to life on the planet.

VOC refers to Volitile Organic Compounds, which are often components of petroleum fuels, hydraulic fluids, paint thinners, and dry cleaning agents.

The linked documents above provide more details on EPA’s “secret science”, as well as posts on this blog addressing many of these topics.

EPA Secret Science

Rise and Fall of CAGW


On January 8, 2018 Ross Pomeroy published  at RealClearScience an interesting article The Six Stages of a Failed Psychological Theory

The Pomeroy essay focuses on theories in the field of psychology and describes stages through which they rise, become accepted, challenged and discarded. It has long seemed to me that global warming/climate change theory properly belongs in the field of social studies and thus should demonstrate a similar cycle.

Formerly known as CAGW (catastrophic anthropogenic global warming), the notion of “climate change” is logically a subject of social science rather than physical science. “Climate Change” is a double abstraction: it refers to the derivative (change) in our expectations (patterns) of weather. Thus studies of “Climate Change” are properly a branch of Environmental Sociology.

As a social psychology theory, CAGW/climate change bundles together three interdependent assertions.

From the beginning the claimed science, impacts and policies were bundled, which makes CAGW theory unusual. Psychological theories do not typically give rise to activism for changes in social and political policies. Thus the six stages above focus on the rise and fall of a scientific conclusion, with little or no reference to impacts and policies. At the end of this post are links to resources regarding these latter two points.

Examples of Failed Psychology Theories: The “Backfire Effect” and others

Ross Pomeroy (my bolds):
With the publication of his exhaustingly researched and skillfully reported article, “LOL Something Matters,” science writer Daniel Engber convincingly demonstrated that the “backfire effect,” the notion that contradictory evidence only strengthens entrenched beliefs, does not hold up under rigorous scientific scrutiny. Bluntly stated, the “backfire effect” probably isn’t real.

The debunking of this longstanding psychological theory follows similar academic takedowns of ego depletion, social priming, power posing, and a plethora of other famous findings. Indeed, much of what we “know” in psychology seems to be false.

There’s a good reason for this: psychology, as a discipline, is a house made of sand, based on analyzing inherently fickle human behavior, held together with poorly-defined concepts, and explored with often scant methodological rigor. Indeed, there’s a strong case to be made that psychology is barely a science.

How Theories Advance and Collapse

Seeing how disarray defines psychology, it makes perfect sense that the field’s leading theories are vulnerable to collapse. Having watched this process play out a number of times, a clear pattern has emerged. Let’s call it the “Six Stages of a Failed Psychological or Sociological Theory.”

Stage 1: The Flashy Finding. An intriguing report is published with subject matter that lends itself to water cooler conversation, say, for example, that sticking a pen in your mouth to force a smile makes things seem funnier. Media outlets provide gushing coverage.

Stage 1 CAGW Theory

For Climate Change, by many accounts the flashy finding was James Hansen’s famous 1988 testimony in the US Senate. Hansen’s claim to detect global warming was covered by all the main television network news services and it won for him a New York Times front page headline: “Global warming has begun, expert tells Senate.”

While Hansen’s appearance was a PR coup, he actually jumped the gun.  By 1995 IPCC scientists had not yet agreed that humans are causing global warming.  The story of that problem and the subsequent claim of first detection by John Houghton and Ben Santer is described in detail in Bernie Lewin’s fine historical account. (My synopsis is linked at the end.)

So in this sense, the actual Flashy Finding was published by Santer et al. just before Rio COP in Nature July 1996 entitled: A search for human influences on the thermal structure of the atmosphere
B. D. Santer, K. E. Taylor, T. M. L. Wigley, T. C. Johns, P. D. Jones, D. J. Karoly, J. F. B. Mitchell, A. H. Oort, J. E. Penner, V. Ramaswamy, M. D. Schwarzkopf, R. J. Stouffer & S. Tett  From the abstract:

The observed spatial patterns of temperature change in the free atmosphere from 1963 to 1987 are similar to those predicted by state-of-the-art climate models incorporating various combinations of changes in carbon dioxide, anthropogenic sulphate aerosol and stratospheric ozone concentrations. The degree of pattern similarity between models and observations increases through this period. It is likely that this trend is partially due to human activities, although many uncertainties remain, particularly relating to estimates of natural variability.

An article published the same month in World Climate Report was entitled:“Clearest Evidence” For Human “Fingerprint?” Results clouded if more complete data used  The WCR essay concluded:

We are frankly rather amazed that this paper could have emerged into the refereed literature in its present state; that is not to say that the work is bad, but that there are serious questions—similar to ours—that the reviewers should have asked.

The inescapable conclusions:

1. The vast majority of the “fingerprints” of the greenhouse effect are found way up in the atmosphere, especially in the stratosphere.

2. The “detection” models that were used either don’t predict very much future warming or were run with the wrong greenhouse effect and produce absurd results when the right numbers are put in.

3.And finally, down here in the lower atmosphere, the evidence is much more smudged and is based upon a highly selected set of data that, when viewed in toto, shows something dramatically different than what the paper purports.

The period that Santer et al. studied corresponds precisely with a profound warming trend in this region. But when all of the data (1957 to 1995) are included, there’s no trend whatsoever! We don’t know what to call this, but we believe that at least one of the 13 prestigious authors on this paper must have known this to be the case.

Stage 2: The Fawning Replications. Other psychologists, usually in the early stages of their careers, leap to replicate the finding. Most of their studies corroborate the effect. Those that don’t are not published, perhaps because the researchers don’t want to step on any toes, or because journal editors would prefer not to publish negative findings.

Stage 2 CAGW Theory

Following the human detection claim, the media increasingly filled its time and pages with reports of “multiple lines of evidence” proving CAGW.  Typically these consisted of :

Global temperature rise
Warming oceans
Shrinking ice sheets
Glacial retreat
Decreased snow cover
Sea level rise
Declining Arctic sea ice
Extreme events
Ocean acidification

However, all of these are equivocal, involving signal and noise issues.  And in any case, the fact of any changes does not in itself prove human causation.

Overview of the structure of a state-of-the-art climate model. From the NOAA website.

As suggested by the Santer et al. flashy finding, the claim of human causation was based upon climate models.  And the effort to substantiate that claim was primarily a campaign to construct and experiment with GCMs.  From History of climate modeling by Paul N. Edwards .

Like ripples moving outward from the three pioneering groups (GFDL, UCLA, and NCAR), modelers, dynamical cores, model physics, numerical methods, and GCM computer code soon began to circulate around the world. By the early 1970s, a large number of institutions had established new general circulation modeling programs. In addition to those discussed above, the most active climate modeling centers today include Britain’s Hadley Centre, Germany’s Max Planck Institute, Japan’s Earth Simulator Centre, and the Goddard Institute for Space Studies in the United States..

How many GCMs and climate modeling groups exist worldwide? The exact number can be expanded or contracted under various criteria. About 33 groups submitted GCM output to the Atmospheric Model Intercomparison Project (AMIP) in the 1990s.A few years later, however, only about 25 groups contributed coupled AOGCM outputs to the Coupled Model Intercomparison Project (CMIP)—reflecting the greater complexity and larger computational requirements of coupled models.  Notably, while the AMIP models included entries from Russia, Canada, Taiwan, China, and Korea, all of the CMIP simulations came from modeling groups based in Europe, Japan, Australia, and the USA, the historical leaders in climate modeling.

The difficulties and uncertainties with climate models have been long understood, and have not been overcome  through the decades, as indicated by the failure to reduce the range estimates of climate sensitivity to CO2.  From Modeling climatic effects of anthropogenic carbon dioxide emissions: unknowns and uncertainties Willie Soon et al.

Specifically, we review common deficiencies in general circulation model (GCM) calculations of atmospheric temperature, surface temperature, precipitation and their spatial and temporal variability. These deficiencies arise from complex problems associated with parameterization of multiply interacting climate components, forcings and feedbacks, involving especially clouds and oceans. We also review examples of expected climatic impacts from anthropogenic CO2 forcing.

Given the host of uncertainties and unknowns in the difficult but important task of climate modeling, the unique attribution of observed current climate change to increased atmospheric CO2 concentration, including the relatively well-observed latest 20 yr, is not possible. We further conclude that the incautious use of GCMs to make future climate projections from incomplete or unknown forcing scenarios is antithetical to the intrinsically heuristic value of models. Such uncritical application of climate models has led to the commonly held but erroneous impression that modeling has proven or substantiated the hypothesis that CO2 added to the air has caused or will cause significant global warming.

Christy 2019 fig7

Figure 7 (Christy 2019): Tropical mid-tropospheric temperatures, models vs. observations.
Models in pink, against various observational datasets in shades of blue. Five-year averages
1979–2017. Trend lines cross zero at 1979 for all series.

Stage 3: A Consensus Forms. The finding is now taken for granted, regularly appearing in pop psychology stories and books penned by writers like Malcolm Gladwell or Jonah Lehrer. Millions of people read about it and “armchair” explain it to their friends and family.

Stage 3 CAGW Theory  

The Claims of 97% Consensus of scientists on the question of CAGW stem from five papers, conveniently referenced on NASA’s website (though none of them were written by NASA scientists).

The first claim of 97% came from a survey sample of 77 climate scientists who said “Yes” to 2 statements: “It has warmed since 1850.”; “Human activity has contributed to the warming.” That survey questionnaire was deliberately not sent to those known to be skeptical: scientists not employed by government or universities; astronomers; solar scientists; physicists; meteorologists.

Another paper noted by NASA on their website is by W. R. L. Anderegg, at the time a PhD student in the department of Biology at Stanford University. He went on to become a professor at Princeton and Utah Universities in the field of ecology and biological sciences, studying the effects of global warming on forests.

Two papers were produced by John Cook  who has an undergraduate education in physics from the University of Queensland and a post-graduate honors year studying solar physics, worked as a self-employed cartoonist before founding a website pushing climate alarmism. For this he was given the title of the Climate Communication Fellow for the Global Change Institute at the University of Queensland. He is currently completing a PhD in cognitive psychology, researching how people think about climate change.

Finally, a key paper was from Naomi Oreskes who received her PhD degree in the Graduate Special Program in Geological Research and History of Science at Stanford in 1990. Her fields are History of Science and Economic Geology, and she is a prominent activist for IPCC activities.

All five of these papers have been extensively criticized in the peer-reviewed literature for their poor quality. For example:

Regarding Anderegg et al. and climate change credibility, PNAS, Dec. 28, 2010 by Lawrence Bodenstein

The study by Anderegg et al. (1) employed suspect methodology that treated publication metrics as a surrogate for expertise.

In the climate change (CC) controversy, a priori, one expects that the much larger and more “politically correct” side would excel in certain publication metrics. They continue to cite each other’s work in an upward spiral of self-affirmation.

Here, we do not have homogeneous consensus absent a few crackpot dissenters. There is variation among the majority, and a minority, with core competency, who question some underlying premises. It would seem more profitable to critique the scientific evidence than count up scientists, publications, and the like.

Regarding purely scientific questions, it may be justified to discount nonexperts. However, here, dissenters included established climate researchers. The article undermined their expert standing and then, extrapolated expertise to the more personal credibility. Using these methods to portray certain researchers as not credible and, by implication, to be ignored is highly questionable. Tarring them as individuals by group metrics is unwarranted.

Publication of this article as an objective scientific study does a true disservice to scientific discourse. Prominent scientific journals must focus on scientific merit without sway from extracurricular forces. They must remain cautious about lending their imprimatur to works that seem more about agenda and less about science, more about promoting a certain dogma and less about using all of the evidence to better our understanding of the natural world.

A more complete list of published papers refuting these studies is here: All “97% Consensus” Studies Refuted by Peer-Review

More inclusive surveys with more pointed questions show much more diverse opinions. Most scientists agree it has warmed since 1850, the end of the Little Ice Age. Geologists have evidence that the earth was warmer than now during the Medieval Warm Period, more warm during the Roman Warm Period, warmer still in the Minoan period. So the overall trend is a cooling over the last 11,500 years.

Most agree that human land use, such as making dams, farming, building cities, airports and highways, all affect the climate in those locations. The idea that rising CO2 is causing dangerous warming is controversial, with dissenters a large minority.

Stage 4: The Rebuttal. After a few decades, a new generation of researchers look to make a splash by questioning prevailing wisdom. One team produces a more methodologically-sound study that debunks the initial finding. Media outlets blare the “counterintuitive” discovery.

Stage 4 CAGW Theory  

There have been many rebuttals of CAGW theory and in the blogosphere they are proclaimed and shared among skeptics.  But it is still rare for mass media outlets to acknowledge any finding that contradicts the prevailing “consensus” view of CAGW.  On the multiple lines of evidence, the NIPCC series of reports provide references to a trove of peer-reviewed literature that do not support CAGW.  The most recent report is Climate Change Reconsidered II and the list of scientists, authors and reviewers includes people who have objected to CAGW over the years.

An important proof against the CO2 global warming claim was included in John Christy’s testimony 29 March 2017 at the House Committee on Science, Space and Technology. The text below is from that document which can be accessed here.

Figure 5. Simplification of IPCC AR5 shown above in Fig. 4. The colored lines represent the range of results for the models and observations. The trends here represent trends at different levels of the tropical atmosphere from the surface up to 50,000 ft. The gray lines are the bounds for the range of observations, the blue for the range of IPCC model results without extra GHGs and the red for IPCC model results with extra GHGs.The key point displayed is the lack of overlap between the GHG model results (red) and the observations (gray). The nonGHG model runs (blue) overlap the observations almost completely.

Main Point: IPCC Assessment Reports show that the IPCC climate models performed best versus observations when they did not include extra GHGs and this result can be demonstrated with a statistical model as well.

More discussion on this rebuttal is at Warming from CO2 Unlikely

But the mass media is still in thrall of the catastrophic theory (bad news is good for business).

Stage 5: Proper Replications Pour In. Research groups attempt to replicate the initial research with the skepticism and precise methodology that should’ve been used in the first place. As such, the vast majority fail to find any effect.

Stage 5 CAGW Theory

In the case of climate change, the rewards are all skewed in favor of CAGW.  Not only is that bundle of beliefs politically correct, the monopoly of research funding for consensus projects leaves contrarian scientists high and dry.  And to the degree that the case rests on complex and expensive computer climate models, few centers are in a position to challenge the conventional wisdom, and almost none would be rewarded for doing so.

Despite this, every year there are hundreds of new research papers published challenging CAGW.  Kenneth Richard at No Tricks Zone has done yeoman work compiling and summarizing and linking to such studies. His most recent review is  485 Scientific Papers Published In 2017 Support A Skeptical Position On Climate Alarm

The papers are sorted into four categories of views questioning climate alarm.

N(1) Natural mechanisms play well more than a negligible role (as claimed by the IPCC) in the net changes in the climate system, which includes temperature variations, precipitation patterns, weather events, etc., and the influence of increased CO2 concentrations on climatic changes are less pronounced than currently imagined.

N(2) The warming/sea levels/glacier and sea ice retreat/hurricane and drought intensities…experienced during the modern era are neither unprecedented or remarkable, nor do they fall outside the range of natural variability, as clearly shown in the first 150 graphs (from 2017) on this list.

N(3) The computer climate models are not reliable or consistently accurate, and projections of future climate states are little more than speculation as the uncertainty and error ranges are enormous in a non-linear climate system.

N(4) Current emissions-mitigation policies, especially related to the advocacy for renewables, are often ineffective and even harmful to the environment, whereas elevated CO2 and a warmer climate provide unheralded benefits to the biosphere (i.e., a greener planet and enhanced crop yields).

As for climate models, there is a single center (the Russian Institute of Numerical Mathematics), working on GCMs that produce unalarming results.  Out of 33 CMIP5 generation models the INMCM4 appears in the earlier graph above as the only one tracking close to temperature observations.  And reports of the upgrade to INMCM5 appear promising.  For more on this topic:

Climate Model Upgraded: INMCM5 Under the Hood

Stage 6: The Theory Lives On as a Zombie. Despite being debunked, the theory lingers on in published scientific studies, popular books, outdated webpages, and common “wisdom.” Adherents in academia cling on in a state of denial – their egos depend upon it.

Stage 6 CAGW Theory 

Clearly, we are still a long ways from CAGW going to zombie status.  There is still way too much money and fame attached to climate advocacy. But it is fair to say that the position of CAGW has become more precarious.  The presence of a skeptical US President, and the withdrawal of funding and political support for alarmists makes it possible for others to express doubts and explore flaws in the consensus theory.  The collapse of green energy schemes in places like Germany and Australia may also portend the onset of stage six.

Of course, the only sure sign of a theory’s failure is when it becomes the butt of jokes and ridicule in mainstream media.  For that I do appreciate the work of cartoonist Rick McKee of the Augusta Chronicle:


More humor at Cavemen Climate Comics for Sunday

Background Articles

The Flashy Finding: Progressively Scaring the World (Lewin book synopsis)

The Fawning Replications: Climate Models Explained

A Consensus Forms: Talking ClimateNASA and Climate Dogma

The Rebuttal: Fossil Fuels ≠ Global Warming

Proper Replications: Climate Reductionism

Zombie CAGW:  Climate Policies Failure, the Movie

Postscript: Charles MacKay on Collective Delusions

Of course the classical masterwork in this field is the book Extraordinary Popular Delusions And The Madness Of Crowds By Charles MacKay 1841.  Title is link to full pdf text.  Excerpts below with my bolds.

In the present state of civilization, society has often shown itself very prone to run a career of folly from the last-mentioned cases. This infatuation has seized upon whole nations in a most extraordinary manner. France, with her Mississippi madness, set the first great example, and was very soon imitated by England with her South Sea Bubble. At an earlier period, Holland made herself still more ridiculous in the eyes of the world, by the frenzy which came over her people for the love of Tulips. Melancholy as all these delusions were in their ultimate results, their history is most amusing. A more ludicrous and yet painful spectacle, than that which Holland presented in the years 1635 and 1636, or France in 1719 and 1720, can hardly be imagined.

Some delusions, though notorious to all the world, have subsisted for ages, flourishing as widely among civilized and polished nations as among the early barbarians with whom they originated, — that of duelling, for instance, and the belief in omens and divination of the future, which seem to defy the progress of knowledge to eradicate entirely from the popular mind. Money, again, has often been a cause of the delusion of multitudes. Sober nations have all at once become desperate gamblers, and risked almost their existence upon the turn of a piece of paper. To trace the history of the most prominent of these delusions is the object of the present pages. Men, it has been well said, think in herds; it will be seen that they go mad in herds, while they only recover their senses slowly, and one by one.

MacKay’s study was exhaustive for its time, comprising three volumes;

VOL I. Considered National Delusions, including:
THE MISSISSIPPI SCHEME
THE SOUTH SEA BUBBLE
THE TULIPOMANIA.
RELICS.
MODERN PROPHECIES.
POPULAR ADMIRATION FOR GREAT THIEVES.
INFLUENCE OF POLITICS AND RELIGION ON THE HAIR AND BEARD.
DUELS AND ORDEALS
THE LOVE OF THE MARVELLOUS AND THE DISBELIEF OF THE TRUE.
POPULAR FOLLIES IN GREAT CITIES
THE O.P. MANIA.
THE THUGS, or PHANSIGARS.

VOL. II described Peculiar Follies, including:
THE CRUSADES
THE WITCH MANIA.
THE SLOW POISONERS.
HAUNTED HOUSES.

VOL. III compiled more general popular madnesses under three categories:
BOOK I: Philosophical Delusions, down through history with particular recent attention to Alchemists
BOOK II: Fortune Telling
BOOK III: The Magnetisers, a fad only subsiding when the book was written.

Climate Science: Put Up or Shut Up

That’s the theme of an article by Rowan Dean in The Courier-Mail, Australia:  Time for climate scientists to produce evidence that carbon dioxide emissions affect climate  Full text below with my bolds and images.

IT’S time for so-called climate scientists to either cough up one single, solitary shred of genuine scientific evidence that proves that the climate is being changed by mankind’s carbon dioxide emissions, or ‘fess up and admit that the whole thing is a gigantic hoax.

That’s the bottom line.

Asked at the beginning of this year for one of those “predictions for 2017”, I claimed that this would be the year the Australian public wakes up and realises they are being hoodwinked by the whole climate change/renewables scam.

I told Paul Murray’s lively late night TV show on Sky News that 2017 would be the year the climate con comes to an end. So how is my prediction going?

Well, so far this year two extraordinary books have come out, and one insightful film, that support my argument that the public is indeed waking up to the tricks of the climate change/renewables fraud.

Climate Change: The Facts 2017, a series of essays published by the Institute of Public Affairs, not only debunks the entire scare campaign about the Great Barrier Reef, but in a piece of superb investigative work Dr Jennifer Marohasy exposes the Bureau of Meteorology’s embarrassing manipulation of temperature data.

The book has sold out three print runs and gained serious attention overseas. Then came the surprise hit film Climate Hustle by sceptic Marc Morano, which was, ironically, more popular than the scaremongering Al Gore film it challenged.

And this week a new book is coming out by Australia’s Ian Plimer, one of our greatest geologists.

Called Climate Change Delusion and the Great Electricity Rip-off it’s a must-read for anyone who still believes they’re saving the planet by paying through the nose for electricity.  Because you’re not. The planet is doing just fine with or without your financial impoverishment, and whatever changes may or may not be occurring to our planet’s climate, it almost certainly has nothing to do with your gas bill.

As Plimer points out, Australia is blessed with an abundance of the cheapest and cleanest energy on the planet, yet we are paying the highest electricity prices on earth.

Put simply, that doesn’t add up. And when something smells fishy, it’s because it is.

Australian taxpayers are being ripped off by deluded luvvies (Turnbull is one of the worst) pandering to the voracious leeches of the renewables industry and their greedy investors gorging on a bloated smorgasbord of your cash which they siphon up via subsidies, targets and bills.

Yet, as Plimer points out, it’s all in vain. With rigorous scientific and geological data, Plimer provides evidence that the climate “experts” fail to provide. He shows that Earth has frequently warmed up, cooled down, and warmed up again, but this process has never had anything to do with CO2.

Indeed, the geological evidence is that Earth’s coldest periods often had far higher atmospheric CO2 levels than we do now. What’s more, the mild warming we may currently be experiencing (we are, geologically speaking, still in an Ice Age and moving slowly out of it) has always been associated in human history with increased health, wealth, fertility and prosperity.

Mankind’s most successful times have been in periods such as the Roman era or medieval warming when the Earth was warmer than it is now.

Indeed, we are currently seeing flora around the globe getting greener and more fertile as CO2 levels increase.

Meanwhile, desperately trying to reinvigorate the whole tiresome climate change alarmist nonsense, this year we got Al Gore’s latest horror flick-cum-ad for his own renewables investments An Inconvenient Sequel (what an unoriginal title).

Showing suitably terrifying footage of storms, floods and hurricanes, the film was a box-office flop that received lacklustre reviews at best. Oh, and the other day an ANU “climate scientist” made the hysterical (and unprovable) claim that Sydney and Melbourne “could” roast in 50 degree summers by the end of the century.

Global Mean Temperature from land and ocean expressed in absolute degrees F.

That’s it. And still no proof that man-made carbon dioxide emissions are warming the planet. Still no proof that a warmer planet can be avoided, or would actually be a bad thing. Still no proof that removing civilisation’s reliance on coal is even remotely feasible. Still no proof that even if we did do all the things climate fanatics want us to do and destroy our economies and lifestyles, it would make the slightest difference to global temperatures. And still no proof that we even need to.

The biggest con of all is that Australian voters are denied any political leadership courageous enough to call out this scaremongering for what it is, cancel all our subsidies, targets and the Paris Agreement, which only enrich renewables carpetbaggers, and return us to a land blessed with cheap, abundant energy.


Sorry Climate Science

h/t Scottish Skeptic for referring to this article by James Delingpole in the Sun UK

How scientists got their global warming sums wrong — and created a £1TRILLION-a-year green industry that bullied experts who dared to question the figures

The summary puts the point clearly.  The scientists who produce those doomsday reports for the Intergovernmental Panel on Climate Change finally come clean. The planet has stubbornly refused to heat up to predicted levels.  Read the whole thing.  Favorite excerpts below with my bolds.

I’VE just discovered the hardest word in science.

Not pneumonoultramicroscopicsilicovolcanoconiosis (inflammation of the lungs caused by inhalation of silica dust). Nor palmitoyloleoylphosphatidylethanolamine (a lipid bilayer found in nerve tissue).

No, the actual hardest word — which scientists use so rarely it might as well not exist — is “Sorry”.

Which is a shame because right now the scientists owe us an apology so enormous that I doubt even a bunch of two dozen roses every day for the rest of our lives is quite enough to make amends for the damage they’ve done.

Thanks to their bad advice on climate change our gas and electricity bills have rocketed.

So too have our taxes, our car bills and the cost of flying abroad, our kids have been brainwashed into becoming tofu-munching eco-zealots, our old folk have frozen to death in fuel poverty, our countryside has been blighted with ranks of space-age solar panels and bat-chomping, bird-slicing eco-crucifixes, our rubbish collection service hijacked by hectoring bullies, our cities poisoned with diesel fumes . . .

And all because a tiny bunch of ­scientists got their sums wrong and scared the world silly with a story about catastrophic man-made global warming.

This scare story, we now know, was at best an exaggeration, at worst a ­disgraceful fabrication. But while a handful of reviled and derided sceptics have been saying this for years, it’s only this week that those scientists have fessed up to their mistake.

One scientist has described the ­implications of the new Nature Geoscience report as “breathtaking”. He’s right. What it effectively does is scotch probably the most damaging ­scientific myth of our age — the notion that man-made carbon dioxide (CO2) is causing the planet to warm at such dangerous and ­unprecedented speeds that only massive government intervention can save us.

For a quarter of a century now — it all really got going in 1992 when 172 nations signed up to the Rio Earth Summit — our politicians have believed in and acted on this discredited theory.

Doomsday was predicted, but midnight passed without disaster.

In the name of saving the planet, war was declared on carbon dioxide, the benign trace gas which we exhale and which is so good for plant growth it has caused the planet to “green” by an extraordinary 14 per cent in the last 30 years.

This war on CO2 has resulted in a massive global decarbonisation industry worth around $1.5trillion (£1.11trillion) a year. Though it has made a handful of green crony capitalists very rich, it has made most of us much poorer, by forcing us to use expensive “renewables” instead of cheap, abundant fossil fuels.

So if the science behind all this ­nonsense was so dodgy, why did no one complain all these years?

Well, a few of us did. Some — such as Johnny Ball and David Bellamy — were brave TV celebrities, some — Graham Stringer, Peter Lilley, Owen Paterson, Nigel (now Lord) Lawson — were ­outspoken MPs, some were bona fide scientists. But whenever we spoke out, the response was the same — we were bullied, vilified, derided and dismissed as scientifically illiterate loons by a powerful climate alarmist establishment which brooked no dissent.

Unfortunately this alarmist establishment has many powerful media allies. The BBC has a huge roster of eco-activist reporters and science “experts” who believe in man-made global warming, and almost never gives sceptics air time.

It comes as little consolation to those of us who’ve been right all along to say: “I told you so.”

In the name of promoting the global warming myth, free speech has been curtailed, honest science corrupted and vast economic and social damage done. That ­apology is long overdue.

Footnote:

For a short course in how climate science was exploited, Richard Lindzen provides details and names in this post Climate Science Was Broken

Again Falsely Linking Smoking and Climate Science

Sarah Myhre is at it again, claiming climate science links storms to CO2 as certainly as smoking causes cancer.  Fossil fuel activists are obsessed with the smoking analogy, not least because oil companies have even deeper pockets than tobacco companies.

The analogy actually works against her on both sides.  Storms and CO2 are not correlated in the statistics, and she exaggerates the extent to which smoking results in cancer.  A previous post explains.

Original Post:  Climate Risky Business

A new theme emerging out of the IPCC Fifth Report was the emphasis on selling the risk of man-made climate change. The idea is that scientists should not advocate policy, but do have a responsibility to convince the public of the risks resulting from burning fossil fuels.

An article illustrates how this approach shapes recent public communications in support of actions on global warming/climate change.  Treading the Fine Line Between Climate Talk and Alarmism (Op-Ed)  By Sarah E. Myhre, Ph.D. | June 23, 2017.  Excerpts:

What is our role in public leadership as scientists? I would suggest a few action items: Work to reduce risk and cost for the public; steward the public’s interest in evidence; and be steady and committed to the scientific process of dissent, revision and discovery. This means communicating risk when necessary. We would never fault an oncologist for informing patients about the cancer risks that come with smoking. Why would we expect Earth scientists to be any different, when we’re just as certain?

As a public scholar with expertise in paleoclimate science, I communicate alarming, difficult information about the consequences to Earth and ocean systems that have come with past events of abrupt climate warming. As the saying goes, the past is the key to the future. 

We are living through a crisis of trust between the American public and climate scientists, and we must extend ourselves, as scientists and public servants, to rebuild transparency and trust with the public. I will start: I want the global community to mitigate the extreme risk of the warmest future climate scenarios. And, I want my kid to eat salmon and ski with his grandkids in the future. I am invested in that cooler, safer, more sustainable future — for your kids and for mine. Just don’t call me an alarmist.

This provides a teachable moment concerning the rhetorical maneuver to present climate as a risky business. The technique typically starts with a particular instance of actual risk and then makes a gross generalization so that the risk is exaggerated beyond reason.  From the article above:

Climate scientists are just as certain as oncologists are.

Herein lies the moral of this tale. The particular risk is the convincing epidemiological evidence linking lung cancer to smokers. The leap was claiming second-hand smoke puts non-smokers at risk of cancer. The statistical case was never conclusive, but the public was scared into enacting all kinds of smoke-free spaces.

Very few passive smoking/lung cancer studies are published these days compared to the glut of the 1980s and 1990s, but the handful that have appeared in recent years continue to support the null hypothesis. For all the campaigners’ talk of “overwhelming evidence”, the link between secondhand smoke and lung cancer has always been very shaky. It tends to be the smaller, case-control studies which find the associations while the larger, cohort studies do not (and, as the JNCI report notes, case-control studies “can suffer from recall bias: People who develop a disease that might be related to passive smoking are more likely to recall being exposed to passive smoking.”)

Gerard Silvestri, MD, of the Medical University of South Carolina, a member of NCI’s PDQ Screening and Prevention Editorial Board said (here):

“We’ve gotten smoking out of bars and restaurants on the basis of the fact that you and I and other nonsmokers don’t want to die,” said Silvestri. “The reality is, we probably won’t.”

To be clear, I don’t want smokers fouling my space in restaurants, and the policies are beneficial to me esthetically. But there was never any certainty about my risk of cancer, just the spoiling of clean air around me.  What was a matter of opinion and personal preference was settled politically by asserting scientific certainty of my health risk.

To draw the point finely, secondhand smoke shows how science is used by one group (anti-smoking activists) against another group (smokers) by mobilizing support for regulations on the basis of a generalized risk, raising concerns among the silent majority who otherwise were not particularly interested in the issue.

Climate as a Risky Business

Environmentalists have often employed risk exaggeration, beginning with Rachel Carson’s Silent Spring full of innuendo about DDT without any actual epidemiological proof. Currently Junk Science provides a list of EPA exaggerations about environmental pollution, for example The scientific fraud that claims air pollution is killing people

In the climate field, any flat Polynesian island is of course at risk of flooding, and thus by extension they produce images of Manhattan under water. Global risk is trumpeted, ignoring all the local particularities of land subsidence, tidal gauge records, terrain drainage features, infrastructure, precipitation patterns, etc.

Any storm, drought, flood, or unusual weather likewise presents a particular risk in the locale where it occurs. The gross exaggeration is to claim that we are increasing the risk of all these events, and by stopping burning fossil fuels we can prevent them from happening.

Sarah Myhre’s research focuses on ocean dead zones (oxygen-depleted waters), which is a real and long-studied risk. Then comes her leap into the fearful future:

The surface and deep ocean will continue to absorb heat and CO2 from the atmosphere. The heating of the ocean will increase the stratification of water (i.e. ocean mixing will be reduced, as will the strength of thermohaline circulation). Ocean heating will also drive the thermal expansion of the interior of the ocean – this is one of the primary contributors to sea level rise.

The absorption of CO2 from the atmosphere will drive changes in the chemistry of surface and deep waters – there are significant biological consequences to acidifying the global surface ocean. Basically, we are looking at the fundamental reorganization of biological communities and ecological provinces in the ocean. These physical drivers (warming, stratification, acidification) all area associated with significant biological consequences.

This is a continuation of a scare called Climate Change Is Suffocating The Oceans.  Once again climate alarmists/activists have seized upon an actual environmental issue, but misdirect the public toward their CO2 obsession, and away from practical efforts to address a real concern. Some excerpts from scientific studies serve to put things in perspective.  See Ocean Oxygen Misdirection

As a paleoclimate expert the author knows the climate and sea levels have changed many times in the past, and often shifted quickly in geological terms.

And yet the evidence shows clearly that CO2 follows as an effect of changing temperatures, not the cause.

Summary

Warmists are of the opinion that because of burning fossil fuels, our modern climate no longer compares to paleoclimates, a claim in fact that humans are overriding natural forces. But the message from the ice cores is clear: Through the ages, CO2 responds to temperatures and not the other way around.

The other message is also clear: Climates change between warm and cool, and warm has always been good for humans and the biosphere. We should concern ourselves with Adaptation, preparing for the cold times with robust infrastructure and reliable, affordable energy.

See also CO2 and Climate Change for the Ages

See also Claim: Fossil Fuels Cause Global Warming
Updated 2017  Fossil Fuels ≠ Global Warming

Footnote:

Actuaries are accountants specialized in risk statistics like morbidity and mortality, usually working in the insurance industry.

Question:  What is the difference between an Actuary and an Auditor?
Answer:  The Auditor is the one with a sense of humor.
(Old joke from days working at KPMG)

See also:  Cavemen Climate Comics

Climate Hype Running Amok

The climate hype machine has switched into overdrive with the release of a draft US climate assessment report.  Read about it with caution, as explained in recent post Impaired Climate Vision.

Meanwhile a good synopsis of wrong-headed thinking about climate is provided by John Stossel in a review of Al Gore’s science fictions (here).  (Excerpts below with my bolds)

John Stossel: Al Gore and me — Don’t believe the hype

I was surprised to discover that Al Gore’s new movie begins with words from me!

While icebergs melt dramatically, Gore plays a clip of me saying, “‘An Inconvenient Truth’ won him an Oscar, yet much of the movie is nonsense. ‘Sea levels may rise 20 feet’ — absurd.” He used this comment from one of my TV shows.

The “20 feet” claim is absurd — one of many hyped claims in his movie.

His second film, “An Inconvenient Sequel,” shows lower Manhattan underwater while Gore intones: “This is global warming!”

My goodness! Stossel doubts Al Gore’s claim, but pictures don’t lie: The 9/11 Memorial is underwater! Gore is right! Stossel is an ignorant fool!

But wait. The pictures were from Superstorm Sandy. Water is pushed ashore during storms, especially “super” storms. But average sea levels haven’t risen much.

Over the past decade, they have risen about 1 inch. But this is not because we burn fossil fuels. Sea levels were rising long before we burned anything. They’ve been rising about an inch per decade for a thousand years.

In his new movie, Gore visits Miami Beach. No storm, but streets are flooded! Proof of catastrophe!

But in a new e-book responding to Gore’s film, climate scientist Roy Spencer points out that flooding in “Miami Beach occurs during high tides called ‘king tides,’ due to the alignment of the Earth, sun and moon. For decades they have been getting worse in low-lying areas of Miami Beach where buildings were being built on reclaimed swampland.”

It’s typical Al Gore scaremongering: Pick a place that floods every year and portray it as evidence of calamity.

Spencer, a former NASA scientist who co-developed the first ways of monitoring global temperatures with satellites, is no climate change “denier.” Neither am I. Climate changes.

Man probably plays a part. But today’s warming is almost certainly not a “crisis.” It’s less of a threat than real crises like malaria, terrorism, America’s coming bankruptcy, etc. Even if increasing carbon dioxide warming the atmosphere were a serious threat, nothing Al Gore and his followers now advocate would make a difference.

“What I am opposed to is misleading people with false climate science claims and alarming them into diverting vast sums of the public’s wealth into expensive energy schemes,” writes Spencer.

Gore does exactly that. He portrays just about every dramatic weather event as proof that humans have changed weather. Watching his films, you’d think that big storms and odd weather never occurred before and that glaciers never melted.

In his first movie, Gore predicted that tornadoes and hurricanes would get worse. They haven’t. Tornado activity is down.

What about those dramatic pictures of collapsing ice shelves?

“As long as snow continues to fall on Antarctica,” writes Spencer, “glaciers and ice shelves will continue to slowly flow downhill to the sea and dramatically break off into the ocean. That is what happens naturally, just as rivers flow naturally to the ocean. It has nothing to do with human activities.”

Gore said summer sea ice in the Arctic would disappear as early as 2014. Nothing like that is close to happening.

Gore’s movie hypes solar power and electric cars but doesn’t mention that taxpayers are forced to subsidize them. Despite the subsidies, electric cars still make up less than 1 percent of the market.

If electric cars do become more popular, Spencer asks, “Where will all of the extra electricity come from? The Brits are already rebelling against existing wind farms.”

I bet most Gore fans have no idea that most American electricity comes from natural gas (33 percent), coal (30 percent) and nuclear reactors (20 percent).

Gore probably doesn’t know that.

I’d like to ask him, but he won’t talk to me. He won’t debate anyone.

Critics liked “An Inconvenient Sequel.” An NPR reviewer called it “a hugely effective lecture.” But viewers were less enthusiastic. On Rotten Tomatoes, my favorite movie guide, they give “Sequel” a “tipped over popcorn bucket” score of 48 percent. Sample reviews: “Dull as can be.” “Faulty info, conflated and exaggerated.”

Clearly, Nobel Prize judges and media critics are bigger fans of big government and scaremongering than the rest of us.

Summary:  Al Gore is Jumping the Shark

“Jumping the shark” is attempting to draw attention to or create publicity for something that is perceived as not warranting the attention, especially something that is believed to be past its peak in quality or relevance. The phrase originated with the TV series “Happy Days” when an episode had Fonzie doing a water ski jump over a shark. The stunt was intended to perk up the ratings, but it marked the show’s low point ahead of its demise.

Global Warming Fails to Convince

I happened to read an article at Real Clear Science An Inconvenient Truth About ‘An Inconvenient Truth’ by Eric Merkley & Dominik Stecula August 18, 2017. The article itself is of middling interest, mainly being a lament that Al Gore became the leading promoter of public awareness about the dangers of global warming. The authors contend that Republicans were predetermined to reject claims from such a high-profile liberal Democrat.

It is not new nor interesting to hear warmists diss skeptics as simplistic right-wingers having a knee jerk reaction to global warming claims. But reading the comment thread was illuminating and undercut the presumptions of the article. Instead of pointing to all the leftist knee jerkers swearing allegiance to climatism, posts by several scientists made comments hitting the credibility problem at its core.

Two comments reprinted below deserve a wide audience for expressing what many think but have not expressed so clearly.

@Gabe Kesseru

I spent an entire career in applied sciences and know the difference between true science and lesser areas of study. Climatology is one of the latter. It is mostly a field of historical trend analysis trying desperately to be a field of trend prediction (and doing very poorly at that).

Climatologists have done themselves a disservice by calling themselves scientists, since by doing so we expect them to use the scientific method. The use of scientific method will always be impossible in climatology, since the most important step in the SM is experimentation to prove the hypothesis. And experimentation is impossible when we can’t perform a laboratory equivalent of the earth’s climate over centuries in a laboratory experiment.

Secondarily, science requires that we gather data to laboratory accuracy levels which again is impossible with haphazard worldwide thermometer measurements originally meant to measure weather at casual levels of accuracy and casual levels of repeatability.

@Dan Ashley · Northcentral University

Dan Ashley here. PhD statistics, PhD Business.

I am not a climate, environment, geology, weather, or physics expert. However, I am an expert on statistics. So, I recognize bad statistical analysis when I see it. There are quite a few problems with the use of statistics within the global warming debate. The use of Gaussian statistics is the first error. In his first movie Gore used a linear regression of CO2 and temperature. If he had done the same regression using the number of zoos in the world, or the worldwide use of atomic energy, or sunspots, he would have the same result. A linear regression by itself proves nothing.

The theory that CO2 is a greenhouse gas has been proven correct in a small greenhouse only. As a matter of fact, plants like higher CO2 and it is frequently pumped into greenhouses because of that. There has never been a definitive experiment regarding CO2, at or near the concentrations in our atmosphere. This theory actually has much less statistical support than the conspiracy theories regarding JFK’s assassination.

Gaussian statistics REQUIRE the events being published to be both independent and random. The temperatures experienced in one part of the world are dependent on temperatures in other locales. The readings are not independent. A better statistical method would be Mandlebroten (fractal). Mandlebroten statistics are not merely “fat tailed” statistics.

A more problematic issue with the data is that it has been adjusted. Data adjustments are frequently needed –for example, if a measuring device fails. However 100% of the data adjustments used are in favor of proving global warming. 100%. Not 100% minus one adjustment. Not nearly 100%. 100% –that is ALL– of the adjustments were in one direction only. Any student that put data like that in a PHD dissertation would never receive a doctoral degree.

One study published showed parts of the Earth where warming was occuring faster than other parts of the globe. The study claimed to be of data solely from satellites. The study identified several areas (Gambia for one) which have greater warming than other areas. Unfortunately, in three of those areas there have been no climate satellite observations for years.

The statements that claim “less arctic ice in recorded history” are equally spurious. We started gathering data on that in 1957 with the first satellite fly overs. On this issue “recorded history” is a very short time period.

Some geologist friends told me that a significant amount of Earth’s heat comes from the hot Earth’s core. They further stated that they do not know what percentage of heat that is. They do know it is probably over 20% and probably less than 70%. Whereas either of those extremes seems unlikely to me, remember that I am not a geologist.

As to rising oceans, that should be measured accurately. Measuring it with a stick stuck in the sand is inappropriate. Geologists tell me that the land is shifting and moving. Measuring it against the gravitational center of the Earth is the only accurate way. However, we do not know how to do that. As a matter of fact, we don’t know precisely where the gravitational center of the Earth is. (Any physicists around that want to explain the two body and the three body problem as it relates to the Earth, Moon, and Sun, please do so.

So, according to climate scientists the world is warming up. They may be correct, they may be incorrect. However, they have been unable to support their thesis via the use of statistics.

I personally see no reason to disassemble the world’s economic systems over an unproven, and somewhat implausible theory.

Summary

The scientific claims made in Gore’s movies do not stand up to scrutiny.  Changing the salesman is not going to make the pitch any more believable.

See also

Reasoning About Climate

Big Al’s Sequel Flawed at its Core

Big Al’s Sequel: Flawed at its Core


maxresdefault
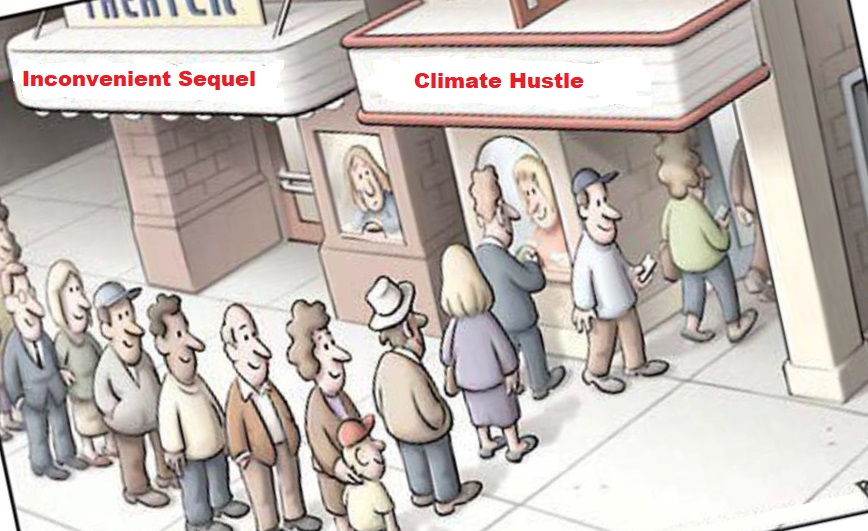
Fortunately, box offices show few other than die-hard Gore fans are subjecting themselves to the Inconvenient Sequel. When people go to see cli-sci-fi (Climate Science Fiction) movies like Water World or Day After Tomorrow, they know in advance it will be someone’s imaginary portrayal of an undesirable future. The difference with Al Gore, and also with the writers of the draft US Climate Assessment is their claim that their imaginings are “the Truth.”

Despite the low box office numbers, the media will inundate us with flawed messages from the film, so this post is required for protection around the office water cooler or the kitchen table. Text below in italics are excerpts from Alex Epstein’s article in the Financial Post Al Gore can’t deny that his climate crusade involves great suffering  Alex Epstein: Gore has to make the case that climate dangers warrant so much human misery

Good Reasons to reject Al Gore’s alarms.

The running theme throughout An Inconvenient Sequel is that Gore’s first film was even more right than he expected. The movie begins with defenders of fossil fuels mocking or ignoring the dramatic predictions of An Inconvenient Truth. Leaving aside a heroic (and highly disputed) portrayal of Gore rescuing the Paris climate accord, the rest of the movie focuses on vindicating Gore’s two chief predictions: 1) That we could replace fossil fuels with cheap solar- and wind-powered “renewables”; and 2) that continued use of fossil fuels would lead to catastrophic temperature rises, catastrophic sea-level rises, catastrophic flooding, catastrophic drought, catastrophic storms, and catastrophic disease proliferation.

Let’s deal first with Gore’s second supposition.

Alarmists Substitute Models for Observations and Data

Since the last IPCC report (AR5), activists no longer respect what consensus scientists say. Observations and data are set aside, and only alarming projections from models count. As we know, computer simulations of the climate system are flawed, and running hotter than even adjusted global datasets. And we also know, since model outputs can only project modeler’s assumptions into the future, the models cannot prove the validity of those assumptions.

Berkeley physicist Richard Muller gives a mainstream scientist view of Gore’s claims.

“The problem is not with the survey, which asked a very general question. The problem is that many writers (and scientists!) look at that number and mis-characterize it. The 97% number is typically interpreted to mean that 97% accept the conclusions presented in An Inconvenient Truth by former Vice President Al Gore. That’s certainly not true; even many scientists who are deeply concerned by the small global warming (such as me) reject over 70% of the claims made by Mr. Gore in that movie (as did a judge in the UK; see footnote below).”

“I like to ask scientists who “believe” in global warming what they think of the data. Do they believe hurricanes are increasing? Almost never do I get the answer “Yes, I looked at that, and they are.” Of course they don’t say that, because if they did I would show them the actual data! Do they say, “I’ve looked at the temperature record, and I agree that the variability is going up”? No. Sometimes they will say, “There was a paper by Jim Hansen that showed the variability was increasing.” To which I reply, “I’ve written to Jim Hansen about that paper, and he agrees with me that it shows no such thing. He even expressed surprise that his paper has been so misinterpreted.”

“A really good question would be: “Have you studied climate change enough that you would put your scientific credentials on the line that most of what is said in An Inconvenient Truth is based on accurate scientific results? My guess is that a large majority of the climate scientists would answer no to that question, and the true percentage of scientists who support the statement I made in the opening paragraph of this comment, that true percentage would be under 30%. That is an unscientific guestimate, based on my experience in asking many scientists about the claims of Al Gore.”  Full text at Meet Richard Muller, Lukewarmist

Our Actual Climate is Mild and Not Dangerous

Nothing out of the ordinary is happening to our weather and climate, despite lots of claims otherwise. Gore’s sequel is long on anecdotes and fears, but lacks any references to the statistics contradicting him. Recent decades have been remarkably benign and agriculture is booming. IPCC scientists wrote that no evidence yet exists to connect extreme weather with human activities.  Alex Epstein:

Gore and others should be free to make the case that the danger of greenhouse gases is so serious as to warrant that scale of human misery. But they should have to quantify and justify the magnitude of climate danger. And that brings us to the truth about climate.

The overall trend in climate danger is that it is at an all-time low. The Emergency Events Database (EM-DAT) shows 6,114 climate-related deaths in 2016. In other recent years the numbers have maxed out in the tens of thousands. Compare this to the 1930s when, adjusted for population, climate-related deaths hit the 10-million mark several times.

The most significant cause of our radically reduced climate danger is industrial development, which takes a naturally dangerous climate and makes it unnaturally safe. And industrial development is driven by cheap, plentiful, reliable energy — which, today, overwhelmingly means fossil fuels. Climate will always be dangerous so priority number one is to have the energy and development to tame it. Modern irrigation, residential heating and air conditioning have made once uninhabitable places perfectly comfortable.

Controlling Human CO2 Emissions Will Not Change the Weather

The really inconvenient truth is that governments are not able to ensure favorable weather for humans. Nothing yet attempted, from corrupt carbon markets, to biofuels, to renewable electrical power, to carbon taxes has done anything beyond enriching cronies and filling government coffers.

Alex Epstein details Gore’s misdirecting us to renewables as our salvation.

Some of his anecdotes are meant to prove that cheap solar and wind are, as 2006 Gore prophesied, quickly dominating the world’s energy supply and, as 2006 Gore also warned us, that our rapidly warming climate is killing more and more people each year. But he has not given us the whole picture.

Take the rising dominance of solar and wind, which is used to paint supporters of fossil fuels as troglodytes, fools, and shills for Big Oil. The combined share of world energy consumption from renewables is all of two per cent. And it’s an expensive, unreliable, and therefore difficult-to-scale two per cent.

Because solar and wind are “unreliables,” they need to be backed up by reliable sources of power, usually fossil fuels, or sometimes non-carbon sources including nuclear and large-scale hydro power (all of which Gore and other environmentalists refuse to support). This is why every grid that incorporates significant solar and wind has more expensive electricity. Germans, on the hook for Chancellor Angela Merkel’s self-righteous anti-carbon commitments, are already paying three times the rates for electricity that Americans do.

Stories about “100-per-cent renewable” locations like Georgetown, Tex. are not just anecdotal evidence, they are lies. The Texas grid from which Georgetown draws its electricity is comprised of 43.7 per cent natural gas, 28.8 per cent coal, 12 per cent nuclear, and only 15.6 per cent renewable. Using a virtue-signalling gimmick pioneered by Apple, Facebook, and Google, Georgetown pays its state utility to label its grid electricity “renewable” — even though it draws its power from that fossil-fuel heavy Texas grid — while tarring others on the grid as “non-renewable.”

If we look at the overall trends instead of engaging in anecdotal manipulation we see that fossil fuel energy is the fastest-growing energy source in the world — still. Fossil fuels have never been more vital to human flourishing. There are 1,600 coal plants planned for the near future, which could increase international coal capacity 43 per cent. Advances in technology are making fossil fuels cleaner, safer, and more efficient than ever. To reduce their growth let alone to radically restrict their use — which is what Gore advocates — means forcing energy poverty on billions of people.

Conclusion

Gore’s Inconvenient Sequel gives a biased, self-serving, and convenient picture of fossil fuels and climate — convenient for Gore’s legacy, that is, but inconvenient for the billions his energy poverty policies will harm. As citizens, we must start demanding responsible thought leaders who will give us the whole picture that life-and-death energy and climate decisions require.

Note the contrast between Al Gore’s propaganda and Richard Lindzen’s short video:

Footnote:

Errors in “An Inconvenient Truth” Highlighted by UK High Court Judge Michael Burton:

1.) The sea level will rise up to 20 feet because of the melting of either West Antarctica or Greenland in the near future. (This “Armageddon scenario” would only take place over thousands of years, the judge wrote.)

2.) Some low-lying Pacific islands have been so inundated with water that their citizens have all had to evacuate to New Zealand. (“There is no evidence of any such evacuation having yet happened.”)

3.) Global warming will shut down the “ocean conveyor,” by which the Gulf Stream moves across the North Atlantic to Western Europe. (According to the Intergovernmental Panel on Climate Change, “it is very unlikely that the Ocean Conveyor will shut down in the future…”)

4.) There is a direct coincidence between the rise in carbon dioxide in the atmosphere and the rise in temperature over the last 650,000 years. (“Although there is general scientific agreement that there is a connection, the two graphs do not establish what Mr. Gore asserts.”)

5.) The disappearance of the snows on Mount Kilimanjaro is expressly attributable to global warming. (“However, it is common ground that, the scientific consensus is that it cannot be established that the recession of snows on Mount. Kilimanjaro is mainly attributable to human-induced climate change.”)

6.) The drying up of Lake Chad is a prime example of a catastrophic result of global warming. (“It is generally accepted that the evidence remains insufficient to establish such an attribution” and may be more likely the effect of population increase, overgrazing and regional climate variability.)

7.) Hurricane Katrina and the consequent devastation in New Orleans is because of global warming. (“It is common ground that there is insufficient evidence to show that.”)

8.) Polar bears are drowning because they have to swim long distances to find ice. (“The only scientific study that either side before me can find is one, which indicates that four polar bears have recently been found drowned because of a storm.”)

9.) Coral reefs all over the world are bleaching because of global warming and other factors. (“Separating the impacts of stresses due to climate change from other stresses, such as overfishing and pollution, was difficult.”)


Decoding Climate News


Definition of “Fake News”: When reporters state their own opinions instead of bearing witness to observed events.

Journalism professor David Blackall provides a professional context for investigative reporting I’ve been doing on this blog, along with other bloggers interested in science and climate change/global warming. His peer reviewed paper is Environmental Reporting in a Post Truth World. The excerpts below show his advice is good not only for journalists but for readers.  h/t GWPF, Pierre Gosselin

Overview: The Grand Transnational Narrative

The dominance of a ‘grand transnational narrative’ in environmental discourse (Mittal, 2012) over other human impacts, like deforestation, is problematic and is partly due to the complexities and overspecialization of climate modelling. A strategy for learning, therefore, is to instead focus on the news media: it is easily researched and it tends to act ‘as one driving force’, providing citizens with ‘piecemeal information’, making it impossible to arrive at an informed position about science, society and politics (Marisa Dispensa et al., 2003). After locating problematic news narratives, Google Scholar can then be employed to locate recent scientific papers that examine, verify or refute news media discourse.

The science publication Nature Climate Change this year, published a study demonstrating Earth this century warmed substantially less than computer-generated climate models predict.

Unfortunately for public knowledge, such findings don’t appear in the news. Sea levels too have not been obeying the ‘grand transnational narrative’ of catastrophic global warming. Sea levels around Australia 2011–2012 were measured with the most significant drops in sea levels since measurements began. . .The 2015–2016 El-Niño, a natural phenomenon, drove sea levels around Indonesia to low levels such that coral reefs were bleaching. The echo chamber of news repeatedly fails to report such phenomena and yet many studies continue to contradict mainstream news discourse.

facebook2bnew2blike2bbuttons2bfinal-970-80I will be arguing that a number of narratives need correction, and while I accept that the views I am about to express are not universally held, I believe that the scientific evidence does support them.

The Global Warming/Climate Change Narrative

The primary narrative in need of correction is that global warming alone (Lewis, 2016), which induces climate change (climate disruption), is due to the increase in global surface temperatures caused by atmospheric greenhouse gases. Instead, there are many factors arising from human land use (Pielke et al., 2016), which it could be argued are responsible for climate change, and some of these practices can be mitigated through direct public action.

Global warming is calculated by measuring average surface temperatures over time. While it is easy to argue that temperatures are increasing, it cannot be argued, as some models contend, that the increases are uniform throughout the global surface and atmosphere. Climate science is further problematized by its own scientists, in that computer modelling, as one component of this multi-faceted science, is privileged over other disciplines, like geology.

Scientific uncertainty arises from ‘simulations’ of climate because computer models are failing to match the actual climate. This means that computer models are unreliable in making predictions.

Published in the eminent journal Nature (Ma, et. al., 2017), ‘Theory of chaotic orbital variations confirmed by Cretaceous geological evidence’, provides excellent stimulus material for student news writing. The paper discusses the severe wobbles in planetary orbits, and these affect climate. The wobbles are reflected in geological records and show that the theoretical climate models are not rigorously confirmed by these radioisotopically calibrated and anchored geological data sets. Yet popular discourse presents Earth as harmonious: temperatures, sea levels and orbital patterns all naturally balanced until global warming affects them, a mythical construct. Instead, the reality is natural variability, the interactions of which are yet to be measured or discovered (Berger, 2013).

In such a (media) climate, it is difficult for the assertion to be made that there might be other sources, than a nontoxic greenhouse gas called carbon dioxide (CO2), that could be responsible for ‘climate disruption’. A healthy scientific process would allow such a proposition. Contrary to warming theory, CO2 levels have increased, but global average temperatures remain steady. The global average temperature increased from 1983 to 1998; then, it flat-lined for nearly 20 years. James Hansen’s Hockey Stick graph, with soaring and catastrophic temperatures, simply did not materialize.

As Keenan et al. (2016) found through using global carbon budget estimates, ground, atmospheric and satellite observations, and multiple global vegetation models that there is also now a pause in the growth rate of atmospheric CO2. They attribute this to increases in terrestrial sinks over the last decade, where forests consume the rising atmospheric CO2 and rapidly grow—the net effect being a slowing in the rate of warming from global respiration.

Contrary to public understanding, higher temperatures in cities are due to a phenomenon known as the ‘urban heat effect’ (Taha, 1997; Yuan & Bauer, 2007). Engines, air conditioners, heaters and heat absorbing surfaces like bitumen radiate heat energy in urban areas, but this is not due to the greenhouse effect. Problematic too are data sets like ocean heat temperatures, sea-ice thickness and glaciers: all of which are varied, some have not been measured or there are insignificant measurement time spans for the data to be reliable.

Contrary to news media reports, some glaciers throughout the world (Norway [Chinn et al., 2005] and New Zealand [Purdie et al., 2008]) are growing, while others shrink (Paul et al., 2007).

Conclusion

This is clearly a contentious topic. There are many agendas at play, with careers at stake. My view represents one side of the debate: it is one I strongly believe in, and is, I contend, supported by the science around deforestation, on the ground, rather than focusing almost entirely on atmosphere. However, as a journalism educator, I also recognize that my view, along with others, must be open to challenge, both within the scientific community and in the court of public opinion.

As a journalism educator, it is my responsibility to provide my students with the research skills they need to question—and test—the arguments put forward by the key players in any debate. Given the complexity of the climate warming debate, and the contested nature of the science that underpins both sides, this will provide challenges well into the future. It is a challenge our students should relish, particularly in an era when they are constantly being bombarded with ‘fake news’ and so-called ‘alternative facts’.

To do so, they need to understand the science. If they don’t, they need to at least understand the key players in the debate and what is motivating them. They need to be prepared to question these people and to look beyond their arguments to the agendas that may be driving them. If they don’t, we must be reconciled to a future in which ‘fake news’ becomes the norm.

Examples of my investigative reports are in Data Vs. Models posts listed at Climate Whack-a-Mole

See also Yellow Climate Journalism