Michelle Dispels CO2 Hysteria


Thanks to a post at Friends of Science, I was alerted to an important declaration by Michelle. On March 17, 2017, Michelle Stirling presented “The Myth of the 97% Consensus” to the FreedomTalk.ca Annual Conference in Calgary, Alberta.

Because it’s not Michelle Obama speaking out, no one knows about it and few even care. Which tells you all you need to know about global warming/climate change.  It’s a social phenomenon, now completely detached from reason and science. It is not what you know, it’s how many friends know you that gives you impact regarding the climate. Celebrity and popularity are convincing, detailed facts and knowledge not so much.

At the end of this post is a synopsis and link showing how thoroughly Stirling debunks the “97% consensus”. Much of that will be familiar to readers, so the excerpts here will emphasize the way Michelle puts the whole climatism movement into socio-economic context.

Why Claim 97%? – Ultimate Social Proof

One feature that stands out in most of the claimed consensus studies, no matter how small the relevant sample, is the repeated figure of 97%. Many of the 97% consensus studies are co-authored or supported by social psychologists

The groundbreaking work of Cialdini (2007) demonstrated that humans are significantly motivated to comply according to ‘social proof’ – in other words, “if everyone agrees, that is proof enough so get on the bandwagon.” Just as social media ‘trending’ leads to more people following the story, social proofs work on the inherently gregarious nature of humans and our herd mentality. The 97% figure delivers two powerful psychological messages in one – i) ‘everyone’ agrees, and ii) you will be left out.

To compound the psychological impact upon the dissenting 3% of the population, climate bullying terms like ‘denier,’ and more recently various high-profile ‘witch hunts,’ even at the Presidential level, have been employed by activists. These actions activate physical and emotional pain centers in the victims, as found by Williams (2001), Kross et al (2011) on ostracism, making most people reluctant to speak up with any questions regarding the science, policy, cost or impact on industry. In practical terms, many dissidents have lost their jobs for daring to challenge ‘the consensus.’ Williams (2007) found that being ostracized was the ‘kiss of social death.’

A more nuanced study with clear definitions done by PBL Netherlands Environmental Assessment Agency reveals that out of 1,868 respondents, only 43% agreed with the IPCC definition: “It is extremely likely {95%+ certainty} that more than half of [global warming] from 1951 to 2010 was caused by [human activity].”

Clearly, van der Linden et al (2015), Ding et al (2011) Dunlap & McCright (2011) are correct in stating that consensus is an important tool and a gateway belief for acceptance of public policy on climate change. However, the question is, should we be making policy based on statistically manipulated consensus studies that lack clearly defined empirical parameters, or should public policy be based on actual scientific evidence?

The Cost of Delusion

Despite several surveys claiming that ‘consensus’ is a valuable driver of public acceptance of climate change, and expressions of dismay that a large percent of the public continue to reject the alleged ‘consensus’ and to question human-caused climate change claims in general, the foregoing demonstrates that ‘belief’ and ‘consensus’ are not grounds for action on climate change. If anything, such thinking is more likely to lead to extraordinary mass delusions, such as the Mississippi Scheme, the South-Sea Bubble, and Tulipomania, all three of which nearly bankrupted national economies of France, England and the Netherlands, respectively (Mackay 2008).

There has been a concerted effort to push the climate catastrophe perspective by well-funded foundations, philanthropies and institutional investors which are bound by the UN Principles for Responsible Investment to invest in renewables and clean-tech, despite clean-tech having been found to be a ‘noble way to lose money’ after several patient years of investment, according to past CIO of CalPERS in a Wall Street Journal interview of 2013. (my bold)

Indeed, a review of the performance of renewable energy companies is concerning – particularly the level of expectation and investment versus scope of real or possible failure. The electric vehicle company “A Better Place” cars was valued at some $2 billion in the fall of 2012, by the spring of 2013 it had gone bankrupt, valued only at $12 million, despite having had a raft of experienced Wall Street investors. More recently, Spain’s Abengoa began spectacular bankruptcy proceedings, also putting some 27,000 employees world-wide at risk of unemployment. (my bold)

Unusual new market instruments like the ‘yieldco’ has led to catastrophic financial outcomes, as in the case of SunEdison’s $16.1 billion bankruptcy filing.  Devonshire Research (Part II-May 2016)41 is claiming that the much-vaunted Tesla is reliant on subsidies: “Tesla is not a car, battery, or tech company; it is an experimental financial services company and should be regulated as such” and that “Tesla has engaged in aggressive accounting that calls to mind the experiences of Enron and WorldCom; its future is highly uncertain.” (my bold)

Recent research by Cambridge engineering professor Michael J. Kelly (2016) shows that wind and solar do not provide sufficient Energy Return on Energy Invested (EROI) to maintain even basic society, and that: “all the actions taken together until now to reduce our emissions of carbon dioxide will not achieve a serious reduction, and in some cases, they will actually make matters worse.”

Thus, there is an evident divide between evidence and ideologies when the concepts of ‘renewable’ and ‘sustainable’ are applied in the field, as well.

The Ethics of CO2 Hysteria

Climate change is often framed as a moral and ethical concern, thus one must question the ethics of those participating in peer-reviewed research who are psychology professionals but who employ such tactics, especially when the scientific evidence of global temperature rise does not support the Catastrophic Anthropogenic Global Warming theory. This discrepancy between the surveyed ‘beliefs’ and the physical evidence demonstrates that opinion-based ‘consensus’ surveys are scientifically worthless and are an improper and potentially dangerous basis for making climate change policy.

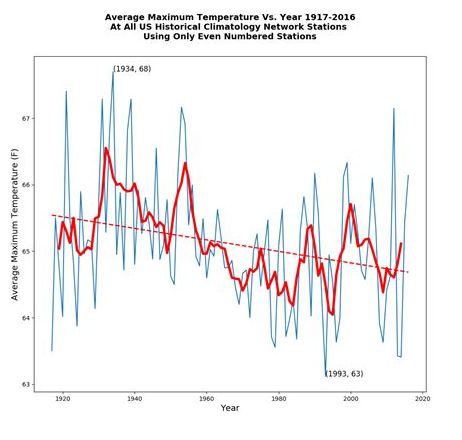
To date, much of the world’s diverse climate policy has been predicated upon public acceptance that there is an urgent crisis of human-caused global warming, but this claim is not supported by the temperature records. As noted by Tol in a response to the Grantham Research Institute: “The twenty-two studies cited above all agree that the impact of climate change is small relative to economic growth. This was found in studies by Professor William Nordhaus and Professor Samuel Fankhauser. It was confirmed by the Intergovernmental Panel on Climate Change from its Second Assessment Report, in a chapter led by the late Professor David Pearce, to its Fifth Assessment Report, in a chapter led by me. Even the highest estimate, the 20% upper bound by Lord Professor Nicholas Stern of Brentford, has that a century of climate change is not worse than losing a decade of economic growth.” [bold emphasis added]

Thus, even economic evidence does not support the ‘belief’ in human caused global warming; actual temperature data certainly does not support the claims of impending catastrophic climate change.


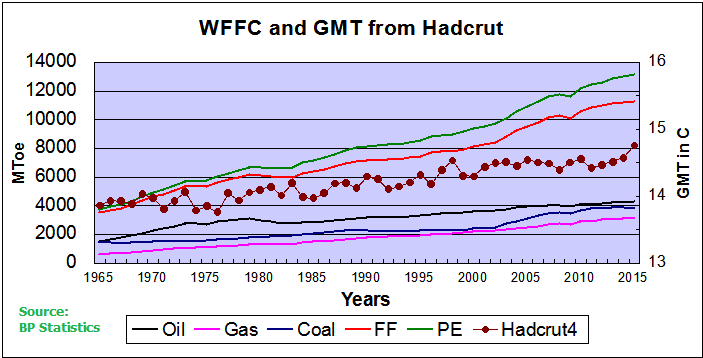
The evidence shows that the world runs on three cubic miles of oil equivalent energy every year, of which one cubic mile is oil. All renewable devices such as wind turbines and solar panels are manufactured using vast amounts of oil, natural gas and coal. As Vaclav Smil notes, ‘to get wind you need oil.’

Conclusion

Science is not a democratic undertaking. It is unfortunate that respected scientific journals continue to publish such papers without critical vetting as to whether the ‘consensus’ claims equate to the empirical evidence. Public policy on climate change should be evidence-based and carefully thought through in the context of longer time-scales, historical evidence and paleoclimatology.

There is no consideration that the study of 4 billion years of climate change, written in the strata of the earth, might make those scientists working with fossil fuel industries question the claims of Anthropogenic Global Warming proponents whose evidence relies on spotty temperature records of some 100 years, climate models and unproven theories.

While much good came of the original impetus of the “Law of the Atmosphere” in terms of reducing noxious pollutants, much economic and social harm is being done by the current hysteria focussed solely on carbon dioxide. France has learned that lesson the hard way, having incentivized diesel cars and trucks in order to reduce carbon dioxide, only to find its gem – the City of Lights – Paris – blackened with the worst air quality in the world thanks to a significant rise in soot and nitrogen oxide.

Consensus = nonsensus. We must look at the evidence over ideology.


Climate Lemmings

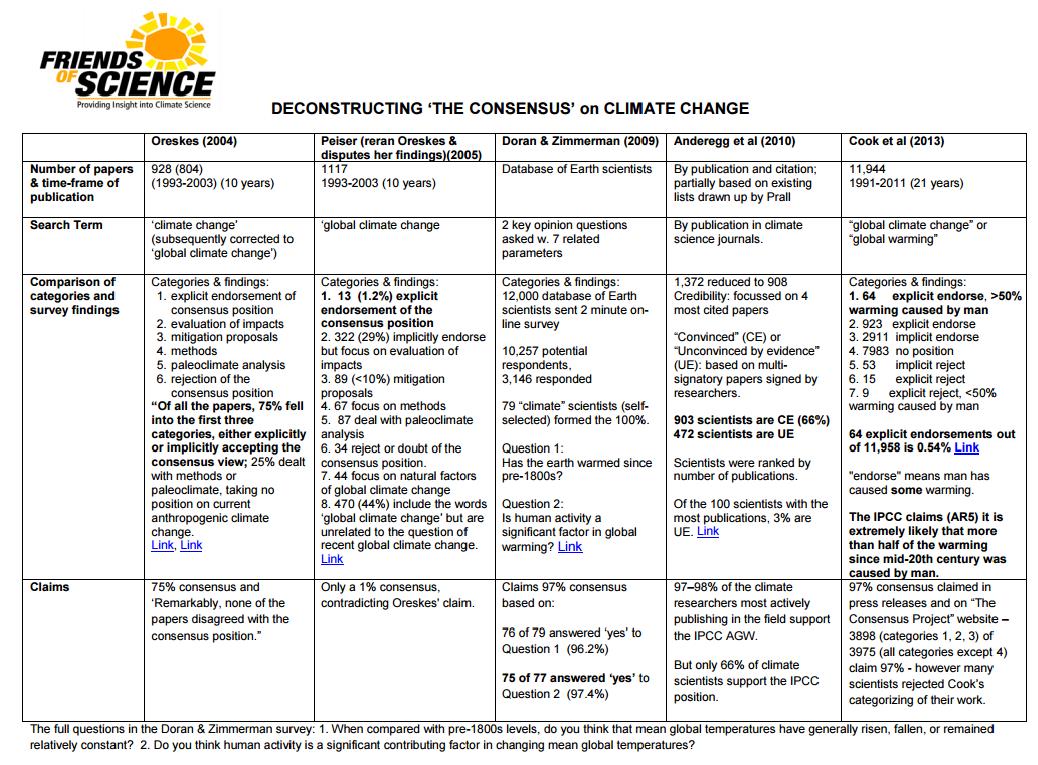
The excerpts above come from Michelle Stirling’s paper Consensus Nonsensus on 97%: Science is not a Democracy

Stirling’s presentation dissects the 97% consensus, powerpoint slides are here: The Myth of the 97% consensus

Fear Not for Permafrosty


The Permafrost Bogeyman is Back!

The Climate Scare of this Week is apparently melting permafrost.The Met Office warning on April 10:

Increased climate change risk to permafrost. Global warming will thaw about 20% more permafrost than previously thought, scientists have warned – potentially releasing significant amounts of greenhouse gases into the Earth’s atmosphere.

The researchers, from Sweden and Norway as well as the UK, suggest that the huge permafrost losses could be averted if ambitious global climate targets are met.

Lead-author Dr Sarah Chadburn of the University of Leeds said: “A lower stabilisation target of 1.5ºC would save approximately two million square kilometres of permafrost.

“Achieving the ambitious Paris Agreement climate targets could limit permafrost loss. For the first time we have calculated how much could be saved.”

The permafrost bogeyman has been reported before, been debunked, but will likely return again like a zombie that never dies. I have likened the climate false alarm system to a Climate Whack-A-Mole game because the scary notions keep popping up no matter how often you beat them down with reason and facts. So once again into the breach, this time on the subject of Permafrost.

Permafrost basics

I Travelled to the Arctic to Plunge a Probe Into the Melting Permafrost is a Motherboard article that aims to alarm but also provides some useful information.

The ground above the permafrost that freezes and thaws on an annual cycle is called the active layer. The uppermost segment is organic soil, because it contains all the roots and decomposing vegetation from the surface. Beneath the organic layer is the moist, clay-like mineral soil, which sits directly on top of the permafrost. The types of vegetation will influence the contents of the soil—but in return, the soil determines what can grow there.

Kholodov inserted probes into the layers of soil and the permafrost to measure its temperature, moisture content, and thermal conductivity. The air-filled organic layer is a much better insulator than the waterlogged mineral soil. So an ecosystem with a thicker organic layer, where there’s more vegetation, should provide better protection for the permafrost below.

On a warm morning in the boreal forests around Fairbanks, Loranty squeezed between two black spruce trees and motioned to all the woody debris scattered on the ground. “Here, where we have more trees and denser forests, we have shallower permafrost thaw depths.”

He grabbed a T-shaped depth probe and shoved it into the ground. It only sank about a handspan before it struck permafrost. “When you have trees, they provide shade,” he said, “and that prevents the ground from getting too warm in the summer.” So here, the permafrost is shallow, right beneath the surface.

Other vegetation, like moss, can also protect permafrost. “It’s fluffy, with lots of airspace, like a down coat,” Loranty explained, “and heat can’t move through it well, so it’s a good insulator.”

But 800km north on the tundra, close to the Arctic Ocean, there are no trees. It’s a less productive ecosystem than the forest and provides little insulation to the frozen ground. Here, low-lying shrubs, grasses, and lichens dominate underfoot. When I grabbed the depth probe and pushed it in, it sunk down a meter before it bottomed out because the permafrost was much deeper.

Permafrost Nittty Gritty

To really understand permafrost, it helps to listen to people dealing with Arctic infrastructure like roads. A thorough discussion and analysis is presented in Impacts of permafrost degradation on a road embankment at Umiujaq in Nunavik (Quebec), Canada By Richard Fortier, Anne-Marie LeBlanc, and Wenbing Yu

Fig. 1. Permafrost distribution and marine transgression in Nunavik (modified after Allard and Seguin 1987). Location of the 14 Inuit communities in Nunavik.

Following the retreat of the Wisconsin Ice Sheet about 7600–7300 years B.P. on the east coast of Hudson Bay (Hillaire–Marcel 1976; Allard and Seguin 1985) and about 7500– 7000 years B.P. in Ungava (Gray et al. 1980; Allard et al. 1989), the sea flooded a large band of coastline in Nunavik (Fig. 1). Glaciomarine sediments were then deposited in deep water in the Tyrrell and D’Iberville Seas (Fig. 1). Due to the isostatic rebound, once exposed to the cold atmosphere, the raised marine deposits were subsequently eroded and colonized by vegetation, and permafrost aggraded from sporadic permafrost to continuous permafrost with increasing latitude (Fig. 1).

A case study is presented herein on recent thaw subsidence observed along the access road to the Umiujaq Airport in Nunavik (Quebec). In addition to the measurement of the subsidence, a geotechnical and geophysical investigation including a piezocone test, ground-penetrating radar (GPR) profiling, and electrical resistivity tomography (ERT) was carried out to characterize the underlying stratigraphy and permafrost conditions. In the absence of available ground temperature data for assessing the causes of permafrost degradation, numerical modeling of the thermal regime of the road embankment and subgrade was also undertaken to simulate the impacts of (i) an increase in air temperature observed recently in Nunavik and (ii) the thermal insulation effect of snow accumulating on the embankment shoulders and toes. The causes and effects of permafrost degradation on the road embankment are also discussed.

Fig. 11. (a) GPR reflection profile carried out on 14 July 2006 in the field with the 100 MHz antennas at a fixed offset of 1 m. (b) Major reflectors identified on the GPR reflection profile. (c) Cross section of the ground based on the combined interpretation of the GPR reflection profile and model of electrical resistivity (Fig. 12c). Note the vertical exaggeration (1:5).

Values of thawing and freezing n-factors according to the surface conditions (Figs. 4 and 13) are given in Table 1. The gray road surface absorbs solar radiation in summer, inducing a higher surface temperature than air temperature and a higher thawing n-factor than the ones for the natural ground surface. The thawing n-factor is close to unity and the surface temperature is close to the air temperature in summer for the natural ground surface (ground surface boundaries Nos. 2, 3, and 4). Due to the absence of snow cover on the road surface, the freezing n-factor is close to unity. However, an increase in snow thickness leads to a decrease in the freezing n-factor (Fig. 13 and Table 1). We make the assumption that from one year to another there is no change in surface conditions due to climate variability and the thawing and freezing n-factors are constant.

Fig. 13. Cross section of the road embankment and subgrade showing the stratigraphy and boundary conditions used for the numerical modeling. The numbers between arrows refer to the ground surface boundaries (Table 1)

Only the governing equation of heat transfer by conduction taking into account the phase change problem was considered to simulate the permafrost warming and thawing underneath the road embankment. However, complex processes of heat transfer, groundwater flow, and thaw consolidation can take place in degrading permafrost. The development of a two dimensional numerical model of these coupled processes is needed to accurately predict the thaw subsidence based on the thaw consolidation properties of permafrost and to compare this prediction with the performance of the access road to Umiujaq Airport.

As expected from the design of thick road embankments in cold regions,the permafrost table has moved upward 0.9 m underneath the road embankment, preventing permafrost degradation (Fig. 14a). However, the permafrost is slightly warmer by a few tenths of degree Celsius underneath the road embankment than away from the road (Fig. 15). This increase in permafrost temperature due to the thermal effect of the road embankment makes the permafrost more vulnerable to any potential climate warming. The permafrost base in the bedrock has also moved upward 3.9 m for a permafrost thinning of 3 m (Fig. 15). This thawing taking place at the permafrost base does not induce any thaw settlement because the bedrock is thaw stable.

The subsidence is due to thaw consolidation taking place in a layer of ice-rich silt underneath a superficial sand layer. While the seasonal freeze–thaw cycles were initially restricted to the sand layer, the thawing front has now reached the thaw-unstable ice-rich silt layer. According to our numerical modeling, the increase in air temperature recently observed in Nunavik cannot be the sole cause of the observed subsidence affecting this engineering structure. The thick embankment also acts as a snow fence favoring the accumulation of snow on the embankment shoulders. The permafrost degradation is also due to the thermal insulation of the snow cover reducing heat loss in the embankment shoulders and toes.

Permafrost in Russia

Yakutsk Permafrost Institute Underground Lab

The Russians are seasoned permafrost scientists with Siberia as their preserve, and their observations are balanced by their long experience. The latest Russia report is from 2010.

We conclude the following based on initial analysis and interpretation of the data obtained in this project:

  • Most of the permafrost observatories in Russia show substantial warming of permafrost during the last 20 to 30 years. The magnitude of warming varied with location, but was typically from 0.5C to 2C at the depth of zero annual amplitude. This warming occurred predominantly between the 1970s and 1990s. There was no significant observed warming in permafrost temperatures in the 2000s in most of the research areas; some sites even show a slight cooling during the late 1990s and early 2000s.
  • Warming has resumed during the last two to three years at many locations predominantly near the coasts of the Arctic Ocean. Much less or no warming was observed during the 1980s and 1990s in the north of East Siberia. However, the last three years show significant permafrost warming in the eastern part of this region.
  • Permafrost is thawing in specific landscape settings within the southern part of the permafrost domain in the European North and in northwest Siberia. Formation of new closed taliks and an increase in the depth of preexisting taliks have been observed in this area during the last 20 to 30 years.

Methane Realism

An article in Scientific American raises several concerns about permafrost, but does add some realism:

First, while most of the methane is believed to be buried roughly 200 meters below the sea bed, only the top 25 meters or so of sea-bed are currently thawed, and thawing seems to have only progressed by about one meter in the last 25 years – a pace that suggests that the large bulk of the buried methane will stay in place for centuries to come.

Second, several thousand years ago, when orbital mechanics maximized Arctic warmth, the area around the North Pole is believed to have been roughly 4 degrees Celsius warmer than it is today and covered in less sea ice than today. Yet there’s no evidence of a massive amount of methane release in this time.

Third, the last time methane was released in vast quantities into the atmosphere – during the Paleocene-Eocene Thermal Maximum 56 million years ago – the process didn’t happen overnight. It took thousands of years.

Put those facts together, and we are probably not in danger of a methane time bomb going off any time soon.

Summary

The active layer of permafrost does vary from time to time and place to place. There was warming and some permafrost melting end of last century, but lately not so much. Any specific permafrost layer is influenced by many factors, including air temperatures, snow cover and vegetation, as well as the structure of the land, combining fill, sand, silt, ice and salinity mixtures on top of bedrock.

And nature includes negative feedbacks to permafrost melt. Any vegetation, even moss, growing in unfrozen soil provides insulation limiting further melting, as well as absorbing additional CO2. Reduced snowcover aids freezing and constrains later melting.

Rather than a permafrost bogeyman, we need a more people-friendly mascot. Consider our traditional nature friends loved by children and adults.

For example, Smokey the Bear

Rudolph the Reindeer

And the ever-popular Cola Bear

Introducing Permafrosty


Permafrosty is here!  Love him tender, and he’ll never let you down.

Additional Background on Permafrost in an earlier post The Permafrost Bogeyman


Fossil Fuels ≠ Global Warming

Previous posts addressed the claim that fossil fuels are driving global warming. This post updates that analysis with the latest numbers from BP Statistics and compares World Fossil Fuel Consumption (WFFC) with three estimates of Global Mean Temperature (GMT). More on both these variables below.

WFFC

2015 statistics are now available from BP for international consumption of Primary Energy sources. Statistical Review of World Energy.  H/T  Euan Mearns

The reporting categories are:
Oil
Natural Gas
Coal
Nuclear
Hydro
Renewables (other than hydro)

This analysis combines the first three, Oil, Gas, and Coal for total fossil fuel consumption world wide. The chart below shows the patterns for WFFC compared to world consumption of Primary Energy from 1965 through 2015.

The graph shows that Primary Energy consumption has grown continuously for 5 decades. Over that period oil, gas and coal (sometimes termed “Thermal”) averaged 90% of PE consumed, ranging from 94% in 1965 to 86% in 2015.  MToe is millions of tons of oil equivalents.

Global Mean Temperatures

Everyone acknowledges that GMT is a fiction since temperature is an intrinsic property of objects, and varies dramatically over time and over the surface of the earth. No place on earth determines “average” temperature for the globe. Yet for the purpose of detecting change in temperature, major climate data sets estimate GMT and report anomalies from it.

UAH record consists of satellite era global temperature estimates for the lower troposphere, a layer of air from 0 to 4km above the surface. HadSST estimates sea surface temperatures from oceans covering 71% of the planet. HADCRUT combines HadSST estimates with records from land stations whose elevations range up to 6km above sea level.

Both GISS LOTI (land and ocean) and HADCRUT4 (land and ocean) use 14.0 Celsius as the climate normal, so I will add that number back into the anomalies. This is done not claiming any validity other than to achieve a reasonable measure of magnitude regarding the observed fluctuations.

No doubt global sea surface temperatures are typically higher than 14C, more like 17 or 18C, and of course warmer in the tropics and colder at higher latitudes. Likewise, the lapse rate in the atmosphere means that air temperatures both from satellites and elevated land stations will range colder than 14C. Still, that climate normal is a generally accepted indicator of GMT.

Correlations of GMT and WFFC

The first graph compares to GMT estimates over the five decades from 1965 to 2015 from HADCRUT4, which includes HadSST3.

Over the last five decades the increase in fossil fuel consumption is dramatic and monotonic, steadily increasing by 220% from 3.5B to 11.3 B oil equivalent tons.  Meanwhile the GMT record from Hadcrut shows multiple ups and downs with an accumulated rise of 0.9C over 50 years, 6% of the starting value.

The second graph compares to GMT estimates from UAH6, and HadSST3 for the satellite era from 1979 to 2015, a period of 36 years.

In the satellite era WFFC has increased at a compounded rate of nearly 2% per year, for a total increase of 84% since 1979. At the same time, SSTs and  lower troposphere warming amounted to 0.5C, or 3.4% of the starting value.  The temperature rate of change is 0.1% per year, an order of magnitude less.  Even more obvious is the 1998 El Nino peak and flat GMT since.

Summary

The climate alarmist/activist claim is straight forward: Burning fossil fuels makes measured temperatures warmer. The Paris Accord further asserts that by reducing human use of fossil fuels, further warming can be prevented.  Those claims do not bear up under scrutiny.

It is enough for simple minds to see that two time series are both rising and to think that one must be causing the other. But both scientific and legal methods assert causation only when the two variables are both strongly and consistently aligned. The above shows a weak and inconsistent linkage between WFFC and GMT.

In legal terms, as long as there is another equally or more likely explanation for the set of facts, the claimed causation is unproven. The more likely explanation is that global temperatures vary due to oceanic and solar cycles. The proof is clearly and thoroughly set forward in the post Quantifying Natural Climate Change.

Background context for today’s post is at Claim: Fossil Fuels Cause Global Warming.

Spreading Climatephobia


Depression, anxiety, PTSD: The mental impact of climate change is an article from CNN (“All the Fear All the Time”). It starts with a compelling human interest story about a woman suffering emotional problems due to flooding of her home in Shropshire UK.

Two years later, not long after work was completed on their rural home, they got a sign of what it really meant to live in their new village: It was prone to flooding.

They were almost struck by the extreme weather seen in the UK in 2014, which saw major storms hit the country at levels not seen in the country for over 20 years.

The family of four lived in a recreational vehicle on the surrounding farmland for more than a year after the flood, while they dealt with insurers and builders who would eventually restore their home.

Their finances were hit hard, and daily life was a challenge. “All that we had worked for was completely destroyed,” Shepherd said.

According to Shepherd, her village was also flooded in 2001, 2002, 2003 and 2005, though her house was not directly affected in those years. She also now has a flood plan that outlines everything she needs to do if this were to happen again.

“One of the major health effects of flooding seems to be the mental health aspects,” said James Rubin, a psychologist at Kings College London whose recent research looked into the psychological impact of people both directly and indirectly effected by floods. “There are a whole host of stressors around it,” he said.

These types of natural disasters are expected to rise in frequency due to climate change, and Rubin feels that the mental health aspect deserves more attention.  “Preventing (climate change) from happening, from worsening and intervening is really important,” he said.

Climate change is predicted to bring more than just floods: There could be heat waves, sea level rises causing loss of land, and forced migration and droughts affecting agriculture and the farmers producing it. And with these concerns comes a plethora of issues plaguing the human mind, such as depression, worry, anxiety, substance abuse, aggression and even suicide among those who cannot cope.

Climate Activists/Alarmists  Are to Blame for Climatephobia

In their push for “saving the planet” they strive to portray nature in the role of the Big Bad Wolf, who scared the three little pigs by threatening to “Huff and Puff and Blow Your House Down.” Of course in the fable, the adaptive solution was to build a brick house not on a flood plane.

The false claims of future bad weather due to human activity do cause people to be anxious beyond reason.  Natural disasters have always done damage and required efforts to recover. What is new is the added doomsday predictions without a shred of evidence.

Droughts and Floods are not showing any particular trend: Data vs. Models; Droughts and Floods

This is your brain on climate alarm.

Climatephobia is addictive. Just say No!

Footnote: The post Climate Medicine describes the larger effort by medical scientists to cash in on climate funding.

Reservoirs and Methane: Facts and Fears


A previous post explained how methane has been hyped in support of climate alarmism/activism. Now we have an additional campaign to disparage hydropower because of methane emissions from dam reservoirs. File this under “They have no shame.”

Here’s a recent example of the claim from Asia Times Global hydropower boom will add to climate change

The study, published in BioScience, looked at the carbon dioxide (CO2), methane (CH4), and nitrous oxide (N2O) emitted from 267 reservoirs across six continents. In total, the reservoirs studied have a surface area of more than 77,287 square kilometers (29,841 square miles). That’s equivalent to about a quarter of the surface area of all reservoirs in the world, which together cover 305,723 sq km – roughly the combined size of the United Kingdom and Ireland.

“The new study confirms that reservoirs are major emitters of methane, a particularly aggressive greenhouse gas,” said Kate Horner, Executive Director of International Rivers, adding that hydropower dams “can no longer be considered a clean and green source of electricity.”

In fact, methane’s effect is 86 times greater than that of CO2 when considered on this two-decade timescale. Importantly, the study found that methane is responsible for 90% of the global warming impact of reservoir emissions over 20 years.

Alarmists are Wrong about Hydropower

Now CH4 is proclaimed the primary culprit held against hydropower. As usual, there is a kernel of truth buried beneath this obsessive campaign: Flooding of biomass does result in decomposition accompanied by some release of CH4 and CO2. From HydroQuebec:  Greenhouse gas emissions and reservoirs

Impoundment of hydroelectric reservoirs induces decomposition of a small fraction of the flooded biomass (forests, peatlands and other soil types) and an increase in the aquatic wildlife and vegetation in the reservoir.

The result is higher greenhouse gas (GHG) emissions after impoundment, mainly CO2 (carbon dioxide) and a small amount of CH4 (methane).

However, these emissions are temporary and peak two to four years after the reservoir is filled.

During the ensuing decade, CO2 emissions gradually diminish and return to the levels given off by neighboring lakes and rivers.

Hydropower generation, on average, emits 50 times less GHGs than a natural gas generating station and about 70 times less than a coal-fired generating station.

The Facts about Tropical Reservoirs

Activists estimate Methane emissions from dams and reservoirs across the planet, including hydropower, are estimated to be significantly larger than previously thought, approximately equal to 1 gigaton per year.

Activists also claim that dams in boreal regions like Quebec are not the problem, but tropical reservoirs are a big threat to the climate. Contradicting that is an intensive study of Brazilian dams and reservoirs, Greenhouse Gas Emissions from Reservoirs: Studying the Issue in Brazil

The Itaipu Dam is a hydroelectric dam on the Paraná River located on the border between Brazil and Paraguay. The name “Itaipu” was taken from an isle that existed near the construction site. In the Guarani language, Itaipu means “the sound of a stone”. The American composer Philip Glass has also written a symphonic cantata named Itaipu, in honour of the structure.

Five Conclusions from Studying Brazilian Reservoirs

1) The budget approach is essential for a proper grasp of the processes going on in reservoirs. This approach involves taking into account the ways in which the system exchanged GHGs with the atmosphere before the reservoir was flooded. Older studies measured only the emissions of GHG from the reservoir surface or, more recently, from downstream de-gassing. But without the measurement of the inputs of carbon to the system, no conclusions can be drawn from surface measurements alone.

2) When you consider the total budgets, most reservoirs acted as sinks of carbon in the short run (our measurements covered one year in each reservoir). In other words, they received more carbon than they exported to the atmosphere and to downstream.

3) Smaller reservoirs are more efficient as carbon traps than the larger ones.

4) As for the GHG impact, in order to determine it, we should add the methane (CH4) emissions to the fraction of carbon dioxide (CO2) emissions which comes from the flooded biomass and organic carbon in the flooded (terrestrial) soil. The other CO2 emissions, arising from the respiration of aquatic organisms or from the decomposition of terrestrial detritus that flows into the reservoir (including domestic sewage), are not impacts of the reservoir. From this sum, we should deduct the amount of carbon that is stored in the sediment and which will be kept there for at least the life of the reservoir (usually more than 80 years). This “stored carbon” ranges from as little as 2 percent of the total carbon output to more than 25 percent, depending on the reservoirs.

5) When we assess the GHG impacts following the guidelines just described, all of FURNAS’s reservoirs have lower emissions than the cleanest European oil plant. The worst case – Manso, which was sampled only three years after the impoundment, and therefore in a time in which the contribution from the flooded biomass was still very significant – emitted about half as much carbon dioxide equivalents (CO2 eq) as the average oil plant from the United States (CO2 eq is a metric measure used to compare the emissions from various greenhouse gases based upon their global warming potential, GWP. CO2 eq for a gas is derived by multiplying the tons of the gas by the associated GWP.) We also observed a very good correlation between GHG emissions and the age of the reservoirs. The reservoirs older than 30 years had negligible emissions, and some of them had a net absorption of CO2eq.

Keeping Methane in Perspective

Over the last 30 years, CH4 in the atmosphere increased from 1.6 ppm to 1.8 ppm, compared to CO2, presently at 400 ppm. So all the dam building over 3 decades, along with all other land use was part of a miniscule increase of a microscopic gas, 200 times smaller than the trace gas, CO2.


Background Facts on Methane and Climate Change

The US Senate is considering an act to repeal with prejudice an Obama anti-methane regulation. The story from activist source Climate Central is
Senate Mulls ‘Kill Switch’ for Obama Methane Rule

The U.S. Senate is expected to vote soon on whether to use the Congressional Review Act to kill an Obama administration climate regulation that cuts methane emissions from oil and gas wells on federal land. The rule was designed to reduce oil and gas wells’ contribution to climate change and to stop energy companies from wasting natural gas.

The Congressional Review Act is rarely invoked. It was used this month to reverse a regulation for the first time in 16 years and it’s a particularly lethal way to kill a regulation as it would take an act of Congress to approve a similar regulation. Federal agencies cannot propose similar regulations on their own.

The Claim Against Methane

Now some Republican senators are hesitant to take this step because of claims like this one in the article:

Methane is 86 times more potent as a greenhouse gas than carbon dioxide over a period of 20 years and is a significant contributor to climate change. It warms the climate much more than other greenhouse gases over a period of decades before eventually losing its potency. Atmospheric carbon dioxide remains a potent greenhouse gas for thousands of years.

Essentially the journalist is saying: As afraid as you are about CO2, you should be 86 times more afraid of methane. Which also means, if CO2 is not a warming problem, your fear of methane is 86 times zero. The thousands of years claim is also bogus, but that is beside the point of this post, which is Methane.

IPCC Methane Scare

The article helpfully provides a link referring to Chapter 8 of IPCC AR5 report by Working Group 1 Anthropogenic and Natural Radiative Forcing.

The document is full of sophistry and creative accounting in order to produce as scary a number as possible. Table 8.7 provides the number for CH4 potency of 86 times that of CO2.  They note they were able to increase the Global Warming Potential (GWP) of CH4 by 20% over the estimate in AR4. The increase comes from adding in more indirect effects and feedbacks, as well as from increased concentration in the atmosphere.

In the details are some qualifying notes like these:

Uncertainties related to the climate–carbon feedback are large, comparable in magnitude to the strength of the feedback for a single gas.

For CH4 GWP we estimate an uncertainty of ±30% and ±40% for 20- and 100-year time horizons, respectively (for 5 to 95% uncertainty range).

Methane Facts from the Real World
From Sea Friends (here):

Methane is natural gas CH4 which burns cleanly to carbon dioxide and water. Methane is eagerly sought after as fuel for electric power plants because of its ease of transport and because it produces the least carbon dioxide for the most power. Also cars can be powered with compressed natural gas (CNG) for short distances.

In many countries CNG has been widely distributed as the main home heating fuel. As a consequence, methane has leaked to the atmosphere in large quantities, now firmly controlled. Grazing animals also produce methane in their complicated stomachs and methane escapes from rice paddies and peat bogs like the Siberian permafrost.

It is thought that methane is a very potent greenhouse gas because it absorbs some infrared wavelengths 7 times more effectively than CO2, molecule for molecule, and by weight even 20 times. As we have seen previously, this also means that within a distance of metres, its effect has saturated, and further transmission of heat occurs by convection and conduction rather than by radiation.

Note that when H20 is present in the lower troposphere, there are few photons left for CH4 to absorb:

Even if the IPCC radiative greenhouse theory were true, methane occurs only in minute quantities in air, 1.8ppm versus CO2 of 390ppm. By weight, CH4 is only 5.24Gt versus CO2 3140Gt (on this assumption). If it truly were twenty times more potent, it would amount to an equivalent of 105Gt CO2 or one thirtieth that of CO2. A doubling in methane would thus have no noticeable effect on world temperature.

However, the factor of 20 is entirely misleading because absorption is proportional to the number of molecules (=volume), so the factor of 7 (7.3) is correct and 20 is wrong. With this in mind, the perceived threat from methane becomes even less.

Further still, methane has been rising from 1.6ppm to 1.8ppm in 30 years (1980-2010), assuming that it has not stopped rising, this amounts to a doubling in 2-3 centuries. In other words, methane can never have any measurable effect on temperature, even if the IPCC radiative cooling theory were right.

Because only a small fraction in the rise of methane in air can be attributed to farm animals, it is ludicrous to worry about this aspect or to try to farm with smaller emissions of methane, or to tax it or to trade credits.

The fact that methane in air has been leveling off in the past two decades, even though we do not know why, implies that it plays absolutely no role as a greenhouse gas.

More information at THE METHANE MISCONCEPTIONS by Dr Wilson Flood (UK) here

Summary:

Natural Gas (75% methane) burns the cleanest with the least CO2 for the energy produced.

Leakage of methane is already addressed by efficiency improvements for its economic recovery, and will apparently be subject to even more regulations.

The atmosphere is a methane sink where the compound is oxidized through a series of reactions producing 1 CO2 and 2H20 after a few years.

GWP (Global Warming Potential) is CO2 equivalent heat trapping based on laboratory, not real world effects.

Any IR absorption by methane is limited by H2O absorbing in the same low energy LW bands.

There is no danger this century from natural or man-made methane emissions.

Conclusion

Senators and the public are being bamboozled by opaque scientific bafflegab. The plain truth is much different. The atmosphere is a methane sink in which CH4 is oxidized in the first few meters. The amount of CH4 available in the air is miniscule, even compared to the trace gas CO2, and it is not accelerating. Methane is the obvious choice to signal virtue on the climate issue since governmental actions will not make a bit of difference anyway, except perhaps to do some economic harm.

Give a daisy a break (h/t Derek here)

Daisy methane

Footnote:

For a more thorough and realistic description of atmospheric warming see:

Fearless Physics from Dr. Salby

More Methane Madness

*Data visualization shows the methane plume from the Aliso Canyon gas leak (in red) in Los Angles

The US Senate is considering an act to repeal with prejudice an Obama anti-methane regulation. The story from activist source Climate Central is
Senate Mulls ‘Kill Switch’ for Obama Methane Rule

The U.S. Senate is expected to vote soon on whether to use the Congressional Review Act to kill an Obama administration climate regulation that cuts methane emissions from oil and gas wells on federal land. The rule was designed to reduce oil and gas wells’ contribution to climate change and to stop energy companies from wasting natural gas.

The Congressional Review Act is rarely invoked. It was used this month to reverse a regulation for the first time in 16 years and it’s a particularly lethal way to kill a regulation as it would take an act of Congress to approve a similar regulation. Federal agencies cannot propose similar regulations on their own.

The Claim Against Methane

Now some Republican senators are hesitant to take this step because of claims like this one in the article:

Methane is 86 times more potent as a greenhouse gas than carbon dioxide over a period of 20 years and is a significant contributor to climate change. It warms the climate much more than other greenhouse gases over a period of decades before eventually losing its potency. Atmospheric carbon dioxide remains a potent greenhouse gas for thousands of years.

Essentially the journalist is saying: As afraid as you are about CO2, you should be 86 times more afraid of methane. Which also means, if CO2 is not a warming problem, your fear of methane is 86 times zero. The thousands of years claim is also bogus, but that is beside the point of this post, which is Methane.

IPCC Methane Scare

The article helpfully provides a link referring to Chapter 8 of IPCC AR5 report by Working Group 1 Anthropogenic and Natural Radiative Forcing.

The document is full of sophistry and creative accounting in order to produce as scary a number as possible. Table 8.7 provides the number for CH4 potency of 86 times that of CO2.  They note they were able to increase the Global Warming Potential (GWP) of CH4 by 20% over the estimate in AR4. The increase comes from adding in more indirect effects and feedbacks, as well as from increased concentration in the atmosphere.

In the details are some qualifying notes like these:

Uncertainties related to the climate–carbon feedback are large, comparable in magnitude to the strength of the feedback for a single gas.

For CH4 GWP we estimate an uncertainty of ±30% and ±40% for 20- and 100-year time horizons, respectively (for 5 to 95% uncertainty range).


Methane Facts from the Real World
From Sea Friends (here):

Methane is natural gas CH4 which burns cleanly to carbon dioxide and water. Methane is eagerly sought after as fuel for electric power plants because of its ease of transport and because it produces the least carbon dioxide for the most power. Also cars can be powered with compressed natural gas (CNG) for short distances.

In many countries CNG has been widely distributed as the main home heating fuel. As a consequence, methane has leaked to the atmosphere in large quantities, now firmly controlled. Grazing animals also produce methane in their complicated stomachs and methane escapes from rice paddies and peat bogs like the Siberian permafrost.

It is thought that methane is a very potent greenhouse gas because it absorbs some infrared wavelengths 7 times more effectively than CO2, molecule for molecule, and by weight even 20 times. As we have seen previously, this also means that within a distance of metres, its effect has saturated, and further transmission of heat occurs by convection and conduction rather than by radiation.

Note that when H20 is present in the lower troposphere, there are few photons left for CH4 to absorb:

Even if the IPCC radiative greenhouse theory were true, methane occurs only in minute quantities in air, 1.8ppm versus CO2 of 390ppm. By weight, CH4 is only 5.24Gt versus CO2 3140Gt (on this assumption). If it truly were twenty times more potent, it would amount to an equivalent of 105Gt CO2 or one thirtieth that of CO2. A doubling in methane would thus have no noticeable effect on world temperature.

However, the factor of 20 is entirely misleading because absorption is proportional to the number of molecules (=volume), so the factor of 7 (7.3) is correct and 20 is wrong. With this in mind, the perceived threat from methane becomes even less.

Further still, methane has been rising from 1.6ppm to 1.8ppm in 30 years (1980-2010), assuming that it has not stopped rising, this amounts to a doubling in 2-3 centuries. In other words, methane can never have any measurable effect on temperature, even if the IPCC radiative cooling theory were right.

Because only a small fraction in the rise of methane in air can be attributed to farm animals, it is ludicrous to worry about this aspect or to try to farm with smaller emissions of methane, or to tax it or to trade credits.

The fact that methane in air has been leveling off in the past two decades, even though we do not know why, implies that it plays absolutely no role as a greenhouse gas.

More information at THE METHANE MISCONCEPTIONS by Dr Wilson Flood (UK) here

Summary:

Natural Gas (75% methane) burns the cleanest with the least CO2 for the energy produced.

Leakage of methane is already addressed by efficiency improvements for its economic recovery, and will apparently be subject to even more regulations.

The atmosphere is a methane sink where the compound is oxidized through a series of reactions producing 1 CO2 and 2H20 after a few years.

GWP (Global Warming Potential) is CO2 equivalent heat trapping based on laboratory, not real world effects.

Any IR absorption by methane is limited by H2O absorbing in the same low energy LW bands.

There is no danger this century from natural or man-made methane emissions.

Conclusion

Senators and the public are being bamboozled by opaque scientific bafflegab. The plain truth is much different. The atmosphere is a methane sink in which CH4 is oxidized in the first few meters. The amount of CH4 available in the air is miniscule, even compared to the trace gas CO2, and it is not accelerating. Methane is the obvious choice to signal virtue on the climate issue since governmental actions will not make a bit of difference anyway, except perhaps to do some economic harm.

Give a daisy a break (h/t Derek here)

Daisy methane

Footnote:

For a more thorough and realistic description of atmospheric warming see:

Fearless Physics from Dr. Salby

Three Wise Men Talking Climate

Everyone is entitled to their opinion on climate change, although renowned theoretical physicists may be especially persuasive. This post compares quotes from 3 of the most distinguished: Stephen Hawking (much in the news lately since Trump’s election), Freeman Dyson and Richard Feynman. Hawking is an alarmist, Dyson a skeptic and Feynman concerned about scientific integrity.

Stephen Hawking is a phenomenal human being, original thinker on grand design and genuinely concerned about humanity and our planetary home. His own battle with frailty gives weight to his opinions and observations. Thus when he meets with the Pope or Al Gore and warns about future global warming, many people will take his words seriously.

Comments on Climate Change by Stephen Hawking

On May 31, 2016 he said: “A more immediate danger is runaway climate change,” Hawking said. “A rise in ocean temperature would melt the ice-caps, and cause a release of large amounts of carbon dioxide from the ocean floor. Both effects could make our climate like that of Venus, with a temperature of 250 degrees.”

“Six years ago I was warning about pollution and overcrowding, they have gotten worse since then,” Hawking said. “The population has grown by half a billion since our last meeting with no end in sight. At this rate, it will be 11 billion by 2100. Air pollution has increased by 8 percent over the past five years.”

Elsewhere he has said, “I don’t think we will survive another 1,000 years without escaping beyond our fragile planet,” going on express concerns about consuming earth’s natural resources, nuclear war, climate change, genetically-engineered viruses and the rise of artificial intelligence spelling planetary doom.

Those are his opinions, not shared by other equally distinguished theoretical physicists, two examples being Freeman Dyson and Richard Feynman.

Freeman Dyson is best known for his contribution to Quantum Electrodynamics. Quantum Electrodynamics is the field where scientists study the interaction of electromagnetic radiation with electrically charged matter within the framework of relativity and quantum mechanics. Dyson wrote two books on the subject of Quantum Electrodynamics. His books influence many branches of modern day theoretical physics.

In his quest to expand our world of knowledge, properly control nuclear power, and discover more information on quantum electrodynamics, Freeman Dyson has written a large collection of books that explains how he believes that the world should grow more efficiently.

Comments on Climate Change by Freeman Dyson

I was in the business of studying climate change at least 30 years ago before it became fashionable. The idea that global warming is the most important problem facing the world is total nonsense and is doing a lot of harm. It distracts people’s attention from much more serious problems.

When I listen to the public debates about climate change, I am impressed by the enormous gaps in our knowledge, the sparseness of our observations and the superficiality of our theories.

We simply don’t know yet what’s going to happen to the carbon in the atmosphere.

We do not know how much of the environmental change is due to human activities and how much [is due] to long-term natural processes over which we have no control.

Computer models of the climate….[are] a very dubious business if you don’t have good inputs.

To any unprejudiced person reading this account, the facts should be obvious: that the non-climatic effects of carbon dioxide as a sustainer of wildlife and crop plants are enormously beneficial, that the possibly harmful climatic effects of carbon dioxide have been greatly exaggerated, and that the benefits clearly outweigh the possible damage.

The people who are supposed to be experts and who claim to understand the science are precisely the people who are blind to the evidence. Those of my scientific colleagues who believe the prevailing dogma about carbon dioxide will not find Goklany’s evidence convincing. . .That is to me the central mystery of climate science. It is not a scientific mystery but a human mystery. How does it happen that a whole generation of scientific experts is blind to obvious facts?

Richard Feynman revolutionized the field of quantum mechanics through conceiving the Feynman path integral, and by inventing Feynman diagrams for doing relativistic quantum mechanical calculations. Further he won the Nobel prize for his theory of quantum electrodynamics, and finally in particle physics he proposed the parton model to analyze high-energy hadron collisions.  He died in 1988 before global warming obsession was popularized, and so his comments apply mainly to how scientific theories should be treated with integrity.

Comments on Scientific Integrity by Richard Feynman

How Science Works: “In general, we look for a new law by the following process. First, we guess it (audience laughter), no, don’t laugh, that’s really true. Then we compute the consequences of the guess, to see what, if this is right, if this law we guess is right, to see what it would imply and then we compare the computation results to nature, or we say compare to experiment or experience, compare it directly with observations to see if it works.  If it disagrees with experiment, it’s wrong. In that simple statement is the key to science. It doesn’t make any difference how beautiful your guess is, it doesn’t matter how smart you are, who made the guess, or what his name is… If it disagrees with experiment, it’s wrong. That’s all there is to it.”

It’s a kind of scientific integrity, a principle of scientific thought that corresponds to a kind of utter honesty–a kind of leaning over backwards. For example, if you’re doing an experiment, you should report everything that you think might make it invalid–not only what you think is right about it: other causes that could possibly explain your results; and things you thought of that you’ve eliminated by some other experiment, and how they worked–to make sure the other fellow can tell they have been eliminated.

Details that could throw doubt on your interpretation must be given, if you know them. You must do the best you can–if you know anything at all wrong, or possibly wrong–to explain it. If you make a theory, for example, and advertise it, or put it out, then you must also put down all the facts that disagree with it, as well as those that agree with it. There is also a more subtle problem. When you have put a lot of ideas together to make an elaborate theory, you want to make sure, when explaining what it fits, that those things it fits are not just the things that gave you the idea for the theory; but that the finished theory makes something else come out right, in addition.

Summary

Hawking has gone to the dark side, foreseeing disaster from numerous modern developments, and includes climate change without challenging the precepts with his considerable critical intelligence. Dyson has analyzed radiative activity in quantum electrodynamics and sees clearly that effects from humanity’s minuscule addition to the trace gas CO2 does far more good for the biosphere than it does harm. Feynman encourages us not to accept answers claimed to be unquestionable.

This post was inspired by Lubos Motl, who blogged similarly on another issue (here), and Ivar Giaever who has long spoken out against alarmist claims. Two more outstanding physicists who have actually examined global warming claims and found them wanting.

Fearmongers Fan Forest Fire Flames

Playing Climate Whack-a-Mole again, this time with a recent outbreak of claims that forest fires will be worse due to climate change. For example:

Climate change found to double impact of forest fires

Over the past 30 years, human-caused climate change has nearly doubled the amount of forest area lost to wildfires in the western United States, a new study has found.

The result puts hard numbers to a growing hazard that experts say both Canada and the U.S. must prepare for as western forests across North America grow warmer and drier and increasingly spawn wildfires that cannot be contained.

The PNAS study referenced is: Impact of anthropogenic climate change on wildfire across western US forests

Abstract: Increased forest fire activity across the western United States in recent decades has contributed to widespread forest mortality, carbon emissions, periods of degraded air quality, and substantial fire suppression expenditures. Although numerous factors aided the recent rise in fire activity, observed warming and drying have significantly increased fire-season fuel aridity, fostering a more favorable fire environment across forested systems. We demonstrate that human-caused climate change caused over half of the documented increases in fuel aridity since the 1970s and doubled the cumulative forest fire area since 1984. This analysis suggests that anthropogenic climate change will continue to chronically enhance the potential for western US forest fire activity while fuels are not limiting.

It’s Not That Simple

As usual, the screaming headlines exaggerate a more complex and nuanced situation. From the study author:

“We see these big increases in fuel aridity across the Western forests” from 1984 to 2015, Dr. Abatzoglou tells the Monitor in a phone interview. “But what we find is about half, only half, not all of it, but about half of it, is attributable to the human-caused climate change.”

That means that other factors, like natural variability, have compounded with climate change to result in longer fire seasons, larger individual fires, and a ninefold increase in the area burnt over the past 30 years.

Another factor could be the amount of dry, unburned wood that has built up over decades of efforts to suppress wildfires, suggests Abatzoglou. So one solution going forward could be to allow controlled fires to burn off that tinder when conditions are wetter. “We do see a really strong coupling between climate change and forest fire in the Western United States,” he says, but “I think there may be ways to weaken that relationship” – by minimizing fuel for these massive wildfires.

h/t to Junk Science

h/t Junk Science

Case Study: Fort McMurray

That PNAS analysis is built upon climate models. On the ground, specific events show more clearly how human and natural fac tors contribute to a forest fires, and it is not so obviously linked to rising CO2.  Blair King writes about Fort McMurray at Huffington Post (here):

We Can’t Blame Climate Change For The Fort McMurray Fires

So what actually caused the fire to be so severe? Well it appears to be a combination of the effects of El Nino and historic forest management decisions. To explain: after the Slave Lake fire in 2011 the Alberta Government sought advice on the fire situation. The result was the Flat Top Complex Wildfire Review Committee Report which made a number of recommendations and concluded:

Before major wildfire suppression programs, boreal forests historically burned on an average cycle ranging from 50 to 200 years as a result of lightning and human-caused wildfires. Wildfire suppression has significantly reduced the area burned in Alberta’s boreal forests. However, due to reduced wildfire activity, forests of Alberta are aging, which ultimately changes ecosystems and is beginning to increase the risk of large and potentially costly catastrophic wildfires.

Essentially the report acknowledged that the trees surrounding Fort McMurray are hard-wired for fire and if they are not managed properly then these types of catastrophic fires will become more common. The warm weather may have accelerated the fires season, but the stage was set for such a fire and not enough work was done to avoid it.

The Haines Index

No matter how a fire ignites, a forest fire becomes dangerous because of the weather conditions allowing it to start and to grow.  The potential for forest fires is often indicated by the Haines Index (HI) that has been widely used for operational fire-weather forecasts in regions of the United States, Canada, and Australia. Several studies have shown a positive correlation between HI and observed fire activity.

An important study (here) demonstrates HI is strongly linked to ocean oscillation events such as El Nino.

The Interannual Variability of the Haines Index over North America

The Haines index (HI) is a fire-weather index that is widely used as an indicator of the potential for dry, lowstatic-stability air in the lower atmosphere to contribute to erratic fire behavior or large fire growth. This study examines the interannual variability of HI over North America and its relationship to indicators of large-scale circulation anomalies. The results show that the first three HI empirical orthogonal function modes are related respectively to El Nino–Southern Oscillation (ENSO), the Arctic Oscillation (AO), and the interdecadal sea ~ surface temperature variation over the tropical Pacific Ocean. During the negative ENSO phase, an anomalous ridge (trough) is evident over the western (eastern) United States, with warm/dry weather and more days with high HI values in the western and southeastern United States. During the negative phase of the AO, an anomalous trough is found over the western United States, with wet/cool weather and fewer days with high HI, while an anomalous ridge occurs over the southern United States–northern Mexico, with an increase in the number of days with high HI. After the early 1990s, the subtropical high over the eastern Pacific Ocean and the Bermuda high were strengthened by a wave train that was excited over the tropical western Pacific Ocean and resulted in warm/dry conditions over the southwestern United States and western Mexico and wet weather in the southeastern United States. The above conditions are reversed during the positive phase of ENSO and AO and before the early 1990s.

Forests Benefit from More CO2 and Milder Temperatures

A previous post (here) provided links to studies showing how US and other forests have generally become more healthy and resilient over recent decades.  For example:

There is strong evidence from the United States and globally that forest growth has been increasing over recent decades to the past 100+ years. Future prospects for forests are not clear because different models produce divergent forecasts. However, forest growth models that incorporate more realistic physiological responses to rising CO2 are more likely to show future enhanced growth. Overall, our review suggests that United States forest health has improved over recent decades and is not likely to be impaired in at least the next few decades.

Figure 9--Subregional Timber Supply Model projections of total hardwood and softwood removals volumes, in billion cubic feet (bcf), by private owners (where NIPF stands for nonindustrial private forest land), 1999 to 2040, under the base scenario. USDA South Region

Figure 9–Subregional Timber Supply Model projections of total hardwood and softwood removals volumes, in billion cubic feet (bcf), by private owners (where NIPF stands for nonindustrial private forest land), 1999 to 2040, under the base scenario. USDA South Region

As well, the outlook for timber production is optimistic  (here):

Although models suggest that global timber productivity will likely increase with climate change, regional production will exhibit large variability, as illustrated in Table 1. In boreal regions natural forests would migrate to the higher latitudes. Countries affected would likely include Russia and Canada. Warming could be accompanied by increased forest management in northern parts of some of these countries, particularly the Nordic countries, as increased tree growth rates are experienced. Climate change will also substantially impact other services, such as seed availability, nuts, berries, hunting, resins, and plants used in pharmaceutical and botanical medicine and the cosmetics industry, and these impacts will also be highly diverse and regionalized.

Another factor to consider is the effects of impacts other than climate change such as land-use change and tree plantation establishment. In many regions, these effects may be more important than the direct impact of climate. Indeed, over the past half-century industrial wood production has been increasingly shifting from native forests to planted forests. (my bold)

Summary

Again we see jumping to a conclusion to get a simple (simplistic) reduction of a complex reality. In legal terms, blaming forest fires on CO2 is a rush to judgment. Yes, forests are affected by more CO2 and milder temperatures. They grow stronger and more resilient to all kinds of threats, including forest fires. The incidence of forest fires is associated strongly with drier conditions resulting from ocean oscillations and accompanying atmospheric circulations. Humans play a role in land usage, timber management and fire suppression policies.

See link for more on playing Climate Whack-a-mole

Postscript:

I am proud of making a post title composed entirely of F-words.  Apologies for any problems caused to stutterers.  Old joke about the fate of a stutterer during an Air Force parachute training exercise.  All the chutes of the trainees opened, except for one man who kept falling past the others.  He was overheard saying:  “Th-th-th-th-thr-three, Fa-fa-fa-fa-fou-four, Fi-fi- . . .”

Hammer and Nail

This is a reblog of a post from dedicated environmentalist Michael Lewis which I am happy to put here following his comments. He does not agree with me on some matters and thinks I am too hard on environmental activists, ascribing nefarious motives that they do not have, in his opinion and experience.

At the same time, we seem to share a view that the Global Warming bandwagon is detrimental to the environment by diverting time, effort and resources to fight an imaginary problem, while real and serious environmental and social degradations and threats are not adequately addressed.

I appreciate his position particularly because it discredits the lie that global warming skeptics are all uncaring capitalists and big oil shills. I especially like the quote from Maslow, whose hierarchy of human needs contributed much to organizational sociology and motivational management. In the interest of singing from the same hymnbook, here is Between the Hammer and Nail from Michael Lewis.

Yes, I know everyone has jumped aboard the Global Warming bandwagon, hammered together the climate change apartment house and moved in lock stock and barrel to the CO2-causes-Climate-Change studio apartment. It’s a shame that such a ramshackle edifice dominates the climate science skyline.

“If all you have is a hammer, everything looks like a nail.” Abraham Maslow, The Psychology of Science, 1966

Part One

Climate change has become the cause celebre of modern thought and action, the hammer employed to bang on almost everything else. Every Progressive cause from highway congestion to homelessness simply must be cast in the glare of Climate Change and/or Global Warming. Every organization from the United Nations to my local County Board of Supervisors is invested in the concept as the source of funding for addressing all social ills.

The basis for this totalitarian acceptance of human caused climate change, aka Anthropogenic Global Warming (AGW) is the theory of radiative forcing of atmospheric warming, the so-called Greenhouse Effect. As we’ll see later, this is an instance of an attempt to prove an experiment by invoking a theory, rather than the accepted scientific process of proving a theory by experimentation and hypothesis testing.

Carbon dioxide radiative forcing was first proposed by Joseph Fourier in 1824, demonstrated by experiment by John Tyndall in 1859, and quantified by Svante Arrhenius in 1896. The unfortunate and inaccurate descriptor “Greenhouse Effect” was first employed by Nils Gustaf Ekholm in 1901.

The basic premise of the “Greenhouse Gas” theory is that greenhouse gases raise the temperature at the surface of the Earth higher than it would be without them (+33º C). Without these gases in the atmosphere (water vapor (0 to 4%), Carbon dioxide (0.0402%), Methane (0.000179%), Nitrous oxide (0.0000325%) and Fluorinated gases (0.000007%) life on this planet would be impossible.

This basic theory is deployed to buttress the assumptions that increased atmospheric greenhouse gas concentrations (mainly CO2) cause increased global average surface temperature, and, therefore lowering atmospheric CO2 concentrations will reduce or even reverse increases in global average surface temperature.

Let’s look at the observations and assumptions that have led to this erroneous conclusion.

Observations and Assumptions

  1. Observation – Humans produce greenhouse gases through industrial activity, agriculture and respiration, increasing the atmospheric concentration of CO2 from ~300 ppmv to ~400 ppmv over the past 58 years
  2. Observation – The calculated measure of global average surface temperature has increased by about 0.8° Celsius (1.4° Fahrenheit) since 1880.
  3. Assumption – Adding more CO2 to the atmosphere causes an increase in global average surface temperature.
  4. Assumption – Increase in global average surface temperature will cause changes in global climates that will be catastrophic for all life on Earth.
  5. Conclusion – Therefore, reducing human CO2 production will result in a reduction in atmospheric CO2 concentration and a consequent reduction in increase of global average surface temperature, stabilizing global climates and preventing catastrophic climate change.

Items 1 and 2 are observations with which few climate scientists disagree, though there may be quibbles about the details. CO2 and temperature have both increased, since at least 1850.  Items 3 and 4 are assumptions because there is no evidence to support them. The correlation between global average surface temperature and atmospheric CO2 concentration is not linear and it is not causal. In fact, deep glacial ice cores record that historical increases in CO2 concentration have lagged behind temperature rise by 200 to 800 years, suggesting that, if anything, atmospheric CO2 increase is caused by increase in global average surface temperature.

Nevertheless, the “consensus” pursued by global warming acolytes is that Svante Arrhenius’ 1896 “Greenhouse Gas” theory proves that rising CO2 causes rising temperature.

However, in the scientific method, we do not employ a theory to prove an experiment. Since we have only one coupled ocean/atmosphere system to observe, the experiment in this case is the Earth itself, human CO2 production, naturally occurring climate variation, and observed changes in atmospheric CO2 and global average surface temperature. There is no control with which to compare observations, thus we can make no scientifically valid conclusions as to causation. If we had a second, identical planet earth to compare atmospheric changes in the absence of human produced CO2, we would be able to reach valid conclusions about the role of CO2 in observed climate variation, and we would have an opportunity to weigh other causes of climate variation shared by the two systems.

To escape from our precarious position between the hammer and the nail, we should understand all possible causal factors, human caused, naturally occurring, from within and from without the biosphere in which all life lives.

Based on our current cosmology, it is my conclusion that we live in a chaotic, nonlinear, complex coupled ocean/atmospheric adaptive system, with its own set of naturally occurring and human created cycles that interact to produce the climate variation we observe. This variation is not the simple linear relationship touted by the IPCC and repeated in apocalyptic tones by those who profit from its dissemination, but rather is a complex interplay of varying influences, that results in unpredictable climate variation.

More about chaos and complexity in the next installment.

IPCC thinks life is linear, but in fact it looks more cyclical.

Footnote:  Maslow’s Hierarchy of Human Needs

Could it be that climate activists are working on their own needs at the top two tiers, and want to impose their projects onto billions of people struggling with the most fundamental needs?

It’s not Hotter, it’s Milder.

Again this week I got an email from a friend linking to an alarmist website claiming (among other things) 2015 the Hottest Year Ever, August 2016 the Hottest Month Ever, 16 Hottest Months in a row, The Earth is Burning!

My reply:
Calm down and breathe through your nose. Be not afraid.
You have been misinformed, and I will tell you how and why.

1. “Hotter” does not describe a long period when daily highs are falling, not rising. That’s right, generally the temperature records are showing a decline over time in the maximums recorded at the weather stations.

For example look at results from USHCN (US Historical Climate Network) for the trend of daily maximums since 1930.

Source: Tony Heller, Real Climate Science

It is clear that measurements of actual afternoon highs are trending down in most places, and lower much more strongly than the few increases.  Below the same results displayed geographically.


2. Temperature averages over decades show great climate stability, not change. The calculated trends are in fractions of a degree Celsius, well within the error range of the instruments.

Alarmists favor the dataset from GISS, a part of NASA. They fabricate estimates of an hypothetical Global Mean Temperature not from satellites, but by taking weather station records and performing various statistical manipulations, including adjusting, deleting, infilling, gridding, weighting, homogenizing, and averaging.

Out of all that processing they produce estimates of annual GMTs, which can not be attributed to any actual observation. More importantly, the dataset is unstable–past history, for example the 1930s, appears in GISS graphs with different values this year than last, and different again from 5 and 10 years ago. As Dr. Ole Humlum commented: A temperature record which keeps on changing the past hardly can qualify as being correct.

Below is shown GISS estimates in the context of human experience of daily and seasonal temperature variability.

3. The planet has a vast array of climates, each of which has it’s own experience of changing weather and longer term patterns. That is evident in the first chart above. It is also the case that generally as daily highs have been falling, daily lows (minimums) have been rising more strongly, resulting in slightly increasing daily averages. That is the basis for claiming hottest years and months.

This phenomenon is widespread around the world, as demonstrated by studies reported here at this blog under the category Temperature Trend Analysis. For example, Analyzing Temperature Change using World Class Stations.

In addition, 70% of the GISS surface temperatures are from SSTs (sea surface temperatures), meaning that ocean cycles like El Nino dominate the results. Short-term variations recently derive from changes in the Pacific basin, the largest of the world’s oceans.

Because climates are local and plural, any general statement about warming or cooling does not necessarily apply to the place where you live.

Summary

The next time you read or are told the world is getting hotter, you should respond along these lines.

“You have been misinformed. It is not getting hotter, it has become milder. The temperature records show fewer extremes of highs and lows, milder Winters, earlier Springs and later Autumns. The longer growing seasons are producing bumper crops almost every year.

Instead of complaining about hotter weather, we should enjoy the bounty of harvests Nature is providing to us.”


The 2016 harvest is shaping up to be a whopper, according to Western Canada’s largest elevator companies.

The 2016 harvest is shaping up to be a whopper, according to Western Canada’s largest elevator companies.

Footnote:

Another post Arctic Warming Unalarming reports on in depth analysis of 118 weather stations around the Arctic Circle, where so-called “Arctic amplification” should be evident.  The conclusions:

The Arctic has warmed at the same rate as Europe over the past two centuries. . . The warming has not occurred at a steady rate. . .During the 1900s, all four (Arctic) regions experienced increasing temperatures until about 1940. Temperatures then decreased by about 1 °C over the next 50 years until rising in the 1990s.

For the period 1820–2014, the trends for the January, July and annual temperatures are 1.0, 0.0 and 0.7 °C per century, respectively. . . Much of the warming trends found during 1820 to 2014 occurred in the late 1990s, and the data show temperatures leveled off after 2000. (my bold).

So, consistent with statements above: No increase in July temperatures, some warming overall due mostly to January.