Basics of Ocean Acidification
Updates added below June 20 and 24, 2015
Update below July 2, 2015: Ocean pH is actually trending alkaline
Update below September 15, 2015: Extensive discussion of ocean chemistry
If surface temperatures don’t skyrocket soon, expect to hear a lot in the coming months about “ocean acidification.” This sounds scary, and that is the point of emphasizing it in the runup to Paris COP.

So here’s the basic chemistry of CO2 and H20:

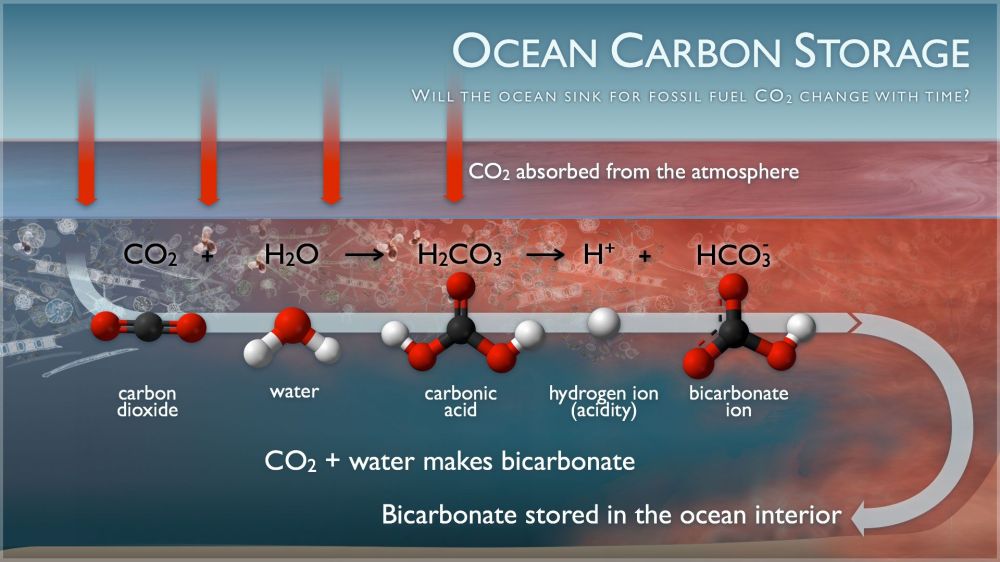
That seems straight forward, So what is the problem?

That looks fairly serious. So what does the IPCC have to say about this issue?

What does it say in the SPM (Summary for Policy Makers)?

For this issue, I looked at the topic of ocean acidification and fish productivity. The SPM asserts on Page 17 that fish habitats and production will fall and that ocean acidification threatens marine ecosystems.
“Open-ocean net primary production is projected to redistribute and, by 2100, fall globally under all RCP scenarios. Climate change adds to the threats of over-fishing and other non-climatic stressors, thus complicating marine management regimes (high confidence).” Pg 17 SPM
“For medium- to high-emission scenarios (RCP4.5, 6.0, and 8.5), ocean acidification poses substantial risks to marine ecosystems, especially polar ecosystems and coral reefs, associated with impacts on the physiology, behavior, and population dynamics of individual species from phytoplankton to animals (medium to high confidence).” Pg 17 SPM
So, the IPCC agrees that ocean acidification is a serious problem due to rising CO2 emissions from burning fossil fuels.
What does it say in the Working Group Reports?
But wait a minute. Let’s see what is in the working group reports that are written by scientists, not politicians.
WGII Report, Chapter 6 covers Ocean Systems. There we find a different story with more nuance and objectivity:
“Few field observations conducted in the last decade demonstrate biotic responses attributable to anthropogenic ocean acidification” pg 4
“Due to contradictory observations there is currently uncertainty about the future trends of major upwelling systems and how their drivers (enhanced productivity, acidification, and hypoxia) will shape ecosystem characteristics (low confidence).” Pg 5
“Both acclimatization and adaptation will shift sensitivity thresholds but the capacity and limits of species to acclimatize or adapt remain largely unknown” Pg 23
“Production, growth, and recruitment of most but not all non-calcifying
seaweeds also increased at CO2 levels from 700 to 900 µatm Pg 25
“Contributions of anthropogenic ocean acidification to climate-induced alterations in the field have rarely been established and are limited to observations in individual species” Pg. 27
“To date, very few ecosystem-level changes in the field have been attributed to anthropogenic or local ocean acidification.” Pg 39

Ocean Chemistry on the Record
Contrast the IPCC headlines with the the Senate Testimony of John T. Everett, in which he said:
“There is no reliable observational evidence of negative trends that can be traced definitively to lowered pH of the water. . . Papers that herald findings that show negative impacts need to be dismissed if they used acids rather than CO2 to reduce alkalinity, if they simulated CO2 values beyond triple those of today, while not reporting results at concentrations of half, present, double and triple, or as pointed out in several studies, they did not investigate adaptations over many generations.”
“In the oceans, major climate warming and cooling and pH (ocean pH about 8.1) changes are a fact of life, whether it is over a few years as in an El Niño, over decades as in the Pacific Decadal Oscillation or the North Atlantic Oscillation, or over a few hours as a burst of upwelling (pH about 7.59-7.8) appears or a storm brings acidic rainwater (pH about 4-6) into an estuary.”
http://www.epw.senate.gov/public/index.cfm?FuseAction=Files.View&FileStore_id=db302137-13f6-40cc-8968-3c9aac133b16
Many organisms benefit from less alkaline water.
(Added in thanks to David A.’s comment below)
In addition, IPCC has ignored extensive research showing positive impacts on marine life from lower pH. These studies are catalogued at CO2 Science with this summary:
There are numerous observations of improvement in calcification of disparate marine life in realistic rates of PH change due to increased CO2.
“In the final graphical representations of the information contained in our Ocean Acidification Database, we have plotted the averages of all responses to seawater acidification (produced by additions of both HCl and CO2) for all five of the life characteristics of the various marine organisms that we have analyzed over the five pH reduction ranges that we discuss in our Description of the Ocean Acidification Database Tables, which pH ranges we illustrate in the figure below.”
“The most striking feature of Figure 11 is the great preponderance of data located in positive territory, which suggests that, on the whole, marine organisms likely will not be harmed to any significant degree by the expected decline in oceanic pH. If anything, in fact, the results suggest that the world’s marine life may actually slightly benefit from the pH decline, which latter possibility is further borne out by the scatter plot of all the experimental data pertaining to all life characteristic categories over the same pH decline range, as shown below in Figure 12.”
At PH decline from control of .125, calcification, metabolism, fertility, growth and survival all moved into positive territory.
http://www.co2science.org/data/acidification/acidification.php
Summary
The oceans are buffered by extensive mineral deposits and will never become acidic. Marine life is well-adapted to the fluctuations in pH that occur all the time.
This is another example of climate fear-mongering: It never happened before, it’s not happening now, but it surely will happen if we don’t DO SOMETHING!.
Conclusion
Many know of the Latin phrase “caveat emptor,” meaning “Let the buyer beware”.
When it comes to climate science, remember also “caveat lector”–”Let the reader beware”.

Update added June 20, 2015
For additional commentary on ocean acidification:
Update added June 24, 2015
Patrick Moore also provides a thorough debunking here:
“It is a fact that people who have saltwater aquariums sometimes add CO2 to the water in order to increase coral growth and to increase plant growth. The truth is CO2 is the most important food for all life on Earth, including marine life. It is the main food for photosynthetic plankton (algae), which in turn is the food for the entire food chain in the sea.”
Update added July 2, 2015
Scientists have had pH meters and measurements of the oceans for one hundred years. But experts decided that computer simulations in 2014 were better at measuring the pH in 1910 than the pH meters were. The red line (below) is the models recreation of ocean pH. The blue stars are the data points — the empirical evidence.

What we have here is one of the basic foundations of the climate change scare, that is falling ocean pH levels with increased atmospheric CO2 content, being completely dismissed by the empirical ocean pH data the alarmist climate scientists didn’t want to show anyone because it contradicted their ‘increasing ocean acidity’ narrative.
http://joannenova.com.au/2015/01/oceans-not-acidifying-scientists-hid-80-years-of-ph-data/
Update added September 15, 2015
In summary, recent research publications are using a term (OA) that is technically incorrect, misleading, and pejorative; it could not be found in the oceanography literature before about 15 years ago. . .
The claim that the surface-water of the oceans has declined in pH from 8.2 to 8.1, since the industrial revolution, is based on sparse, contradictory evidence, at least some of which is problematic computer modeling. Some areas of the oceans, not subject to algal blooms or upwelling, may be experiencing slightly lower pH values than were common before the industrial revolution. However, forecasts for ‘average’ future pH values are likely exaggerated and of debatable consequences. The effects of alkaline buffering and stabilizing biological feedback loops seem to be underappreciated by those who carelessly throw around the inaccurate term “ocean acidification.”
http://wattsupwiththat.com/2015/09/15/are-the-oceans-becoming-more-acidic/


