Click on image to enlarge
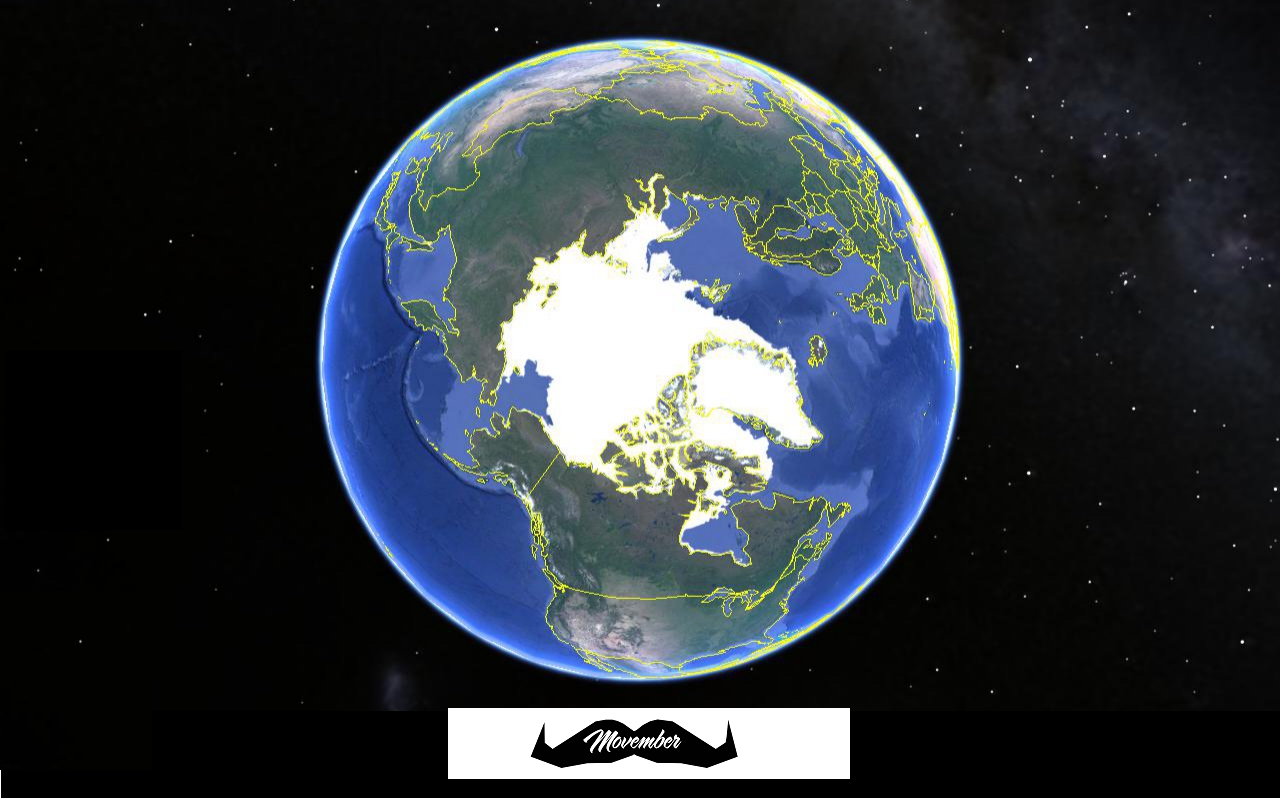
Arctic Ice Extents have roughly doubled since the Sept. minimum and are now up to 10M km2. The last 1/3 of maximum will take until March, principally because several basins are frozen over and cannot add coverage. To date, Beaufort and CAA (Canadian Archipelago) are full, as are Laptev and East Siberian on the Russian side. Kara is 3/4 covered and the Central Arctic wil add only 3% from here.
During the first half of November we can see at the bottom Beaufort and East Siberian filling in, leaving only Chukchi with open water. On the right, Both Baffin and Hudson bays are now growing more strongly. At the top Kara ice extent has reached 75% of its March maximum.
The graph compares extents over the first 17 days of November.
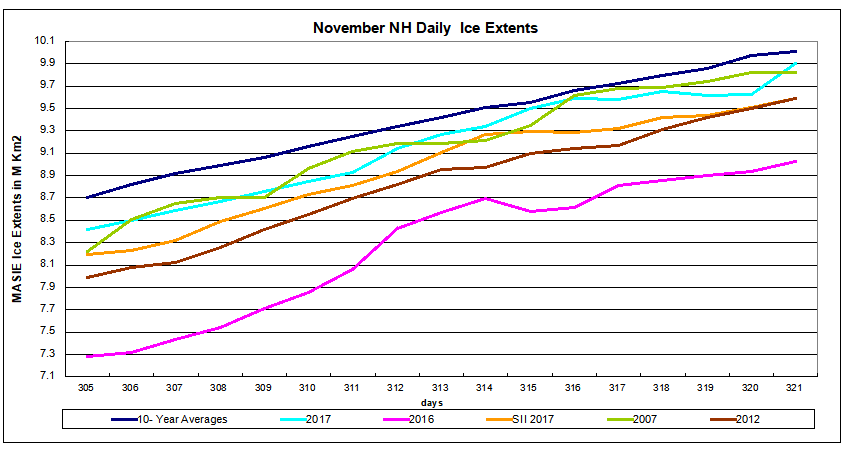
2017 has reached 9.9M km2, 2007 nearly the same, and both are close to the 10 year average of 10M km2. 2012 lags 300k km2 lower than 2017, while 2016 is 877k km2 behind. At this point MASIE and SII are tracking the 10-year average, with SII about 200k km2 lower.
The Table below shows where ice is located on day 321 in regions of the Arctic ocean. 10 year average comes from 2007 through 2016 inclusive.
| Region | 2017321 | Day 321 Average |
2017-Ave. | 2016304 | 2017-2016 |
| (0) Northern_Hemisphere | 9904268 | 10013895 | -109626 | 9026577 | 877691 |
| (1) Beaufort_Sea | 1052982 | 1067181 | -14199 | 1056304 | -3322 |
| (2) Chukchi_Sea | 449182 | 702958 | -253776 | 616755 | -167573 |
| (3) East_Siberian_Sea | 1076201 | 1077799 | -1598 | 1087137 | -10936 |
| (4) Laptev_Sea | 897845 | 897517 | 328 | 896732 | 1113 |
| (5) Kara_Sea | 696550 | 649727 | 46822 | 254492 | 442058 |
| (6) Barents_Sea | 68869 | 174077 | -105208 | 25907 | 42962 |
| (7) Greenland_Sea | 394494 | 499069 | -104575 | 390593 | 3901 |
| (8) Baffin_Bay_Gulf_of_St._Lawrence | 761453 | 552922 | 208531 | 524708 | 236745 |
| (9) Canadian_Archipelago | 852865 | 851728 | 1137 | 853180 | -315 |
| (10) Hudson_Bay | 460631 | 273706 | 186925 | 185679 | 274952 |
| (11) Central_Arctic | 3158068 | 3183076 | -25008 | 3077808 | 80260 |
The deficits to average are primarily in Chukchi, also Barents and Greenland Seas. Surpluses are large in Hudson and Baffin Bays, along with Kara Sea.

Footnote
Some people unhappy with the higher amounts of ice extent shown by MASIE continue to claim that Sea Ice Index is the only dataset that can be used. This is false in fact and in logic. Why should anyone accept that the highest quality picture of ice day to day has no shelf life, that one year’s charts can not be compared with another year? Researchers do this analysis, including Walt Meier in charge of Sea Ice Index. That said, I understand his interest in directing people to use his product rather than one he does not control. As I have said before:
MASIE is rigorous, reliable, serves as calibration for satellite products, and uses modern technologies to continue the long and honorable tradition of naval ice charting. More on this at my post Support MASIE Arctic Ice Dataset
Movember Foundation encourages growing mustaches in support of men’s health and fitness.

Reblogged this on Climate Collections.
LikeLike
Thanks for the update Ron. I have been following Arctic and Antarctic ice using NASA’s WorldView imagery, including the 7-2-1 and 3-6-7 MODIS band composites in combination with the GCOM-W1/AMSR2 12km ice analyses available there. I find it interesting to see the differences and the MODIS imagery often offers some high resolution peeks at the ice distribution when lack of clouds allows. I see a lot of day-to-day variation in these analyses. Here’s an example of the 3-6-7 Terra MODIS imagery combined with the GCOM 12 km ice concentration analysis in case you may not have seen these tools. The mouse roller will zoom in and out and the GCOM overlay can be toggled on and off using the overlay menu at the top right.
https://go.nasa.gov/2hLogFA
I’ve noticed on your MASIE animations that often there are static holes in the ice that don’t look realistic and are oddly bounded on the north side by a latitude parallel. I see three of these in the animation included with this post. One is between Greenland and Iceland and the other two are north of Siberia. I’m guessing they are some kind of analysis artifact, but I’m curious if you have heard what might be causing them.
LikeLike
Oops. Make that overlay menu at the top left.
LikeLike
I am also guessing that those are artifacts. I do not know how such are dealt with in calculating extents. I also assume that day to day fluctuations are partly due to difficulties observing anything in the Arctic.
Thanks for the link to NASA Worldview.
LikeLike