Click on image to enlarge.
Arctic Ice Extents have more than doubled since the Sept. minimum and are now up to 10.4M km2. The last 30% of maximum will take until March, principally because several basins are frozen over and cannot add coverage. To date, Beaufort and CAA (Canadian Archipelago) are full, as are Laptev and East Siberian on the Russian side. Kara is 88% covered and the Central Arctic will add only 2% from here.
In the last nine days of November we can see Chukchi at the top adding ice up to 50% of maximum with Beaufort and East Siberian already frozen. On the left, Baffin and especially Hudson bay are now growing more strongly. On the right is Kara filling in with Barents freezing more slowly.
The graph compares extents over the first 25 days of November.
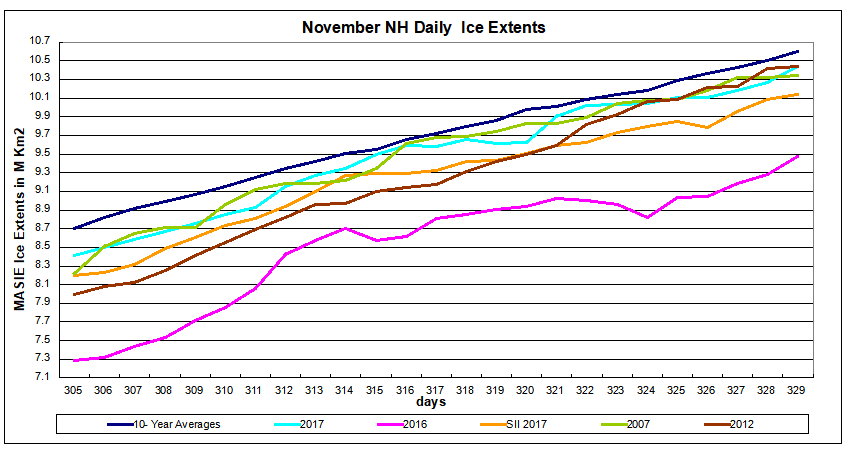
2017 has reached 10.4M km2, 2007 and 2012 nearly the same, and all are close to the 10 year average of 10.6M km2. 2016 is about 1M km2 behind. At this point MASIE and SII are both tracking the 10-year average, with SII about 200k km2 lower.

The Table below shows where ice is located on day 329 in regions of the Arctic ocean. 10 year average comes from 2007 through 2016 inclusive.
| Region | 2017329 | Day 329 Average |
2017-Ave. | 2016329 | 2017-2016 |
| (0) Northern_Hemisphere | 10438529 | 10596102 | -157573 | 9474596 | 963933 |
| (1) Beaufort_Sea | 1070410 | 1068478 | 1932 | 1070445 | -35 |
| (2) Chukchi_Sea | 516620 | 793296 | -276676 | 653560 | -136940 |
| (3) East_Siberian_Sea | 1065427 | 1082091 | -16665 | 1087137 | -21711 |
| (4) Laptev_Sea | 897845 | 897451 | 394 | 897211 | 634 |
| (5) Kara_Sea | 826360 | 732408 | 93952 | 328154 | 498207 |
| (6) Barents_Sea | 191448 | 209544 | -18096 | 31173 | 160275 |
| (7) Greenland_Sea | 414638 | 542031 | -127393 | 419401 | -4763 |
| (8) Baffin_Bay_Gulf_of_St._Lawrence | 701761 | 637760 | 64001 | 651237 | 50524 |
| (9) Canadian_Archipelago | 852553 | 851808 | 745 | 853180 | -628 |
| (10) Hudson_Bay | 632312 | 422809 | 209504 | 267718 | 364594 |
| (11) Central_Arctic | 3182452 | 3192004 | -9552 | 3082022 | 100430 |
The deficits to average are primarily in Chukchi and Greenland Seas. Surpluses are large in Hudson and Baffin Bays, along with Kara Sea. Compared to last year, Kara, Barents and Hudson Bay all have much greater ice extents.
Footnote
Some people unhappy with the higher amounts of ice extent shown by MASIE continue to claim that Sea Ice Index is the only dataset that can be used. This is false in fact and in logic. Why should anyone accept that the highest quality picture of ice day to day has no shelf life, that one year’s charts can not be compared with another year? Researchers do this analysis, including Walt Meier in charge of Sea Ice Index. That said, I understand his interest in directing people to use his product rather than one he does not control. As I have said before:
MASIE is rigorous, reliable, serves as calibration for satellite products, and uses modern technologies to continue the long and honorable tradition of naval ice charting. More on this at my post Support MASIE Arctic Ice Dataset
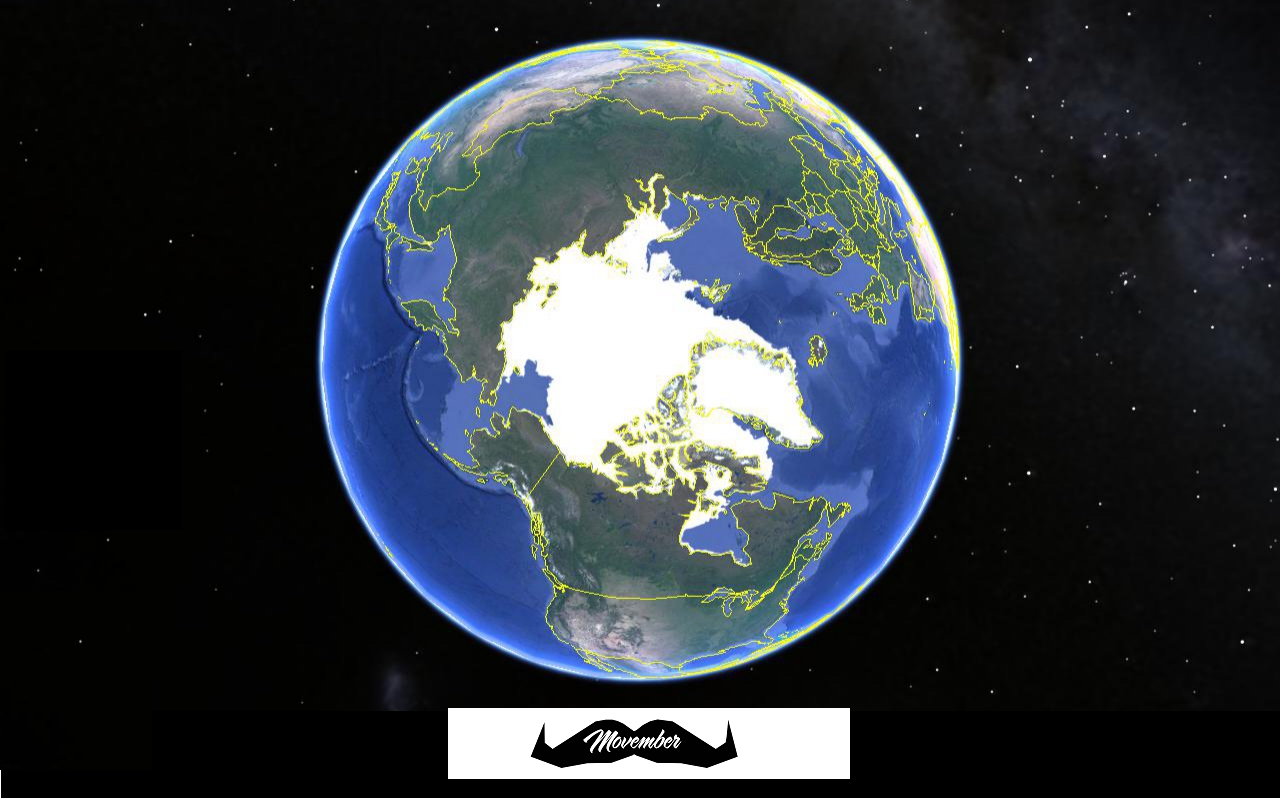
Movember Foundation encourages growing mustaches in support of men’s health and fitness.

In June this year on an overnight stop in the marina of the Dutch “harbour town”,Breskens, I encountered a seasoned veteran of the Arctic, a sailor who had just come back from somewhere in the far north. He certainly looked the part, all grizzled with a long, straggly white beard! We chatted for a while and he told me how much he was looking forward to heading a lot further north next year as there was going to be no ice there because, you know, global warming and all that. He was more than a little nonplussed when I boldly told him that the ice was no longer in a death spiral and that his sailing plans for next year would probably have to change.
LikeLike
Ron,
If the 2017-18 winter is going to be very cold, is there a chance that the ice will be so thick that the north-west passage does not open or the polar route along Siberia, remains closed?
LikeLike
Graeme, the Russians have a fleet of icebreakers and will ensure shipping in the NSR. The NWP closing would be unusual and significant if it happens next summer. Right now NWP is closed and has been blocked by ice since Sept. 14, 2017.
http://arcticnorthwestpassage.blogspot.in/2017/09/northwest-passage-route-7-closed-by-sea.html
LikeLike
Ron, fix the typo in “November”
LikeLike
Not to worry, Movember is a word, as explained at the end, though it is a guy thing.
LikeLike
Thanks for the update.
Due to my laziness I use conglomerate sites like WUWT and Neven’s blog for graphs of action but both are sadly difficult to use due to updating problems. I can find the Maisie site on one of them after a few clicks.
Activity has been very slow at the latter site these last 2 months commensurate with the return of PIOMAS to a higher level and Jim has given up blogging as well. We need a new melt to keep them happy.
LikeLike
MOVEMBER is very OK if it means
“MOVE-EVER”; with regard to
forwarding climatic change matters:
all the best ab from Cyprus
LikeLike
Reblogged this on Climate Collections.
LikeLike