Click on image to enlarge.
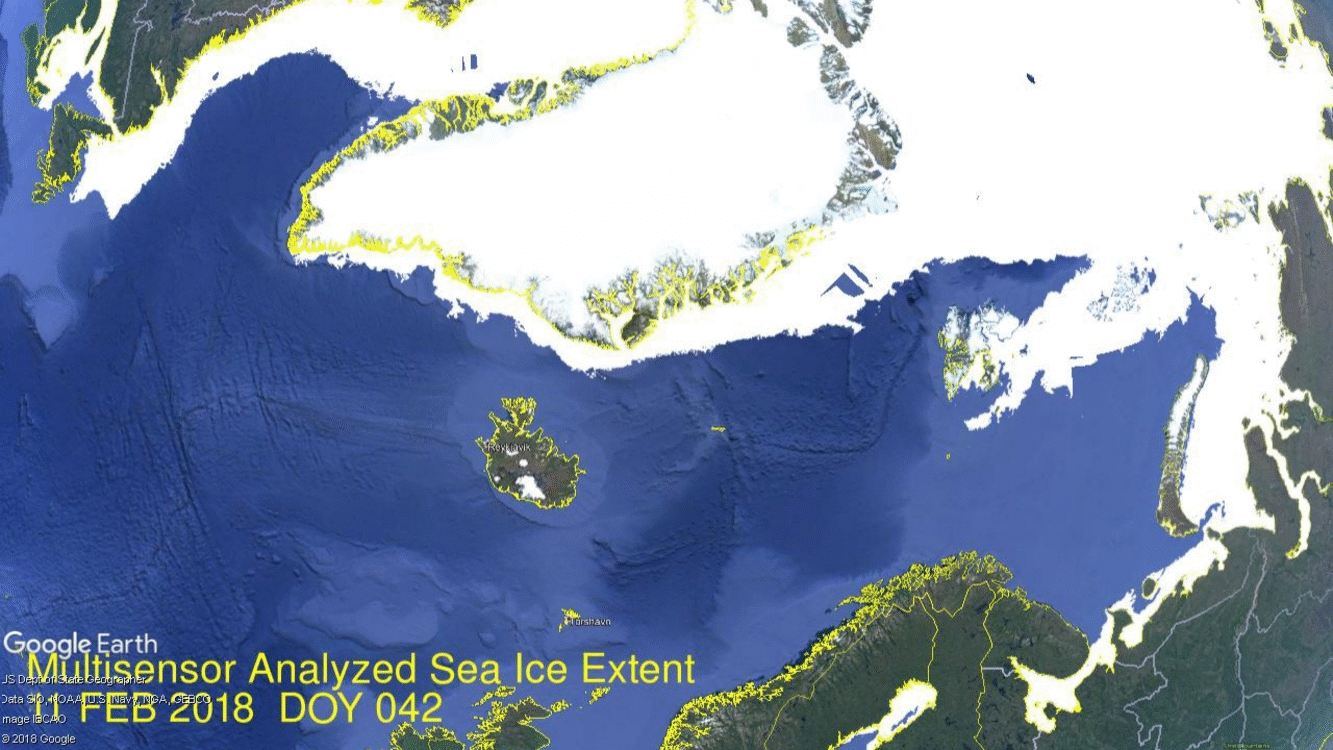
Under the influence of a split vortex in February, Arctic ice is also a bit bi-polar. Above image shows the Atlantic side the last two weeks. Barents on the right has grown back to reach the 11 year average, while on the upper left Baffin Bay is above average reaching down to Newfoundland and filling in the Gulf of St. Lawrence.
Click on image to enlarge.
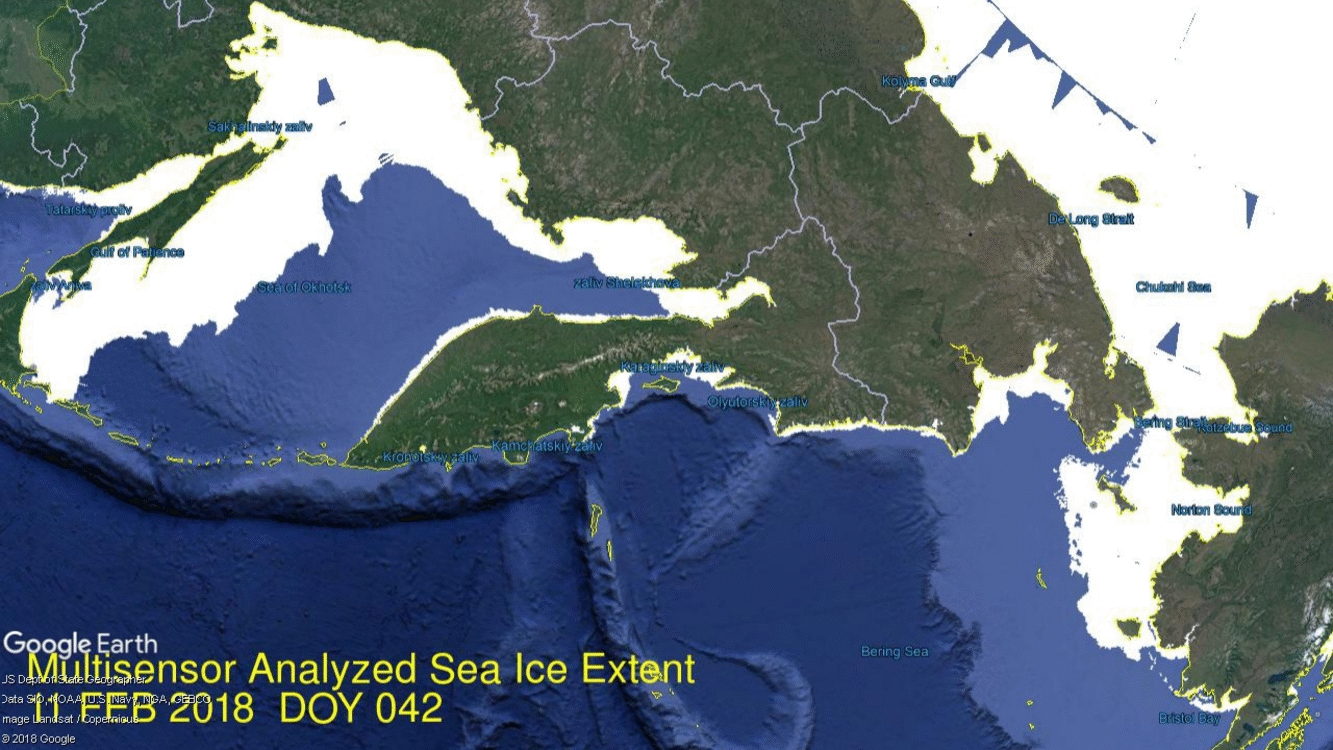
Meanwhile, the ridge of high pressure over Alaska resulted in Bering on the right losing ice while Okhotsk on the left gained up to last year’s maximum.
Ice extents for February appear in the graph below; 11 year average is 2007 to 2017 inclusive.
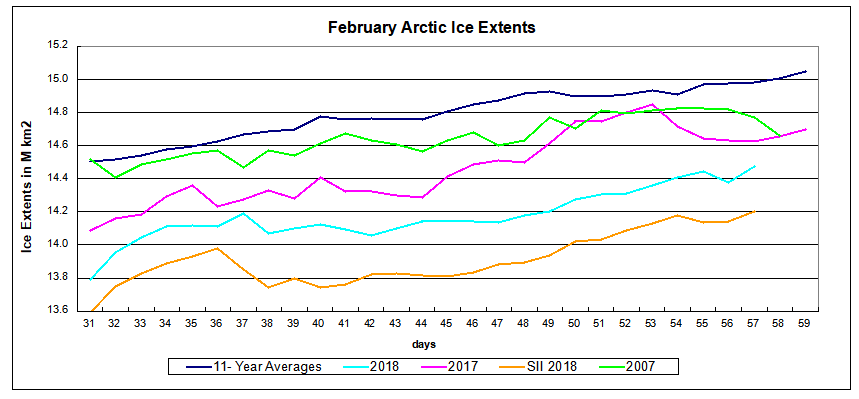 Note that ice growth slows down in February since the Arctic core is frozen and extent can only be added at the margins. MASIE shows 2018 is drawing close to 2007 and 2017, while SII is running about 200k km2 less. The 11 year average reached 15M km2 while this year is ~500k km2 lower at day 57.
Below is the analysis of regions on day 057. Average is for 2007 to 2017 inclusive.
| Region | 2018057 | Day 057 Average |
2018-Ave. | 2017057 | 2018-2017 |
| (0) Northern_Hemisphere | 14471633 | 14982823 | -511189 | 14624988 | -153354 |
| (1) Beaufort_Sea | 1070445 | 1070178 | 267 | 1070445 | 0 |
| (2) Chukchi_Sea | 962774 | 965725 | -2951 | 966006 | -3232 |
| (3) East_Siberian_Sea | 1087120 | 1087134 | -14 | 1087137 | -18 |
| (4) Laptev_Sea | 897845 | 897842 | 3 | 897845 | 0 |
| (5) Kara_Sea | 928561 | 922491 | 6070 | 933003 | -4442 |
| (6) Barents_Sea | 599940 | 618000 | -18061 | 535489 | 64451 |
| (7) Greenland_Sea | 405456 | 639713 | -234257 | 621708 | -216252 |
| (8) Baffin_Bay_Gulf_of_St._Lawrence | 1823426 | 1492225 | 331201 | 1490888 | 332538 |
| (9) Canadian_Archipelago | 853109 | 852670 | 439 | 853214 | -106 |
| (10) Hudson_Bay | 1260838 | 1260663 | 175 | 1260903 | -66 |
| (11) Central_Arctic | 3076082 | 3222907 | -146825 | 3217927 | -141845 |
| (12) Bering_Sea | 283579 | 737222 | -453642 | 577660 | -294081 |
| (13) Baltic_Sea | 130666 | 116020 | 14646 | 64843 | 65822 |
| (14) Sea_of_Okhotsk | 1063381 | 1049659 | 13722 | 991862 | 71519 |
The 2018 deficit to average is almost entirely due to the shortfall in Bering Sea. Barents, Chukchi and Okhotsk are all about average. A large surplus in Baffin Bay/Gulf of St. Lawrence offsets smaller deficits in Central Arctic and Greenland Sea.
The annual maximum usually occurs mid March. 2018 is now 2% below last year’s max and needs 3.5% more extent to reach 15M km2.
Here’s your Valentine’s Day Greeting:

And here’s your PC candy for Valentine’s Day.


Reblogged this on Climate Collections.
LikeLike