Live and Let Live, It’s the American Way

People are fed up with political correctness and walking on eggs because differences are now socially disturbing (micro-aggressions anyone?). The progressive war on individual diversity in the name of “social Justice” strikes at the heart of modern democratic society and free enterprise. James I. Wallner writes at Law and Liberty Make America Diverse Again. Excerpts in italics with my bolds.

E Pluribus Unum. Out of many, one. The motto, emblazoned on one side of the Great Seal of the United States, succinctly captures the dual nature of the American founding. With just thirteen letters, it invokes both the revolutionary act by which thirteen separate colonies declared their independence from Great Britain and the subsequent decision of the new states to join together to form one nation. Foreshadowing the unprecedented success of the American experiment in self-government, Novus Ordo Seclorum (new order of the ages), is inscribed on the seal’s opposite side. The two inscriptions serve as a reminder that in the United States, for the first time in human history, free citizens call the shots instead of their rulers.

Cracking the Code of Freedom

Of course, Americans are not the first people to establish a government on the idea of political equality. That distinction belongs to Athenians who, in the fifth century BCE, used the terms isonomia (equality of law) and isegoria (equality of speech) to distinguish their unique form of self-government from neighboring Greek tyrannies, as well as from Persian despotism. Among the Athenians, isokratia (equality of power) prevailed when no citizen was considered to be above the law, and all took part in making it.

Yet the idea of political equality proved challenging to sustain in practice. The Athenians soon realized that they could not secure sufficient space for politics on a permanent basis amidst the frustrations and uncertainty inherent in collective decision-making under conditions of equality. For that reason, their experiment in self-government ended in failure, as would all those that came after until the American founding.

What makes America exceptional is that its people alone broke free of the destructive cycle in which a people seeking freedom would overthrow their tyrant and establish self-government, only to find themselves inevitably succumbing to a new tyranny. Americans were able to do so because they grasped the relationship between freedom and equality on the one hand and space and diversity on the other. The genius of the Constitution should thus be understood as creating a space in which a diverse multitude could rule as one; where free citizens (or their representatives) could gather to resolve their differences based on equality. In contrast to the Athenians’ direct democracy, the Constitution secured that space against encroachments by would-be tyrants by harnessing the conflict in a diverse republic and infusing it into institutional structures like bicameralism, separation of powers, and federalism.

The Triumph of Ideology

Regrettably, this understanding of American exceptionalism is overlooked in today’s political discourse. On both the left and the right, there is a worrisome tendency to gloss over the vital role played by diversity and the conflict it generates.

Both have a tendency to subsume individual difference to demographic categories, in the case of liberals, or abstract ideas, in the case of conservatives.

Yet individual difference, regardless of its source, is the very basis of equality and freedom. Whereas the founders understood politics as an activity in which citizens participate alongside their peers to make collective decisions, today’s liberals and conservatives think of it primarily as the process by which one group can impose its particular standard of truth on those with whom its members disagree. When that happens, citizens are neither equal nor free. That is, they are not allowed to participate in the debate over what particular standard of truth is imposed on the public sphere. Political discourse is transformed into a process whereby combatants delegitimize their opponents on the grounds that they disagree with their standard of the truth.

For example, consider the debate over multiculturalism, or identity politics. The president of the Claremont Institute, Ryan Williams, recently proclaimed multiculturalism to be an “existential threat to the American political order.” According to Williams, the concept is incompatible with political equality and that, if left unchecked, will lead ultimately to the balkanization of America, thus reversing the motto—E uno plura. Out of one, many.

However, to the extent that multiculturalism threatens the American political order, it is only because it destroys the space needed for American self-government to work. It declares entire groups of citizens unfit for politics based on the color of their skin or the nature of their beliefs. Williams rightly points out that so-called multiculturalists are more concerned with denying people with different views or backgrounds that ability to participate in politics than they are with genuine diversity. With its universalizing tendencies, multiculturalism thus ironically eradicates the diversity that makes political equality possible in the first place. In other words, the threat to equality arises out of the “ism” part of multiculturalism, not the “multicultural” part. In that way, multiculturalism is un-American because it is a rigid ideology that does not tolerate dissent from its worldview.

It is the universal and abstract nature of multiculturalism that makes it inconsistent with the very idea of political equality. Free citizens (the many) need a shared space in which they can make decisions affecting the community (the one) because they are all equal. They are equal because they are all different. No two citizens can be considered to be identical in any respect other than the fact that they are both unique individuals who possess distinct abilities, characteristics, interests, and passions, and, in the United States, they both possess the same right to participate in politics. This is what makes self-government possible: the equal participation of different individuals in politics inevitably generates conflict between them in the space where politics occurs. That conflict, in turn, prevents any one person or group of people from amassing the power needed to destroy that space and rule others.

Given this, the case against multiculturalism rests entirely on the ideological threat it poses to American diversity. If the critics of multiculturalism fail to make this point explicit, they leave open the possibility that their opposition to the ideology is due not to the fact that it lacks a standard against which the American regime can be evaluated but because it proposes the wrong standard. In doing so, they wind up declaring entire groups of citizens unfit for politics based on their particular conception of what it means to be an American.

Replacing one ideology with another does nothing to mitigate the threat of ideology. It makes no difference whether the ideology is based on an appeal to overcome a racist past, in the case of some multiculturalists, or to abstract natural rights, in the case of some conservatives. What matters is that the standard of truth that these multiculturalists and conservatives claim to be self-evident is derived by them from a space outside of the actual experience of politics. Its applications to activity inside the public sphere transforms free citizens into cogs in a production process geared towards the realization of a master design. In the process, both freedom and equality are destroyed.

Understanding Politics in Terms of Conflict

This does not mean that there is no truth. The point is that, in America, the standards against which political action is measured can only be defined by a process that is itself characterized by political equality. When politics is no longer understood in these terms, it is no longer an activity in which free citizens call the shots instead of their rulers. The unambiguous lesson of the past is that freedom and equality cannot last long in the absence of diversity and conflict.

Unity grounded in anything other than difference is tyranny.

To sustain the idea of political equality, we must understand American exceptionalism not in universal and abstract terms but rather as something that arises out of a particular kind of practice. In other words, it is the essential activity of being an American that defines who Americans are as a people. It is that which allows them to deliberate on and fight over the truths that they hold to be self-evident.

That is the only way we can ensure that E pluribus unum will last long enough to constitute a novus ordo seclorum.

Is Climate Catastrophe the Lie Whose Time Has Come?

“If you tell a lie big enough and keep repeating it, people will eventually come to believe it. The lie can be maintained only for such time as the State can shield the people from the political, economic and/or military consequences of the lie. It thus becomes vitally important for the State to use all of its powers to repress dissent, for the truth is the mortal enemy of the lie, and thus by extension, the truth is the greatest enemy of the State.” — Joseph Goebbels

The US election cycle is heating up, while the Brexit melodrama is morphing into “Zero Carbon, Please.”  Kids are in the streets on Fridays or suing the government in courts.  Oil Companies are under pressure to commit Hari-Kari by those proposing that wind and solar power be ramped up from 2% of global energy supply to 89% in 12 years.  Can the herd grow any madder than this?

A recent CNN poll of Democrats had 96% saying any presidential nominee has to promise aggressive action to slow climate change, numbers right up there with Mom and apple pie.  And they demand candidates have a whole debate dedicated to climate change so the dozen or so pols can be checked for sincerity.

Progressives certainly think the issue is a winner for them because most Americans agree with them.  But do they really?  How reliable are these polls?  One that is frequently mentioned in support of climate belief by the masses is dissected below so you can draw your own conclusions.

Climate Change Is a State of Mind

A recent survey by Yale and George Mason activists is another reminder that “climate change” is actually a branch of environmental psychology. Consider that “climate” is an human construct, defined as the pattern of weather we remember in our living space over seasons and years. And “climate change” is therefore an added belief that our expectations about future weather are uncertain and unreliable. And so, attitude surveys are a suitable way to explore an issue that is wholly a matter of public opinion, IOW a state of mind rather than a state of nature.

The survey is appropriately entitled: Climate Change in the American Mind. Title is link to the website for the 2018 edition, with earlier results back to 2008.

The resources there are informative, including articles expressing both satisfactions and disappointments with the levels of belief and concern expressed by survey participants. The compliant mass media cherry pick various findings, giving headlines like these.

“We’ve entered a new era” of climate concern, survey finds CBS

Americans Believe in Climate Change, But Not Climate Action NYmag

Yale Poll: Climate Change ‘Personally Important’ to Record Number of Americans EcoWatch

Most Americans Don’t Know Vast Majority Of Scientists Agree On Climate Change CleanTechnica

Most Americans now worry about climate change—and want to fix it National Geographic

Poll Shows Most People Believe ‘Global Warming is Happening’ necn

Survey reveals 70% of Americans favour the environment over economic growth ClimateAction

vy53gyp6-1344571132


What is the American Mindset according to the Survey?

So beyond details of particular responses, what can we learn from this series of polls about the American state of mind regarding global warming/climate change?

The specific questions and response patterns are at Appendix I: Data Tables & Sample Demographics

There are a lot of questions asked and answered, including exploring a complete range of feelings people have on the issue. I will summarize the central questions and the pattern of responses over the last decade.

Click on image to enlarge.

The core set of global warming beliefs are listed on the left.  The marked lines show the % of responses each one achieved over the years.  For example, over 50% agreed to four of them in 2018: GW is happening, GW is man made, Future generations will be greatly harmed and Most scientists agree.  Other patterns are also of interest.  Personal experience of GW effects is reported by almost 50%, while only 30% are very worried.  Indeed, people are less concerned about harm to themselves or even the US, then they are fearful for Developing Countries (DCs) and for Future Generations.

Notice there is a general curve to most of the answer time series.  Beliefs are only slightly higher in 2018 than they were in 2008.  In general, the %s were flat or declining in this decade until starting to rise again around 2014.  This points to the linkage between the opinions held by the public and the emphasis promoted in the mass media.  Compare the curvature in the above graph with this chart of climate change coverage in leading US newpapers.

The chart and research come from International Collective on Environment, Culture & Politics, AKA ICECaP.  Note the peaks in 2007-8 at the time of IPCC AR4 and Al Gore’s Inconvenient Truth flick, and in 2009-10 around the time of the Copenhagen COP.  The Climategate emails were also in the news in 2010, but for some reason newspapers were less interested in that aspect, the topic dropped in coverage.

The spike in 2013 coincides with Obama’s SOTU speech featuring climate change as the “defining issue of our time.”  The rise in climate change coverage in recent years is a more complex matter.

Climate journalists (like most all journalists) have been obsessed with trashing Donald Trump, and climate change is mentioned often as a subset of Trump complaints.  Consider this chart from Media Matters.

See that huge spike in the middle? That’s from June 1, 2017, when President Donald Trump announced that he intended to pull the U.S. out of the Paris climate agreement. No other day in the last three years saw anywhere near that much coverage. When Trump stages an event related to climate change, the media snap to attention. The rest of the time it’s like, “Climate what?”

That aligns with what Media Matters found when we looked at climate coverage on broadcast TV news programs in 2017: Trump dominated the news segments about climate change. Researchers at the University of Colorado Boulder, in the International Collective on Environment, Culture & Politics, reached a similar conclusion when they analyzed TV news coverage from November of this year: “In US television coverage of climate change or global warming in November 2018, ‘Trump’ was explicitly invoked over fourteen times more frequently than the words ‘science’ or ‘scientists’ together and nearly four times more frequently than the word ‘climate’ itself.”

A research group at the University of Colorado-Boulder, the International Collective on Environment, Culture and Politics (ICE CaPs), produced the findings that illustrate how much climate coverage has been driven by President Donald Trump. It examined coverage last year in five major American newspapers: The Washington Post, The Wall Street Journal, The New York Times, USA Today, and the Los Angeles Times. In the 4,117 stories in those papers that mentioned “climate change” or “global warming,” the word “Trump” appeared 19,184 times — an average of nearly 4.7 times per article.

clip_image014-1

My Mind is Made Up, Don’t Confuse Me with the Facts. H/T Bjorn Lomborg, WUWT


dsc8a1yx4aalk04

Summary

To summarize, Survey Says:

What He Said:   “Ninety-seven percent of scientists agree: climate change is real, man-made and dangerous.” (Obama tweet).  The survey could be reduced to one question:  Do you agree with this tweet?

There is not much upward movement in public belief in global warming/climate change.  There is increased attention from the left-leaning media as part of their general dislike of the Trump administration. One more time, who made global warming into a political rather than a scientific issue?

Earth and Universe As Never Seen Before

This is an introduction to amazing graphics done by Eleanor Lutz (no relation) at her website Tabletop Whale, an original science illustration blog. Above is a data-based view of Earth’s seasons. If you watch in full screen, the four corners show views of the cycle from top, bottom, and sides. Below is her map of the solar system, showing how much scientific information is represented in the illustration (H/T Real Clear Science)

An Orbit Map of the Solar System
JUNE 10 2019 · Link to the Open-Source Code

This week’s map shows the orbits of more than 18000 asteroids in the solar system. This includes everything we know of that’s over 10km in diameter – about 10000 asteroids – as well as 8000 randomized objects of unknown size. This map shows each asteroid at its exact position on New Years’ Eve 1999.

All of the data for this map is shared by NASA and open to the public. However, the data is stored in several different databases so I had to do a decent amount of data cleaning. I’ve explained all of the steps in detail in my open-source code and tutorial, so I’ll just include a sketch of the process here in this blog post:

To see details, open image in new tab, then click on it to enlarge.

To see details, open the image in a new tab, then click on it to enlarge. Then browse the solar system to your heart’s content.

May Makes Both Land and Sea Cooler

banner-blog

With apologies to Paul Revere, this post is on the lookout for cooler weather with an eye on both the Land and the Sea.  UAH has updated their tlt (temperatures in lower troposphere) dataset for May.   Previously I have done posts on their reading of ocean air temps as a prelude to updated records from HADSST3. This month also has a separate graph of land air temps because the comparisons and contrasts are interesting as we contemplate possible cooling in coming months and years.

Presently sea surface temperatures (SST) are the best available indicator of heat content gained or lost from earth’s climate system.  Enthalpy is the thermodynamic term for total heat content in a system, and humidity differences in air parcels affect enthalpy.  Measuring water temperature directly avoids distorted impressions from air measurements.  In addition, ocean covers 71% of the planet surface and thus dominates surface temperature estimates.  Eventually we will likely have reliable means of recording water temperatures at depth.

Recently, Dr. Ole Humlum reported from his research that air temperatures lag 2-3 months behind changes in SST.  He also observed that changes in CO2 atmospheric concentrations lag behind SST by 11-12 months.  This latter point is addressed in a previous post Who to Blame for Rising CO2?

After a technical enhancement to HadSST3 delayed March and April updates, May has just been posted, hopefully a signal the future months will also appear more promptly.  For comparison we can look at lower troposphere temperatures (TLT) from UAHv6 which are now posted for May. The temperature record is derived from microwave sounding units (MSU) on board satellites like the one pictured above. Last month also involved a change in UAH processing of satellite drift corrections, including dropping one platform which can no longer be corrected. The graphs below are taken from the new and current dataset.

The UAH dataset includes temperature results for air above the oceans, and thus should be most comparable to the SSTs. There is the additional feature that ocean air temps avoid Urban Heat Islands (UHI).  The graph below shows monthly anomalies for ocean temps since January 2015.

May ocean air temps dropped in all regions after April’s rise, resulting in the Global average back down below January 2019.  NH warming in February has been reversed, and April warming in SH and the Tropics is also gone.  The temps this May are warmer than 2018, but lower than 05/2017, and of course lower than 2016.

Land Air Temperatures Tracking Downward in Seesaw Pattern

We sometimes overlook that in climate temperature records, while the oceans are measured directly with SSTs, land temps are measured only indirectly.  The land temperature records at surface stations record air temps at 2 meters above ground.  UAH gives tlt anomalies for air over land separately from ocean air temps.  The graph updated for May is below.

The greater volatility of the Land temperatures was evident earlier, but has calmed down recently. Also the  NH dominates, having twice as much land area as SH.  Note how global peaks mirror NH peaks.  In January 2019 all Land air temps were close but have now diverged.  In May both SH and the Tropics dropped sharply (comparable to ocean temps), and the much larger NH land surface also cooled, pulling the Global anomaly down nearly 0.2C.  The Tropical land air temps could not be more different from 05/2018, yet the Global, NH and SH are much cooler.

TLTs include mixing above the oceans and probably some influence from nearby more volatile land temps.  Clearly NH and Global land temps have been dropping in a seesaw pattern, now more than 1C lower than the peak in 2016.  TLT measures started the recent cooling later than SSTs from HadSST3, but are now showing the same pattern.  It seems obvious that despite the three El Ninos, their warming has not persisted, and without them it would probably have cooled since 1995.  Of course, the future has not yet been written.


Climate Changes Both Ways

The title comes from a news event last week when President Trump reminded Prince Charles of a natural truism:  Climate change goes both ways.  A media freak out ensued, as shown by this example from Newsweek.  Excerpt in italics with my bolds.

President Donald Trump said Wednesday he believes there has been a change in the weather due to climate change, but that “it changes both ways.”

The president then explained his views on the climate. “Don’t forget, it used to be called global warming, that wasn’t working, then it was called climate change, now it’s actually called extreme weather because with extreme weather you can’t miss,” the president said.

Environmental watchdog groups now advocate calling the phenomenon “climate catastrophe.”

It seemed to me that Trump is learning from his briefings with William Happer, and is finding the weak spots in the alarmist house of cards.  It also reminded me of a previous post describing the complexity of tracking climate change.  That essay is reprinted below because it reminds us that not only does climate change both ways, but also the warming and cooling can happen concurrently in some times and places.

Concurrent Climate Warming and Cooling

This post highlights recent interesting findings regarding past climate change in NH, Scotland in particular. The purpose of the research was to better understand how glaciers could be retreating during the Younger Dryas Stadia (YDS), one of the coldest periods in our Holocene epoch.

The lead researcher is Gordon Bromley, and the field work was done on site of the last ice fields on the highlands of Scotland. 14C dating was used to estimate time of glacial events such as vegetation colonizing these places. Bromely explains in article Shells found in Scotland rewrite our understanding of climate change at siliconrepublic. Excerpts in italics with my bolds.

By analysing ancient shells found in Scotland, the team’s data challenges the idea that the period was an abrupt return to an ice age climate in the North Atlantic, by showing that the last glaciers there were actually decaying rapidly during that period.

The shells were found in glacial deposits, and one in particular was dated as being the first organic matter to colonise the newly ice-free landscape, helping to provide a minimum age for the glacial advance. While all of these shell species are still in existence in the North Atlantic, many are extinct in Scotland, where ocean temperatures are too warm.

This means that although winters in Britain and Ireland were extremely cold, summers were a lot warmer than previously thought, more in line with the seasonal climates of central Europe.

“There’s a lot of geologic evidence of these former glaciers, including deposits of rubble bulldozed up by the ice, but their age has not been well established,” said Dr Gordon Bromley, lead author of the study, from NUI Galway’s School of Geography and Archaeology.

“It has largely been assumed that these glaciers existed during the cold Younger Dryas period, since other climate records give the impression that it was a cold time.”

He continued: “This finding is controversial and, if we are correct, it helps rewrite our understanding of how abrupt climate change impacts our maritime region, both in the past and potentially into the future.”

The recent report is Interstadial Rise and Younger Dryas Demise of Scotland’s Last Ice Fields G. Bromley A. Putnam H. Borns Jr T. Lowell T. Sandford D. Barrell  First published: 26 April 2018.(my bolds)

Abstract

Establishing the atmospheric expression of abrupt climate change during the last glacial termination is key to understanding driving mechanisms. In this paper, we present a new 14C chronology of glacier behavior during late‐glacial time from the Scottish Highlands, located close to the overturning region of the North Atlantic Ocean. Our results indicate that the last pulse of glaciation culminated between ~12.8 and ~12.6 ka, during the earliest part of the Younger Dryas stadial and as much as a millennium earlier than several recent estimates. Comparison of our results with existing minimum‐limiting 14C data also suggests that the subsequent deglaciation of Scotland was rapid and occurred during full stadial conditions in the North Atlantic. We attribute this pattern of ice recession to enhanced summertime melting, despite severely cool winters, and propose that relatively warm summers are a fundamental characteristic of North Atlantic stadials.

Plain Language Summary

Geologic data reveal that Earth is capable of abrupt, high‐magnitude changes in both temperature and precipitation that can occur well within a human lifespan. Exactly what causes these potentially catastrophic climate‐change events, however, and their likelihood in the near future, remains frustratingly unclear due to uncertainty about how they are manifested on land and in the oceans. Our study sheds new light on the terrestrial impact of so‐called “stadial” events in the North Atlantic region, a key area in abrupt climate change. We reconstructed the behavior of Scotland’s last glaciers, which served as natural thermometers, to explore past changes in summertime temperature. Stadials have long been associated with extreme cooling of the North Atlantic and adjacent Europe and the most recent, the Younger Dryas stadial, is commonly invoked as an example of what might happen due to anthropogenic global warming. In contrast, our new glacial chronology suggests that the Younger Dryas was instead characterized by glacier retreat, which is indicative of climate warming. This finding is important because, rather than being defined by severe year‐round cooling, it indicates that abrupt climate change is instead characterized by extreme seasonality in the North Atlantic region, with cold winters yet anomalously warm summers.

The complete report is behind a paywall, but a 2014 paper by Bromley discusses the evidence and analysis in reaching these conclusions. Younger Dryas deglaciation of Scotland driven by warming summers  Excerpts with my bolds.

Significance: As a principal component of global heat transport, the North Atlantic Ocean also is susceptible to rapid disruptions of meridional overturning circulation and thus widely invoked as a cause of abrupt climate variability in the Northern Hemisphere. We assess the impact of one such North Atlantic cold event—the Younger Dryas Stadial—on an adjacent ice mass and show that, rather than instigating a return to glacial conditions, this abrupt climate event was characterized by deglaciation. We suggest this pattern indicates summertime warming during the Younger Dryas, potentially as a function of enhanced seasonality in the North Atlantic.

Surface temperatures range from -30C to +30C

Fig. 1. Surface temperature and heat transport in the North Atlantic Ocean.  The relatively mild European climate is sustained by warm sea-surface temperatures and prevailing southwesterly airflow in the North Atlantic Ocean (NAO), with this ameliorating effect being strongest in maritime regions such as Scotland. Mean annual temperature (1979 to present) at 2 m above surface (image obtained using University of Maine Climate Reanalyzer, http://www.cci-reanalyzer.org). Locations of Rannoch Moor and the GISP2 ice core are indicated (yellow and red dots).

Thus the Scottish glacial record is ideal for reconstructing late glacial variability in North Atlantic temperature (Fig. 1). The last glacier resurgence in Scotland—the “Loch Lomond Advance” (LLA)—culminated in a ∼9,500-km2 ice cap centered over Rannoch Moor (Fig. 2A) and surrounded by smaller ice fields and cirque glaciers.

Fig. 2. Extent of the LLA ice cap in Scotland and glacial geomorphology of western Rannoch Moor. (A) Maximum extent of the ∼9,500 km2 LLA ice cap and larger satellite ice masses, indicating the central location of Rannoch Moor. Nunataks are not shown. (B) Glacial-geomorphic map of western Rannoch Moor. Distinct moraine ridges mark the northward active retreat of the glacier margin (indicated by arrow) across this sector of the moor, whereas chaotic moraines near Lochan Meall a’ Phuill (LMP) mark final stagnation of ice. Core sites are shown, including those (K1–K3) of previous investigations (14, 15).

When did the LLA itself occur? We consider two possible resolutions to the paradox of deglaciation during the YDS. First, declining precipitation over Scotland due to gradually increasing North Atlantic sea-ice extent has been invoked to explain the reported shrinkage of glaciers in the latter half of the YDS (18). However, this course of events conflicts with recent data depicting rapid, widespread imposition of winter sea-ice cover at the onset of the YDS (9), rather than progressive expansion throughout the stadial.

Loch Lomond

Furthermore, considering the gradual active retreat of LLA glaciers indicated by the geomorphic record, our chronology suggests that deglaciation began considerably earlier than the mid-YDS, when precipitation reportedly began to decline (18). Finally, our cores contain lacustrine sediments deposited throughout the latter part of the YDS, indicating that the water table was not substantially different from that of today. Indeed, some reconstructions suggest enhanced YDS precipitation in Scotland (24, 25), which is inconsistent with the explanation that precipitation starvation drove deglaciation (26).

We prefer an alternative scenario in which glacier recession was driven by summertime warming and snowline rise. We suggest that amplified seasonality, driven by greatly expanded winter sea ice, resulted in a relatively continental YDS climate for western Europe, both in winter and in summer. Although sea-ice formation prevented ocean–atmosphere heat transfer during the winter months (10), summertime melting of sea ice would have imposed an extensive freshwater cap on the ocean surface (27), resulting in a buoyancy-stratified North Atlantic. In the absence of deep vertical mixing, summertime heating would be concentrated at the ocean surface, thereby increasing both North Atlantic summer sea-surface temperatures (SSTs) and downwind air temperatures. Such a scenario is analogous to modern conditions in the Sea of Okhotsk (28) and the North Pacific Ocean (29), where buoyancy stratification maintains considerable seasonal contrasts in SSTs. Indeed, Haug et al. (30) reported higher summer SSTs in the North Pacific following the onset of stratification than previously under destratified conditions, despite the growing presence of northern ice sheets and an overall reduction in annual SST. A similar pattern is evident in a new SST record from the northeastern North Atlantic, which shows higher summer temperatures during stadial periods (e.g., Heinrich stadials 1 and 2) than during interstadials on account of amplified seasonality (30).

Our interpretation of the Rannoch Moor data, involving the summer (winter) heating (cooling) effects of a shallow North Atlantic mixed layer, reconciles full stadial conditions in the North Atlantic with YDS deglaciation in Scotland. This scenario might also account for the absence of YDS-age moraines at several higher-latitude locations (12, 36–38) and for evidence of mild summer temperatures in southern Greenland (11). Crucially, our chronology challenges the traditional view of renewed glaciation in the Northern Hemisphere during the YDS, particularly in the circum-North Atlantic, and highlights our as yet incomplete understanding of abrupt climate change.

Summary

Several things are illuminated by this study. For one thing, glaciers grow or recede because of multiple factors, not just air temperature. The study noted that glaciers require precipitation (snow) in order to grow, but also melt under warmer conditions. For background on the complexities of glacier dynamics see Glaciermania

Also, paleoclimatology relies on temperature proxies who respond to changes over multicentennial scales at best. C14 brings higher resolution to the table.

Finally, it is interesting to consider climate changing with respect to seasonality.  Bromley et al. observe that during Younger Dryas, Scotland shifted from a moderate maritime climate to one with more seasonal extremes like that of inland continental regions. In that light, what should we expect from cooler SSTs in the North Atlantic?

Note also that our modern warming period has been marked by the opposite pattern. Many NH temperature records show slight summer cooling along with somewhat stronger warming in winter, the net being the modest (fearful?) warming in estimates of global annual temperatures.

I’m with Trump on this one:  Climate shifts are not a matter of one-way warming, as we have been told.


Ocean SSTs Cooled in May

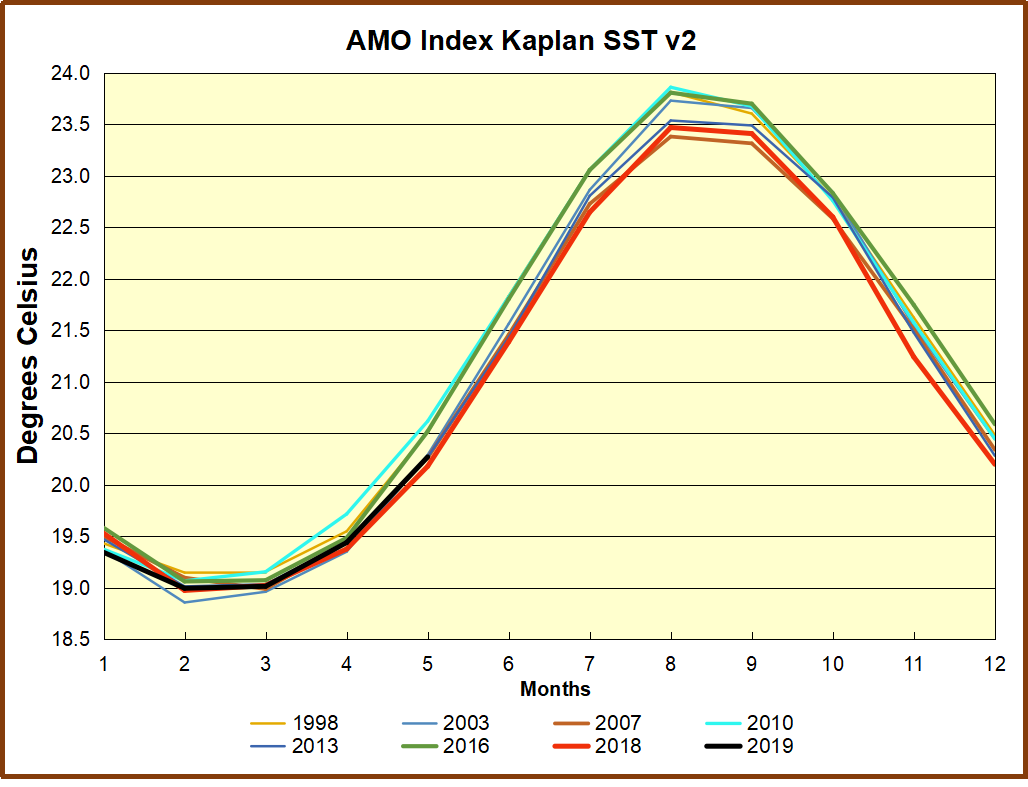
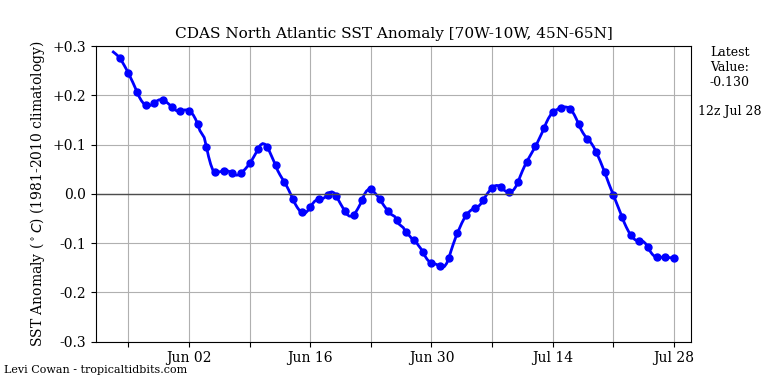
The best context for understanding decadal temperature changes comes from the world’s sea surface temperatures (SST), for several reasons:

  • The ocean covers 71% of the globe and drives average temperatures;
  • SSTs have a constant water content, (unlike air temperatures), so give a better reading of heat content variations;
  • A major El Nino was the dominant climate feature in recent years.

HadSST is generally regarded as the best of the global SST data sets, and so the temperature story here comes from that source, the latest version being HadSST3.  More on what distinguishes HadSST3 from other SST products at the end.

The Current Context

The chart below shows SST monthly anomalies as reported in HadSST3 starting in 2015 through May 2019.
A global cooling pattern is seen clearly in the Tropics since its peak in 2016, joined by NH and SH cycling downward since 2016.  2018 started with slow warming after the low point of December 2017, led by steadily rising NH, which peaked in September and cooled since.  The Tropics rose steadily until November, and are now cooling as well.

In 2019 all regions have been converging to reach nearly the same value in April.  Now in May, NH rose very slightly, while SH dropped 0.1C and the Tropics SSTs are down 0.07C. As a result the Global average anomaly in down 0.05 to an anomaly of 0.52C  All regions are about the same as 05/2017 which led to a cooling period despite NH warming at the time

Note that higher temps in 2015 and 2016 were first of all due to a sharp rise in Tropical SST, beginning in March 2015, peaking in January 2016, and steadily declining back below its beginning level. Secondly, the Northern Hemisphere added three bumps on the shoulders of Tropical warming, with peaks in August of each year.  A fourth NH bump was lower and peaked in September 2018.  Also, note that the global release of heat was not dramatic, due to the Southern Hemisphere offsetting the Northern one.

The annual SSTs for the last five years are as follows:

Annual SSTs Global NH SH  Tropics
2014 0.477 0.617 0.335 0.451
2015 0.592 0.737 0.425 0.717
2016 0.613 0.746 0.486 0.708
2017 0.505 0.650 0.385 0.424
2018 0.480 0.620 0.362 0.369

2018 annual average SSTs across the regions are close to 2014, slightly higher in SH and much lower in the Tropics.  The SST rise from the global ocean was remarkable, peaking in 2016, higher than 2011 by 0.32C.

A longer view of SSTs

The graph below  is noisy, but the density is needed to see the seasonal patterns in the oceanic fluctuations.  Previous posts focused on the rise and fall of the last El Nino starting in 2015.  This post adds a longer view, encompassing the significant 1998 El Nino and since.  The color schemes are retained for Global, Tropics, NH and SH anomalies.  Despite the longer time frame, I have kept the monthly data (rather than yearly averages) because of interesting shifts between January and July.

Open image in new tab to enlarge.

1995 is a reasonable starting point prior to the first El Nino.  The sharp Tropical rise peaking in 1998 is dominant in the record, starting Jan. ’97 to pull up SSTs uniformly before returning to the same level Jan. ’99.  For the next 2 years, the Tropics stayed down, and the world’s oceans held steady around 0.2C above 1961 to 1990 average.

Then comes a steady rise over two years to a lesser peak Jan. 2003, but again uniformly pulling all oceans up around 0.4C.  Something changes at this point, with more hemispheric divergence than before. Over the 4 years until Jan 2007, the Tropics go through ups and downs, NH a series of ups and SH mostly downs.  As a result the Global average fluctuates around that same 0.4C, which also turns out to be the average for the entire record since 1995.

2007 stands out with a sharp drop in temperatures so that Jan.08 matches the low in Jan. ’99, but starting from a lower high. The oceans all decline as well, until temps build peaking in 2010.

Now again a different pattern appears.  The Tropics cool sharply to Jan 11, then rise steadily for 4 years to Jan 15, at which point the most recent major El Nino takes off.  But this time in contrast to ’97-’99, the Northern Hemisphere produces peaks every summer pulling up the Global average.  In fact, these NH peaks appear every July starting in 2003, growing stronger to produce 3 massive highs in 2014, 15 and 16.  NH July 2017 was only slightly lower, and a fifth NH peak still lower in Sept. 2018.  Note also that starting in 2014 SH plays a moderating role, offsetting the NH warming pulses. (Note: these are high anomalies on top of the highest absolute temps in the NH.)

What to make of all this? The patterns suggest that in addition to El Ninos in the Pacific driving the Tropic SSTs, something else is going on in the NH.  The obvious culprit is the North Atlantic, since I have seen this sort of pulsing before.  After reading some papers by David Dilley, I confirmed his observation of Atlantic pulses into the Arctic every 8 to 10 years.

But the peaks coming nearly every summer in HadSST require a different picture.  Let’s look at August, the hottest month in the North Atlantic from the Kaplan dataset.
AMO August 2018

The AMO Index is from from Kaplan SST v2, the unaltered and not detrended dataset. By definition, the data are monthly average SSTs interpolated to a 5×5 grid over the North Atlantic basically 0 to 70N. The graph shows warming began after 1992 up to 1998, with a series of matching years since. Because the N. Atlantic has partnered with the Pacific ENSO recently, let’s take a closer look at some AMO years in the last 2 decades.
This graph shows monthly AMO temps for some important years. The Peak years were 1998, 2010 and 2016, with the latter emphasized as the most recent. The other years show lesser warming, with 2007 emphasized as the coolest in the last 20 years. Note the red 2018 line is at the bottom of all these tracks. The short black line shows that 2019 began slightly cooler and is now tracking last year closely.


Summary

The oceans are driving the warming this century.  SSTs took a step up with the 1998 El Nino and have stayed there with help from the North Atlantic, and more recently the Pacific northern “Blob.”  The ocean surfaces are releasing a lot of energy, warming the air, but eventually will have a cooling effect.  The decline after 1937 was rapid by comparison, so one wonders: How long can the oceans keep this up? If the pattern of recent years continues, NH SST anomalies may rise slightly in coming months, but once again, ENSO which has weakened will probably determine the outcome.

Postscript:

In the most recent GWPF 2017 State of the Climate report, Dr. Humlum made this observation:

“It is instructive to consider the variation of the annual change rate of atmospheric CO2 together with the annual change rates for the global air temperature and global sea surface temperature (Figure 16). All three change rates clearly vary in concert, but with sea surface temperature rates leading the global temperature rates by a few months and atmospheric CO2 rates lagging 11–12 months behind the sea surface temperature rates.”

Footnote: Why Rely on HadSST3

HadSST3 is distinguished from other SST products because HadCRU (Hadley Climatic Research Unit) does not engage in SST interpolation, i.e. infilling estimated anomalies into grid cells lacking sufficient sampling in a given month. From reading the documentation and from queries to Met Office, this is their procedure.

HadSST3 imports data from gridcells containing ocean, excluding land cells. From past records, they have calculated daily and monthly average readings for each grid cell for the period 1961 to 1990. Those temperatures form the baseline from which anomalies are calculated.

In a given month, each gridcell with sufficient sampling is averaged for the month and then the baseline value for that cell and that month is subtracted, resulting in the monthly anomaly for that cell. All cells with monthly anomalies are averaged to produce global, hemispheric and tropical anomalies for the month, based on the cells in those locations. For example, Tropics averages include ocean grid cells lying between latitudes 20N and 20S.

Gridcells lacking sufficient sampling that month are left out of the averaging, and the uncertainty from such missing data is estimated. IMO that is more reasonable than inventing data to infill. And it seems that the Global Drifter Array displayed in the top image is providing more uniform coverage of the oceans than in the past.

uss-pearl-harbor-deploys-global-drifter-buoys-in-pacific-ocean

USS Pearl Harbor deploys Global Drifter Buoys in Pacific Ocean


Kerry’s Blarney and Murphy’s Law

Recently former unsuccessful Presidential candidate and US Secretary of State John Kerry spoke at the Our Ocean Wealth Summit in Cork, Ireland. He missed seeing the boomerang on the accusation of his own lying, unless of course he no longer considers himself a world leader.  As we shall see, Kerry would have been better served by using the cork to shut up with his fear-mongering. The article is in Irish Examiner. Excerpts in italics with my bolds.

World leaders are lying to the public about the climate crisis and dismissing scientific evidence.

That was the stark warning from former US Secretary of State John Kerry who said the truth is not just being ignored but altered.

“Today we have public leaders who not only try to avoid the truth, but who try to alter it, through thousands of lies,” he said.

Mr Kerry was speaking after addressing a global oceans summit in Cork where he said the world and its climate do not have the time or space to deal with “presidents and prime ministers” who deny the truth about climate change.

However, he told delegates at the Our Ocean Wealth summit that the tide can be turned if governments face up to the truth and act faster.

Mr Kerry is leading a global effort to deliver more Marine Protected Areas but warned that humans are changing the chemistry of that oceans faster than it has been changed in the last 50m years.

“We can’t protect oceans without solving the problem of climate change and we can’t solve that without protecting the oceans — they go hand in hand,” he said.

“I believe we can do this. My frustration is that we are not doing what we know we can do. And time is not on our side.

“We know the enemy — the enemy is man-made. If it’s man-made it can be ‘man-solved’.

While Kerry was talking Blarney in Ireland, Robert Murphy was laying down the Law in Connecticut.  Zero Hedge reported his remarks in an article What Universities Won’t Teach College Students About The Economics Of Climate Change. Excerpts in italics with my bolds.

[Authored by Robert Murphy via The Institute for Energy Research]

I recently gave a talk to a student group at Connecticut College on the economics of climate change. (The video is broken up into three parts on my YouTube channel: one, two, and three.) In this post I’ll summarize three of my main points:

(1) There is a huge disconnect between what the published economics research actually says about government policies to limit global warming, and how the media is reporting it.

(2) President Trump taking the U.S. out of the Paris Agreement doesn’t really affect anything on the margin, even if we stipulate the alarmist position on climate change. And

(3) If I’m wrong, and human-caused climate change really does pose a dire threat to humanity in the next few decades, then scientists are currently working on several lines of research of practical ways to actually deal with the problem.

The “Consensus Research” Does Not Justify Radical Political Intervention

To demonstrate just how wide the chasm is between the actual economics research and the media treatment of these issues, I described to the students the spectacle I observed back in the fall of 2018, when on the same weekend news came out that William Nordhaus had won the Nobel Prize for his pioneering work on the economics of climate change and that the UN released a “Special Report” advising governments to try to limit global warming to 1.5 degrees Celsius.

The media treatment (sometimes in the same story) presented these events with no sense of conflict or irony, leading regular citizens to assume that Nordhaus’ Nobel-winning work supported the UN’s goals for policymakers.

But that is not true at all. Here’s a graph from a 2017 Nordhaus publication that I included in my presentation:
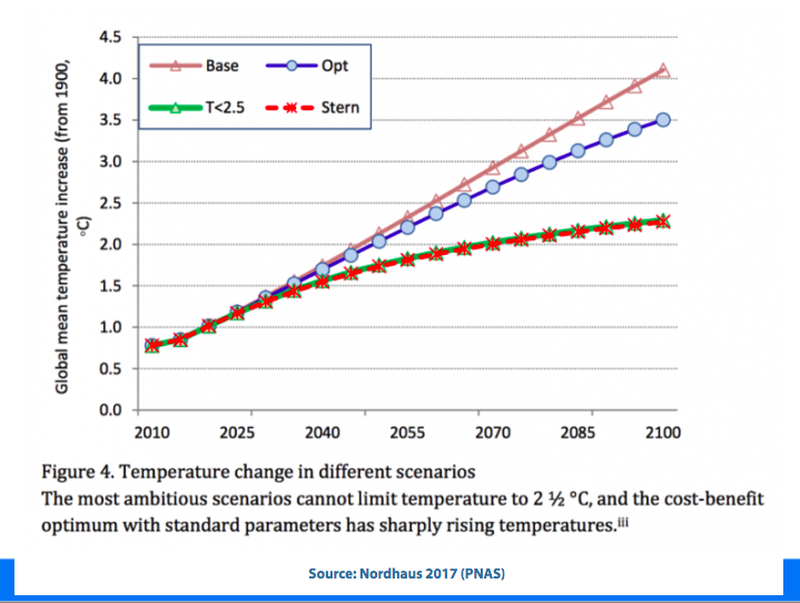
As the figure shows, Nordhaus’ model—and again, this isn’t cooked up by the Heritage Foundation, but instead was one selected by the Obama Administration’s EPA and was the reason he won the Nobel Prize—projects that if governments “did nothing,” total global warming would reach about 4.1 degrees Celsius. In contrast, if governments implemented the “optimal carbon tax,” as Nordhaus would recommend in a perfect world, then total warming would be about 3.5 degrees Celsius.

Anyone remotely familiar with the climate change policy debate knows that such an amount of warming would terrify the prominent activists and groups advocating for a political solution. They would quite confidently tell the public that warming of this amount would spell absolute catastrophe for future generations.

My point here isn’t to endorse Nordhaus’ model. My point is simply that Americans never heard anything about this when the media simultaneously covered Nordhaus’ award and the UN’s document calling for a 1.5°C limit. And yet, Nordhaus’ own work—not shown in the figure above, but I spell it out here—clearly concludes that such an aggressive target would cause far more damage to humans in the form of reduced economic output, that it would be better for governments to “do nothing” about climate change at all.

With or Without the United States, the Paris Agreement Was Going to “Fail”

To continue with the theme of how they’ve been misinformed, I reminded the students of the media’s apoplexy when Trump announced his intention to remove the United States from the Paris Climate Agreement (or treaty, in lay terms). I showed them a headline in which famed physicist Stephen Hawking said Trump was pushing the planet “over the brink.”

I then asked the students rhetorically, “You would think that the Paris Agreement was going to ‘work’ to contain the threat of climate change, except for Trump pulling out and wrecking it, right?

And yet, the pro-intervention group ClimateActionTracker.org nicely illustrates that even if all countries met their pledges (including the U.S.), it wouldn’t come close to limiting warming to the weaker benchmark of 2°C, let alone the newer, more chic target of 1.5°C. Things were even worse if we evaluated the actual policies of governments (as opposed to what they stated they intended to do, about limiting their emissions).

Technological Solutions

After spending so much time showing that the political “solutions” were failing even on their own terms, I summarized a few avenues of research (see this article for details) where scientists are exploring techniques to either remove carbon dioxide from the atmosphere or reflect some incoming sunlight. Although I personally do not think human-caused climate change is a crisis, and do think that adaptation coming from normal economic growth will be more than sufficient to deal with any problems along the way, nonetheless scientists do have these other techniques in their back pocket, should they become necessary to “buy humanity a few decades of breathing room” while technology advances in the transportation and energy sectors.

Conclusion

Americans, especially students, are being whipped into a panic over the allegedly existential threat of climate change. Yet the actual research, summarized in the UN’s own periodic reports and in the research of a Nobel laureate in the field, shows that at best only a modest “leaning against the wind” could be justified according to standard economic science.

By their own criteria, the alarmist activists are admitting that political measures are nowhere near achieving their goals. Their own rhetoric says that these activists are wasting everyone’s time pushing solutions that will end in catastrophe. Occasionally they slip up, as for example when Alexandria Ocasio-Cortez admits that her “we have 12 years left” was not to be taken literally.

In order to bring light to the climate change debate, at this point one just needs to actually screenshot and explain the evidence from the establishment sources. The rhetorical framing of the issue is so far removed from the underlying research that this alone is heretical.

See Also:  Economists as “Useful Idiots” for Green Socialists

N. Atlantic Keeps Its Cool

RAPID Array measuring North Atlantic SSTs.

For the last few years, observers have been speculating about when the North Atlantic will start the next phase shift from warm to cold. Given the way 2018 went and 2019 is following, this may be the onset.  First some background.

. Source: Energy and Education Canada

An example is this report in May 2015 The Atlantic is entering a cool phase that will change the world’s weather by Gerald McCarthy and Evan Haigh of the RAPID Atlantic monitoring project. Excerpts in italics with my bolds.

This is known as the Atlantic Multidecadal Oscillation (AMO), and the transition between its positive and negative phases can be very rapid. For example, Atlantic temperatures declined by 0.1ºC per decade from the 1940s to the 1970s. By comparison, global surface warming is estimated at 0.5ºC per century – a rate twice as slow.

In many parts of the world, the AMO has been linked with decade-long temperature and rainfall trends. Certainly – and perhaps obviously – the mean temperature of islands downwind of the Atlantic such as Britain and Ireland show almost exactly the same temperature fluctuations as the AMO.

Atlantic oscillations are associated with the frequency of hurricanes and droughts. When the AMO is in the warm phase, there are more hurricanes in the Atlantic and droughts in the US Midwest tend to be more frequent and prolonged. In the Pacific Northwest, a positive AMO leads to more rainfall.

A negative AMO (cooler ocean) is associated with reduced rainfall in the vulnerable Sahel region of Africa. The prolonged negative AMO was associated with the infamous Ethiopian famine in the mid-1980s. In the UK it tends to mean reduced summer rainfall – the mythical “barbeque summer”.Our results show that ocean circulation responds to the first mode of Atlantic atmospheric forcing, the North Atlantic Oscillation, through circulation changes between the subtropical and subpolar gyres – the intergyre region. This a major influence on the wind patterns and the heat transferred between the atmosphere and ocean.

The observations that we do have of the Atlantic overturning circulation over the past ten years show that it is declining. As a result, we expect the AMO is moving to a negative (colder surface waters) phase. This is consistent with observations of temperature in the North Atlantic.

Cold “blobs” in North Atlantic have been reported, but they are usually winter phenomena. For example in April 2016, the sst anomalies looked like this

But by September, the picture changed to this

And we know from Kaplan AMO dataset, that 2016 summer SSTs were right up there with 1998 and 2010 as the highest recorded.

As the graph above suggests, this body of water is also important for tropical cyclones, since warmer water provides more energy.  But those are annual averages, and I am interested in the summer pulses of warm water into the Arctic. As I have noted in my monthly HadSST3 reports, most summers since 2003 there have been warm pulses in the north atlantic.
amo december 2018
The AMO Index is from from Kaplan SST v2, the unaltered and not detrended dataset. By definition, the data are monthly average SSTs interpolated to a 5×5 grid over the North Atlantic basically 0 to 70N.  The graph shows the warmest month August beginning to rise after 1993 up to 1998, with a series of matching years since.  December 2016 set a record at 20.6C, but note the plunge down to 20.2C for  December 2018, matching 2011 as the coldest years  since 2000.  Because McCarthy refers to hints of cooling to come in the N. Atlantic, let’s take a closer look at some AMO years in the last 2 decades.

May is a transitional month, and does serve to show the pattern of North Atlantic pulse related to the ENSO events. In the last two decades, there were four El Nino events peaking in 1998, 2005, 2010 and 2016.  All those years appear in the May AMO record as over 20.4C, a level not previously reached in the North Atlantic. Note the dropoff to 20.2C the last two years.

This graph shows monthly AMO temps for some important years. The Peak years were 1998, 2010 and 2016, with the latter emphasized as the most recent. The other years show lesser warming, with 2007 emphasized as the coolest in the last 20 years. Note the red 2018 line is at the bottom of all these tracks.  The short black line shows that 2019 began slightly cooler than January 2018, and tracking closely since.

With all the talk of AMOC slowing down and a phase shift in the North Atlantic, it seems the annual average for 2018 confirms that cooling has set in.  Through December the momentum is certainly heading downward, despite the band of warming ocean  that gave rise to European heat waves last summer.

amo annual122018


Zero Carbon $$ Poppycock


Tim Worstall writes at Adam Smith The Observer is More Than Usually Confused on the Subject of Climate Change.  Excerpts in italics with my bolds.

The costs of doing something about climate change versus the costs of not is a subject that has been well hashed over in the Stern Review and the work of William Nordhaus. No point in revisiting all of that here. However, The Observer manages to get itself more than usually confused over the subject in the business editorial.

The idea is that we should strive ahead to be a zero carbon society and economy because we’ll create vast profits from having done so.

But the spin-off economic benefits of being in the vanguard of decarbonisation are potentially enormous. The countries that move first to develop green technologies will reap monopoly profits until such time as their rivals catch up.

That’s not quite how it’s working out already. Britain installs a large number of solar panels – too many for a country so far north perhaps – but not one single solar cell is made in Britain. It’s difficult to have world leadership in the manufacturing of a technology when you don’t actually do the manufacture. To be world leader in solar panel installation might be a nice green badge to wear on the Scout’s uniform but being able to nail things to the roof is not what international monopolies are built of. We seem to import our windmills from Denmark and such places. And so on.

But even to think along such lines is to be making a category error. For while it might be true that government policy encourages the development and deployment of such technologies it’s not actually government, nor the country, that does or will own them. They do belong and will belong to the private sector economic actors who develop them.

Perhaps Drax will solve the thorny problem of carbon capture without expending so much energy doing the capturing as to make the process economic. Unlikely but still – that process will belong to Drax, not GB PLC.

That’s not the only error of course. For British companies to be able to extract monopoly profits from foreigners means that they must have actual monopolies. Which means that they’ll have a monopoly over their technologies here in the UK too, extracting monopoly profits from our hides. Which isn’t the point nor the policy at all, is it?

There’re unlikely to be monopoly profits from going green, they wouldn’t belong to the nation that suffered the costs and even if there were we’d be working as hard as we could to break the monopoly for fear of the costs such would extract from us. Meaning that the promise of global monopoly profits from going green isn’t all that alluring a prospect, doesn’t it?

Climate Politics: Elites vs. Workers

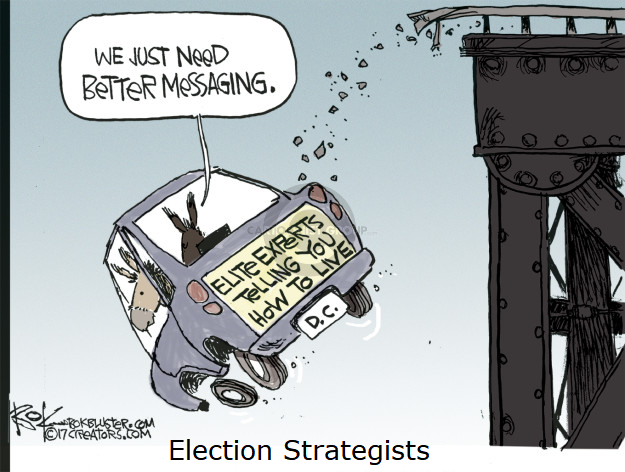
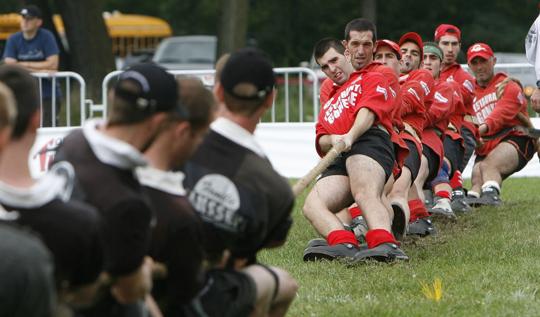
Chuck DeVore at Forbes connects the dots between three recent events suggesting that progressive warmists are increasingly opposed by workers who used to vote with them. Devore describes a divide in the US electorate, but there are comparable stresses in European countries like France, Germany, Italy, Hungary and others. His article is How Tesla, Crony Corporate Welfare, And The Green New Deal Portend A Coming Political Realignment. Excerpts in italics with my bolds.

A series of three seemingly unconnected events over five days in Ohio and California hint at a fundamental political realignment, underscoring the fragility of the American left’s coalition going into the 2020 election.

There is a growing, and likely irreparable, rift between elite progressive environmentalists who are accustomed to dominating the narrative within the Democratic Party and—to a slightly lesser extent, within the major media—and blue-collar workers, especially those in the trades that build the nation.

First, on May 29, ten Democrats in the Ohio State House joined 43 Republicans to pass House Bill 6 and send it to the Senate. HB 6, which eliminates the state’s renewable portfolio standard for electricity, was opposed by environmental groups who feared it would slow the development of wind and solar power in favor of nuclear power and even coal. Free market groups also opposed the measure for its $300 million in subsidies they labeled “corporate welfare.” When Democrats join Republicans to mount a direct challenge to the principles of the Green New Deal, it indicates that Ohio, and other key swing states, may be beyond reach to any presidential candidate touting the wholesale elimination of nuclear and coal-fired power.

Then on June 1, Rusty Hicks, head of the Los Angeles County Federation of Labor, won a seven-way election to chair the California Democratic Party with 57% of the vote in the first round of balloting against more progressive opponents. As reported in Politico, Hicks’ labor colleagues mounted a “Blue Collar Revolution” demonstration at the California Democratic Party convention in San Francisco the day of his convincing win. The goal of the convention protest was to warn party regulars that labor will walk if the Green New Deal moves forward, threatening jobs. In May, the same labor group protested Los Angeles Mayor Eric Garcetti’s version of the Green New Deal, chanting, “Garcetti’s gotta go.”

Finally, on June 3, Bloomberg reported that Tesla (NASDAQ: TSLA) has made $2 billion since 2010 by selling fuel economy credits to General Motors (NYSE: GM) and Fiat Chrysler (NYSE: FCAU). The credits were likely purchased to comply with the federal Corporate Average Fuel Economy (CAFE) standards under the 2007 Energy Independence and Security Act, passed during Speaker Nancy Pelosi’s first time leading the House.

This $2 billion transfer from GM and Fiat Chrysler to Tesla amounted to about $4,000 per electric car delivered—on top of the $7,500 credit buyers of the first 200,000 Teslas could claim on their federal income tax returns. Just the $2 billion in CAFE transfer payments alone had the effect of adding almost $100 to the price of a of a Chevy Silverado or a Dodge Ram to subsidize an electric car purchase by what was, on average, a white, non-Hispanic man with no children at home making $143,177 per year. In 2017, half of U.S. households had income below $61,372.

GM is said to be in the market to buy more credits to hedge their bets should President Trump lose reelection and mileage (and emissions) credits become more valuable due to a renewed government mandate for electric vehicles. Political observers should expect that government support for Tesla and its mercurial founder, Elon Musk, will become fodder for the 2020 campaign.

The cash transfers involved in making the Green New Deal a reality run into the trillions, dwarfing Tesla’s mere billions of subsidies. Noting the looming challenge of reconciling the ambitious reordering of the economy in the name of reducing carbon dioxide emissions, Jessica Levinson, a professor who teaches politics and ethics at Loyola Law School, said, “The Green New Deal may be the darling of the Democratic Party — but it really divides the Democrats on a fault line, which is more of the elites against the working class Democrats who are concerned about losing their jobs.”

And while politicians who support the Green New Deal contend that they will spend billions to retrain workers who lose their jobs because of the newly planned economy, Levinson notes that workers in the skilled trades “don’t necessarily want to be retrained… nor is it even possible.”

This is largely the reason why America’s largest labor union, the AFL-CIO, has registered its opposition to the Green New Deal.

How the leading contenders for the Democratic nomination for president reconcile their near-unanimous support of a vastly expensive and economically disruptive environmental plan with beating President Trump in key swing states that feature a strong jobs base in manufacturing and extractive industries such as natural gas production, will be a difficult political task.