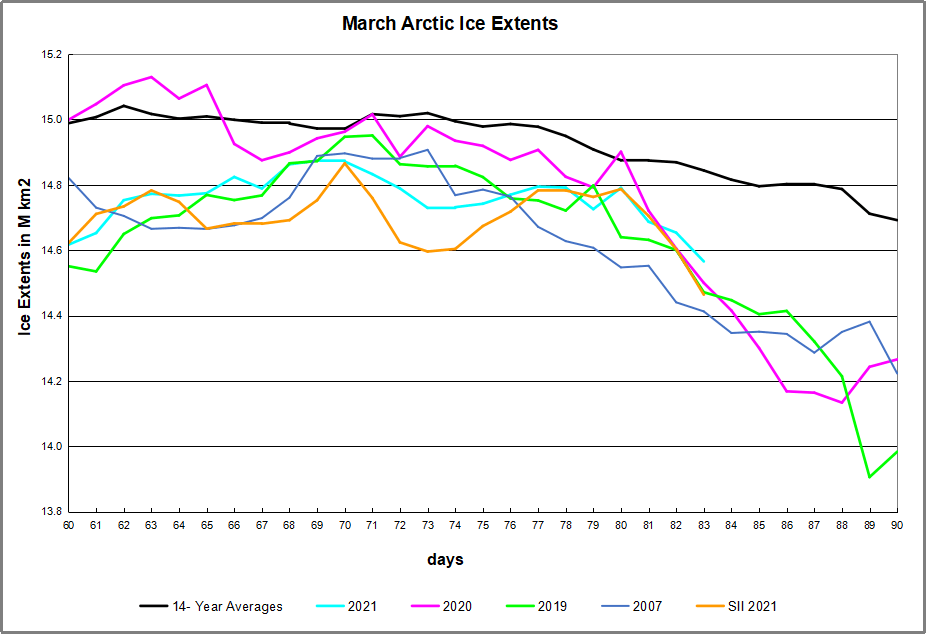
As anticipated in a previous post, Arctic ice extent appears to have peaked under the 15M km2 threshold. An earlier discussion noted that the wavy Polar Vortex that froze Texas with cold Arctic air in February, allowed warmer southern air into Arctic regions, reducing ice extent. The ice recovered afterward ( see March 1, 2021 Arctic Ice Recovers from PV Hit ), but 2021 was no longer going to reach 15M km2. As shown by the graph below, ice extents this year did persist and draw close to the 14 year average, before beginning the melt season this week.

Starting March MASIE 2021 shows Arctic extents were about 400k km2 below average, but for the first 20 days added 200k while the average lost about 100k, reducing the difference to 85k km2 on day 80. Now in the last 3 days the melt season has erased the gains in 2021 and restored the deficit to nearly 300k km2, 2% of the 14-year average. SII reported mostly lower extents than MASIE, but presently the two are similar. The table shows the distribution of ice over the Arctic regions.
| Region | 2021083 | Day 083 Average | 2021-Ave. | 2007083 | 2021-2007 |
| (0) Northern_Hemisphere | 14565743 | 14844057 | -278315 | 14412819 | 152924 |
| (1) Beaufort_Sea | 1070689 | 1070239 | 450 | 1069711 | 978 |
| (2) Chukchi_Sea | 966006 | 965879 | 127 | 966006 | 0 |
| (3) East_Siberian_Sea | 1087137 | 1087066 | 72 | 1087137 | 0 |
| (4) Laptev_Sea | 897827 | 897599 | 228 | 897845 | -18 |
| (5) Kara_Sea | 935023 | 918802 | 16221 | 904153 | 30870 |
| (6) Barents_Sea | 689316 | 649153 | 40163 | 472230 | 217086 |
| (7) Greenland_Sea | 657096 | 631454 | 25642 | 609918 | 47178 |
| (8) Baffin_Bay_Gulf_of_St._Lawrence | 1284957 | 1509201 | -224244 | 1323453 | -38496 |
| (9) Canadian_Archipelago | 854597 | 853068 | 1529 | 852767 | 1830 |
| (10) Hudson_Bay | 1260903 | 1260717 | 186 | 1259717 | 1186 |
| (11) Central_Arctic | 3203492 | 3230083 | -26591 | 3234061 | -30569 |
| (12) Bering_Sea | 592244 | 746974 | -154730 | 883221 | -290977 |
| (13) Baltic_Sea | 46648 | 70687.87 | -24040 | 70484 | -23836 |
| (14) Sea_of_Okhotsk | 1010021 | 938704 | 71317 | 765577 | 244443 |
Interestingly, both Okhotsk and Barents Seas peaked well above average, and are still in surplus after starting to retreat. The main deficits are in Bering and Baffin Bay. The central Arctic, Siberian and Canadian regions remain solidly frozen.
Background previous post Arctic Ice Moment of Truth 2021
For ice extent in the Arctic, the bar is set at 15M km2. The average peak in the last 14 years occurs on day 62 at 15.04M km2 before descending, though the average can still be above 15M at late as day 73. Nine of the last 14 years were able to clear 15M, but recently only 2016 and 2020 ice extents cleared the bar at 15M km2; the others came up short. The actual annual peak ice extent day varied between day 59 (2016) to day 82 (2012).
The animation shows in two weeks how this year’s ice extents contracted and then regrew greater than before, coincidental with the wavy Polar Vortex (PV) first admitting warmer southern air and then keeping the cold air in.
As reported previously, most of the action was firstly in the Pacific, especially Sea of Okhotsk upper left, ice shrinking one week by 200k km2 and rapidly growing back 210k km2 ice extent the next. Okhotsk ice is now 1.1M km2, 96% of 2020 max. On the Atlantic side, Barents sea upper right lost 100k km2 retreating from Svalbard, then gained 120k km2 back. Greenland Sea ice middle right lost 100k km2, and then gained 150k km2. Barents now has 3% more ice than 2020 max, while Greenland sea ice is 85% of last year’s max.

Drift ice in Okhotsk Sea at sunrise.

For more on the Pacific basins see post Meet Bering and Okhotsk Seas

Reblogged this on Climate Collections.
LikeLiked by 1 person