World of CO2 Infographics

Raymond of RiC-Communications studio collaborated with me and content experts in order to produce high quality infographics on CO2 for improving public awareness.  This post presents the thirteen charts he has produced on this topic. I find them straightforward and useful, and appreciate his excellent work on this. Project title is link to RiC-Communications.  Thanks again to Raymond for recovering access to his work after reorganizing his website.

This project is: The world of CO2

Infographics can be helpful, in making things simple to understand. CO2 is a complex topic with a lot of information and statistics. These simple step by step charts should help to give you an idea of CO2’s importance. Without CO2, plants wouldn’t be able to live on this planet. Just remember, that if CO2 falls below 150 ppm, all plant life would cease to exist.

Images are available at these links:

The+World+of+CO2 CO2 charts

The+World+of+Climate+Change Charts

World+of+Ice+Ages Charts

The+World+of+Energy Charts

– N° 1 Earth‘s atmospheric composition
– N° 2 Natural sources of CO2 emissions
– N° 3 Global anthropogenic CO2 emissions
– N° 4 CO2 – Carbon dioxide molecule
– N° 5 The global carbon cycle
– N° 6 Carbon and plant respiration
– N° 7 Plant categories and abundance (C3, C4 & CAM Plants)
– N° 8 Photosynthesis, the C3 vs C4 gap
– N° 9 Plant respiration and CO2
– N° 10 The logarithmic temperature rise of higher CO2 levels.
N° 11 Earths atmospheric composition in relationship to CO2
– N° 12 Human respiration and CO2 concentrations.
– N° 13 600 million years of temperature change and atmospheric CO2
– N° 14 The Composition of the Human Body

WCO2 fig1

WCO2 fig2

WCO2 fig3

WCO2 fig4

WCO2 fig5

WCO2 fig6

WCO2 fig7

WCO2 fig8

WCO2 fig9

WCO2 fig10

WCO2 fig11

WCO2 fig12

WCO2 fig13

CO2 plays an important roll for the survival of our planet. Carbon Dioxide is essential for plant photosynthesis and rise of CO2 can be directly linked to the greening of the plant. At the moment climate change and global warming are being presented as a global threat to our species.

According to environmentalists, sea levels and temperatures will rise, resulting in a global breakdown for human civilization. This is based on climate models and numerous environmental studies around the world. According to the IPCC our carbon footprint needs to be reduced. The use of natural gas, oil, coal and any other fossil fuels need to be reduced to zero. The anthropogenic (man-made) influence has to be eliminated to save the planet.

According to some climate models, the planets temperature will increase to a level that will cause drought and famine for a large portion of the population in the very near future. In the future our energy needs will have to be cut so much so that all travel will need to be cut back completely.

In the future only environment friendly approved energy resources will be permitted such as, wind energy, solar energy, geothermal, biomass and hydroelectric as clean alternatives. This would deprive developing nations the possibility of building an economy and developed nations of keeping their economies.

See Also World of Climate Change Infographics

And in Addition

Note that the illustration #10 assumes (as is the “consensus”) that doubling atmospheric CO2 produces a 1C rise in GMT (Global Mean Temperature).  Even if true, the warming would be gentle and not cataclysmic.  Greta and XR are foolishly thinking the world goes over a cliff if CO2 hits 430ppm.  I start to wonder if Greta really can see CO2 as she claims.

CO2 and COPs

It is also important to know that natural CO2 sources and sinks are estimated with large error ranges.  For example this table from earlier IPCC reports:

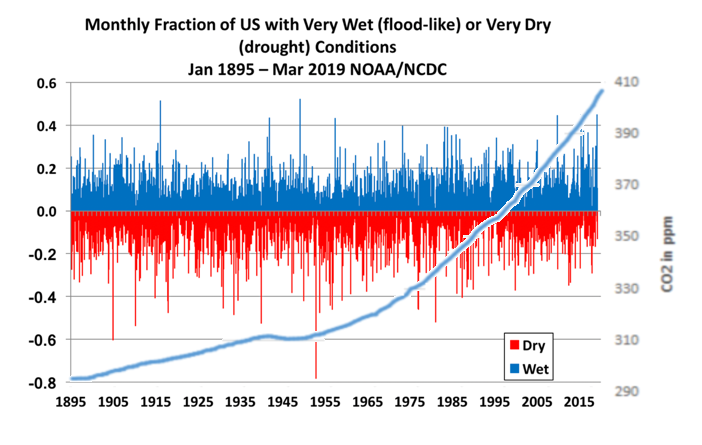
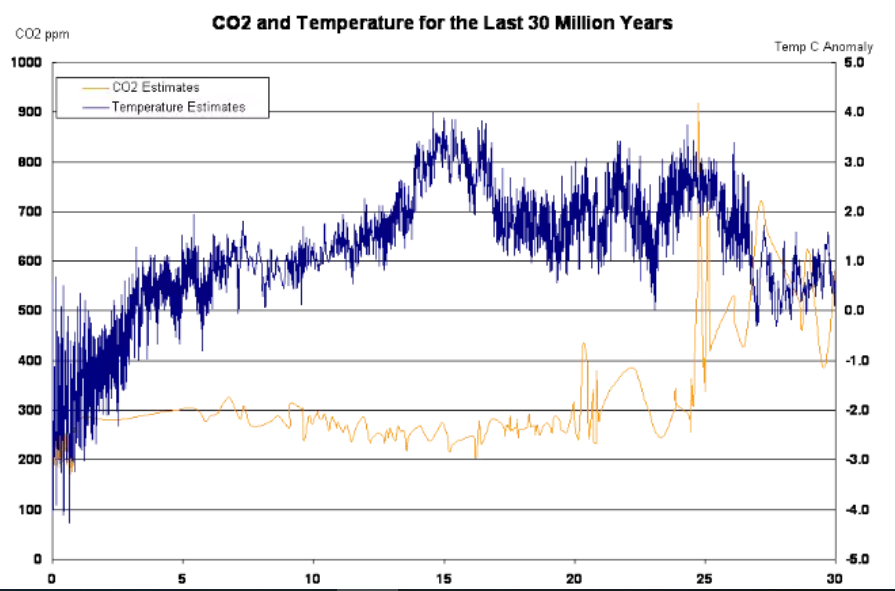
Below are some other images I find meaningful, though they lack Raymond’s high production values.

Biden’s Record Worse than We Feared

gv072721dapr20210727064505

The Editorial Board presents at Issues and Insights Biden’s ‘Accomplishments’ So Far: A Troubling Tale In 8 Charts.  Excerpts in italics with my bolds.

Months after President Joe Biden supposedly “rescued” the country from the COVID-19 pandemic and promised that he’d bring the country together, how is the nation doing? Well, there are several indicators on the rise. Unfortunately, they are all indicators of trouble.

The news Thursday that the GDP gained 6.5% in the second quarter (the first full quarter since Biden signed his American Rescue Plan) is good. But it is well below economists’ forecasts. The Blue Chip Consensus forecast was above 9%, and other surveys pegged Q2 growth at 8.5%. It was also just barely above the gain in Q1 — which was before any of Biden’s policies had taken effect.

Still, other things are on the rise under Biden, too, many of them well above expectations.

The misery index is up, for example, so is inflation, pessimism, and financial stress. Illegal border crossings are up and murders are way up. Oh, and cases of COVID-19 — the disease Biden said he would slay — are increasing again.

Naturally, while taking credit for the good GDP number, the Biden administration is trying to pin the blame for all these other things on President Donald Trump. But how convincing can that be, when Biden ostentatiously broke with just about every one of Trump’s policies and did so in ways that had an immediate effect?

We’ve put together eight charts that help tell this story, starting with the inflation rate.

Even liberal economists were warning that Biden’s spending spree — coming after two historically large stimulus bills under Trump and long after the COVID recession had ended — would set off an inflation spiral. And what do you know? Energy costs, food costs, and the costs of most everything else are climbing at a rapid clip, despite promises from Biden that the current spike is transitory.

inflation-rate-under-biden

While prices are rising, Biden’s unemployment bonuses and other payments to non-workers have kept people from taking jobs. Biden himself all but admitted as much when at a recent town hall, but told employers just to raise their wages. As a result, after falling rapidly under Trump, the unemployment rate has held steady since the beginning of the year.

lb210728cd20210727060246

The combination of high unemployment and soaring prices back in the 1960s gave rise to the Misery Index, which is derived simply by adding the inflation rate to the unemployment rate. As we reported recently, the Misery Index has climbed every month since Biden took office.

misery-index-under-biden-1

Despite the fact that the recession ended more than a year ago, and the economy had already made up most of the ground it lost during the lockdown when he took office, Biden talks endlessly about how he’s “rescued” an economy that was “on the brink.” He then rattles off lots of seemingly cheery statistics, crediting his $1.9 trillion “American Rescue Plan” and other government largesse for them all.

We’ve already detailed how this boast is based on a series of lies. But more to the point, if handing money out willy-nilly was supposed to rescue the economy and make families whole, why are people feeling more financial stress now than they were a few months ago? The IBD/TIPP Financial Stress Index has been on the rise since April.

stress-index-under-biden

Not only are people worried about their current financial condition, but they are also more pessimistic about their prospects for the coming year. An ABC News/Ipsos poll found pessimism about the way things are going shot up from April to July of this year.

pessimism-index-biden

The increase in pessimism and stress could be the result of the fact that wages haven’t been keeping up with inflation. The chart below shows the inflation-adjusted average hourly earnings for private-sector workers so far this year. Notice that this trend is not up.

real-wages-biden

Biden can hardly blame Trump for the sharp rise in violent crime, either, although he and his fellow Democrats keep insisting that it’s all because of insufficiently strict gun control laws. The real cause, of course, has been the demonization of the police by Democrats (up to and including Biden), and the often successful attempts to cut police department funding while hamstringing officers. The result has been a huge increase in murder and assaults in the nation’s major cities.

murders-under-biden

Biden also blames Trump for the crisis at the southern border. But as we’ve written about in this space already, Biden created a crisis where none existed by promising to throw open the border and grant citizenship to millions of people here illegally. Then he put Vice President Kamala Harris in charge of “fixing it,” and started blathering on about “root causes.” The results speak for themselves: an unprecedented flood of illegal immigrants, including unaccompanied children, many of whom are being released into the country.

illegals-under-biden

And to top it off, the one thing people apparently trusted Biden to do was tackle the COVID-19 virus. He said he had a plan. He and his fellow Democrats rushed through a massive new spending bill to carry it out. But now vaccination rates have stalled and new cases are growing again thanks to the Delta variant.

Biden and Co. have been busy trying to pin the blame for this on Republicans, but as we reported recently, it’s minority groups and other Democratic constituencies who are least likely to be vaccinated. And, because Biden has spent so much time raising the hysteria level about COVID, he can’t just admit that this virus will be with us forever and tell people to “live with it,” as Trump once (correctly) advised. Instead, he’s pointing fingers and fumbling about with new mask mandates, forced vaccinations, and other draconian measures.

covid-cases-under-biden

It is true that Biden has been in office for only six months. It’s also true things could turn around. But we don’t see that happening unless Biden changes course.

235762

We have no doubt that Biden was very much hoping one day to tell the public how he killed COVID and saved the economy (just as he once bragged that “Osama bin Laden is dead and General Motors is alive” while he and President Barack Obama where in the White House).

The way things are going right now, Biden might one day have to admit that “the economy is dead, but COVID is alive.”

payn_c18393920210723120100

Footnote:  How to Speak Bidenese

And Now There are Five “Common Cold” Coronaviruses

cg60a31a950a20d

Good news:  The Pandemic is over.  Next: Our immune systems will contend with one more coronavirus added to the other four we already live with.  Ross Pomeroy explains in Real Clear Science articles You Are (Probably) Going to Be Infected With the Coronavirus.  Excerpts in italics with my bolds.

SARS-CoV-2 joins the ranks of other coronaviruses to cause respiratory infections under the title of the “common cold”

It may not be today. It may not be tomorrow. It may not be next week. It may not be this month, when the rapid ascension of the Delta variant in the United States could send confirmed daily case counts spiking to 200,000 or more before settling down again. It may not even be next year. But someday, you will almost certainly be infected with the SARS-CoV-2 coronavirus.

This uncomfortable fact may come as a surprise to many Americans, particularly to those who have spent hours sanitizing surfaces and groceries, who have dutifully adorned a mask even when not required to do so, and who have made the simple, science-backed decision to get vaccinated. SARS-CoV-2 has already spread around the world, infecting hundreds of millions or more. The genie is out of the bottle, and it is not going back in.

“We will be dealing with this virus forever,” Dr. Michael Osterholm, the director of the Center for Infectious Disease Research and Policy (CIDRAP) at the University of Minnesota, said in an interview one year ago.

Osterholm has been a sage throughout the pandemic, and his words then remain prescient now.

“Effective and safe vaccines… will be very important, even critical tools, in fighting it,” he said. “But the whole world is going to be experiencing COVID-19 ‘til the end of time. We’re not going to be vaccinating our way out of this to eight-plus billion people in the world right now…. We’ve really got to come to grips with actually living with this virus, for at least my lifetime…”

Since speaking those words, Osterholm hasn’t changed his mind.

“Eradicating this virus right now from the world is a lot like trying to plan the construction of a stepping-stone pathway to the Moon. It’s unrealistic,” he told Nature in February of this year.

Olsterholm’s view now represents the consensus of scientific opinion. In January, Nature surveyed more than 100 experts working on the coronavirus about whether the virus could be eradicated. Nine out of ten said that it is “likely” or “very likely” that the coronavirus will continue to circulate amongst the human population as an endemic infection. Most see it becoming something like the flu, for which we will require yearly vaccinations to be protected, or joining the ranks of other coronaviruses to cause respiratory infections that collectively fit under the title of the “common cold”. In the latter scenario, people may get reinfected multiple times over their lives. This theory seems the most likely to play out.

“The virus sticks around, but once people develop some immunity to it — either through natural infection or vaccination — they won’t come down with severe symptoms… Scientists consider this possible because that’s how the four endemic coronaviruses, called OC43, 229E, NL63 and HKU1, behave,” Nicky Phillips wrote for Nature.

In either of these scenarios, it’s extremely likely that you will eventually be infected. Adults get the flu about once every five years. Many times they are unaware, because the infection is asymptomatic. By the time children are roughly three years old, 65% will have been infected with coronavirus 229E. It’s reasonable to predict that some years down the road, SARS-CoV-2 will be just as, if not more, prevalent. Even the vaccinated will likely be infected at some point, and that’s okay.

There was some hope that the incredibly effective vaccines we have, particularly BioNTech/Pfizer’s and Moderna’s mRNA shots, would grant sterilizing immunity, preventing infection altogether. And studies suggest that they do, surprisingly well. But it seems that this form of immunity wanes over time and lessens versus new variants, particularly the Delta variety that’s been all over the news of late. The good news is that the vaccines remain extremely protective against severe disease, hospitalization, and death. If and when booster shots are available, we’ll be able to refresh our immunity.

The knowledge that a SARS-CoV-2 infection is essentially inevitable might be, for some, panic-inducing, perhaps prompting a desire to live a bubbled life. It shouldn’t. That’s because we have the tools to be free from both fear and, for the vast majority, harm: America’s remarkable arsenal of safe and effective vaccines. Again, even if the vaccines don’t prevent infection, that’s okay! As of July 26th, less than 0.004% of fully vaccinated people experienced a breakthrough case resulting in hospitalization and less than 0.001% died from the disease, according to the latest data from the US Centers for Disease Control and Prevention.

As Dr. Osterholm said in May, “For vaccinated individuals, in a private home or wherever, party hard. Enjoy it. You’ve earned it. You can feel safe in doing that, and that’s what we need to help people understand.”

Footnote: 

Left out of the discussion were the anti-viral home treatment protocols to prevent serious illnesses.
See How They Dissed HCQ and Ivermectin

How They Dissed HCQ and Ivermectin

asylum-lunatics

An article at Science Defies Politics explains the fallacies in findings intended to disqualify actual C19 therapies in favor of vaccines Fraud and Mistakes in Reviews of IVM and HCQ for C19.  Excerpts in italics with my bolds.

Cochrane was reputable in the past, but is now controlled by pharmaceutical interests.

Cochrane, once respected organization producing systematic reviews of peer-reviewed medical literature, issued a cherry-picked and biased review of Ivermectin for COVID-19, claiming not enough evidence. It is debunked by C19___ as Outdated very biased cherry-picking retrospective meta analysis …

That reminds the Cochrane’s HCQ review, published on Feb. 12, 2021. It was a similar piece of junk science and scientific fraud. This said, it contains three non-obvious methodological mistakes behind such non-positive reviews of Hydroxychloroquine and Ivermectin treatments for COVID-19, which some people might make unintentionally.

Mistake #1:  Selection of randomized control trials (RCTs) and exclusion of observational studies.

RCTs are gold standard for detecting small (like 20%) improvements. However, RCTs are meaningless or even unethical when the treatment improves the odds by 3–6 times, as the case with Hydroxychloroquine and Ivermectin. In such situation, RCTs tend to be small or using the main ingredient incorrectly.

Mistake #2: The same main ingredient can be used in many ways, including different phases of the disease, doses, and additional medications.

A proper review would have identified the best protocol, using the main ingredient, and reviewed the studies using this protocol. This mistake arises from a habit to review pharma-sponsored trials of patented drugs, in which the manufacturer determines the best way to use the drug.

Mistake #3: Reliance on academic papers and exclusion of the real world evidence.

Well, Cochrane cannot be blamed because reviews of literature are what it does, but the users of these reviews should not call them “the scientific evidence” or similar.

From the Cochrane’s HCQ review:

“We performed all searches up to 15 September 2020.” Enough said. They published a review of 13 trials with 9030 participants (including one post-exposure prophylaxis trial) in what was seemed to be the end of the pandemic, with a review cutoff date 5 months earlier.

“Treatment of COVID‐19 disease. We included 12 trials involving 8569 participants, all of whom were adults.” Enough said. By September 2020, millions of people had been treated with Hydroxychloroquine.

“Preventing COVID‐19 disease in people at risk of exposure to SARS‐CoV‐2. Ongoing trials are yet to report results for this objective.”

Cochrane Funding

Cochrane Review receives most of its charitable funding from the governments of the UK, Denmark, Germany, and the US (https://archive.is/AbjHf). It also sells subscriptions, mainly to government-funded universities, to the pharmaceutical and healthcare industries, which are effectively controlled by governments. It is essentially a governmental organization masquerading as an independent non-profit research organization. Cochrane also serves as a partner and source for Wikipedia on medical topics. Many people consult Wikipedia.

The result looks like an echo chamber in a mental asylum!

See also  Ivermectin Invictus: The Unsung Covid Victor

Yes, HCQ Works Against Covid19

pillars-needed-missing

Routine Melting of Arctic Ice in July

The animation shows Arctic ice extents on Day 212 (end of July) for the years 2007 to 2021 (yesterday).  Evidently, there is considerable variation year over year both on the total amount and where the ice is to be found.  The images are from MASIE (Multisensor Analyzed Sea Ice Extent) platform operated by the US National Ice Center (NIC).  More on MASIE can be read at previous post NOAA Loses 1M km2 of Arctic Ice in July

Note that in all years, some regions are open water by day 212:  Sea of Okhotsk (lower left), Bering Sea (lower center). Mostly ice free are Hudson Bay (lower right) and Barents Sea (top left).  Center left along the Russian coastline runs the Northern Sea Route for summertime shipping from Kara Sea (top left) down through the Bering Strait.  As you can see, some years the ice is still plentiful along this route, and other years are almost ice free.  This year, Laptev is largely open water, while Kara (above) and Chukchi (below) still have much ice to challenge the ice breakers.

Of interest also is the Canadian Arctic Archipelago (center right, below Greenland).  Here is found the Northwest Passage by which intrepid sailors seek transit from the Atlantic (right) through to the Pacific by way of Bering Sea.  Again, some years it is open and simple, and other years closed completely.  On day 212, 2021, CAA has more ice than average, so this year could be more challenging than in other recent years.

The graph below shows July daily ice extents for 2021 compared to 14 year averages, and some years of note.

On average, July Arctic ice declines from ~9.7M km2 down to 6.9M km2.  This year Sea Ice Index in orange (SII from NOAA) lost ice rapidly and opened up a deficit to MASIE (in cyan) of ~700M km2.  The last three weeks saw the two indices ending the month close together, slightly below average and matching 2007.  Note that both 2019 and 2020 had much lower extents at end of July.

Why is this important?  All the claims of global climate emergency depend on dangerously higher temperatures, lower sea ice, and rising sea levels.  The lack of additional warming is documented in a post Adios, Global Warming

The lack of acceleration in sea levels along coastlines has been discussed also.  See USCS Warnings of Coastal Flooding

Also, a longer term perspective is informative:

post-glacial_sea_levelThe table below shows the distribution of Sea Ice across the Arctic Regions, on average, this year and 2007.

Region 2021212 Day 212 Average 2021-Ave. 2007212 2021-2007
 (0) Northern_Hemisphere 6621487 6903677  -282190  6344860 276627 
 (1) Beaufort_Sea 899718 776180  123539  760576 139143 
 (2) Chukchi_Sea 563418 526326  37091  382350 181068 
 (3) East_Siberian_Sea 652192 745174  -92982  445385 206807 
 (4) Laptev_Sea 97962 389632  -291669  314382 -216420 
 (5) Kara_Sea 230155 159737  70418  239232 -9077 
 (6) Barents_Sea 37818 32484  5334  23703 14115 
 (7) Greenland_Sea 149142 298586  -149444  324737 -175595 
 (8) Baffin_Bay_Gulf_of_St._Lawrence 143110 136724  6387  94179 48931 
 (9) Canadian_Archipelago 594031 547883  46148  510063 83968 
 (10) Hudson_Bay 113973 151424  -37452  93655 20318 
 (11) Central_Arctic 3139007 3137899  1108  3154837 -15830 

The overall deficit to average is 282k km2, (4%) which matches the deficit in Laptev.  Other places with less than average extents are East Siberian, Greenland Sea and Hudson Bay.  Offsetting these are surpluses in Beaufort, Chukchi, Kara and CAA.