
The animation shows Arctic ice extents on day 248 in 2007 (matching 14 year average), then the same day in 2019, 2020, and yesterday in 2021. Note that Hudson Bay upper left is open water, and below that Baffin Bay next to Greenland is also ice-free. In the center Canadian Archipelago holds a lot of ice, especially this year. Also unusual in 2021 is ice covering Svalbard lower right all the way to Europe mainland. Also upper right 2021 shows ice in Chukchi touching Russian coastline.
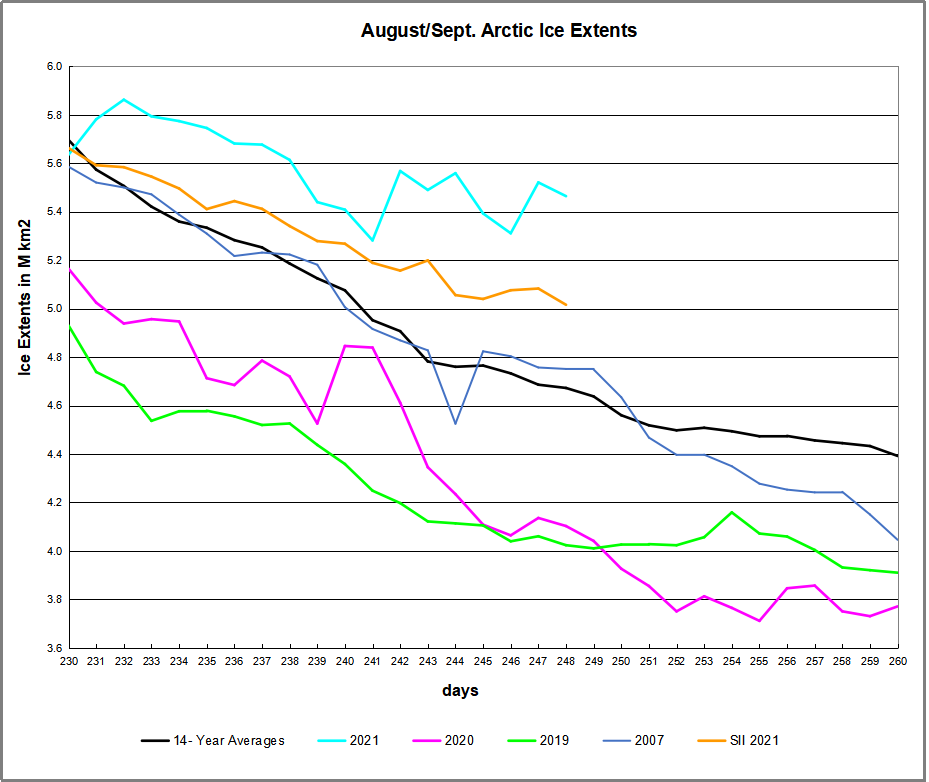
The graph above shows mid-August to mid-Sept daily ice extents for 2021 compared to 14 year averages, and some years of note. During the 17 days from August 18 to yesterday, the black line shows Arctic Ice extent declined on average by 1M km2 (1 Wadham). Meanwhile the cyan line shows MASIE 2021 ice extents lost only 171k km2, and Sea Ice Index (SII) in orange lost 317k km2. Note on day 230 all three lines started at the same value.
Why is this important? All the claims of global climate emergency depend on dangerously higher temperatures, lower sea ice, and rising sea levels. The lack of additional warming is documented in a post Adios, Global Warming
The lack of acceleration in sea levels along coastlines has been discussed also. See USCS Warnings of Coastal Flooding
Also, a longer term perspective is informative:
 The table below shows the distribution of Sea Ice across the Arctic Regions, on average, this year and 2007.
| Region | 2021248 | Day 248 Average | 2021-Ave. | 2007248 | 2021-2020 |
| (0) Northern_Hemisphere | 5464375 | 4672631 | 791744 | 4751076 | 713299 |
| (1) Beaufort_Sea | 798213 | 522472 | 275741 | 665051 | 133162 |
| (2) Chukchi_Sea | 524060 | 202259 | 321800 | 116358 | 407702 |
| (3) East_Siberian_Sea | 408523 | 310662 | 97862 | 6329 | 402195 |
| (4) Laptev_Sea | 51574 | 143286 | -91712 | 280600 | -229026 |
| (5) Kara_Sea | 122087 | 30192 | 91896 | 103072 | 19015 |
| (6) Barents_Sea | 18 | 15631 | -15612 | 10766 | -10748 |
| (7) Greenland_Sea | 98270 | 176374 | -78104 | 334524 | -236254 |
| (8) Baffin_Bay_Gulf_of_St._Lawrence | 16983 | 23131 | -6148 | 31787 | -14804 |
| (9) Canadian_Archipelago | 440366 | 288302 | 152064 | 270755 | 169612 |
| (10) Hudson_Bay | 39285 | 15338 | 23947 | 29961 | 9324 |
| (11) Central_Arctic | 2963852 | 2944150 | 19702 | 2900617 | 63235 |
The overall surplus to average is 792k km2, (+17%). Note large surpluses of ice in BCE (Beaufort, Chukchi and East Siberian seas). Meanwhile Laptev on the Russian coast melted out early, as has Greenland Sea. Kara and CAA (Canadian Arctic Archipelago) are holding considerable ice. We are about 12 days away from the annual minimum mid September, but at this point it appears that extents will be much greater than the last two years.
See also Abundant August Arctic Ice with 2021 Minimum Outlook


Illustration by Eleanor Lutz shows Earth’s seasonal climate changes. If played in full screen, the four corners present views from top, bottom and sides. It is a visual representation of scientific datasets measuring Arctic ice extents.

Always insightful to measure the short view in context with the lo-o-ong view.
LikeLike
Reblogged this on Climate Collections.
LikeLike