In our recently updated Natural Gas Pipeline Projects Tracker, we estimate over 4 billion cubic feet per day (Bcf/d) of new natural gas pipeline capacity entered service in the third quarter of 2021, primarily supplying Gulf Coast and Northeast demand markets.
In the Gulf Coast, three projects either entered service in the third quarter or were partially completed, totaling 3.6 Bcf/d of additional pipeline capacity. These projects connect U.S. natural gas production to growing U.S. export markets. They include:
♦ The Whistler pipeline, completed on July 1, 2021. The new 2.0 Bcf/d pipeline, constructed by NextEra, connects Permian Basin production at the Waha Hub in West Texas to the Agua Dulce Hub in Southeast Texas. The Agua Dulce Hub serves as the supply point for several pipelines that cross the border to supply demand markets in Mexico.
♦ The Acadiana Expansion Project, partly completed as of August 6, 2021. This 894 million cubic feet per day (MMcf/d) expansion on the Kinder Morgan Louisiana intrastate pipeline increases takeaway capacity out of the Haynesville Basin, connecting it to the Sabine Pass LNG terminal. The project is expected to be completed in early 2022.
♦ The Cameron Extension Project, partly completed as of August 12, 2021. This 750 MMcf/d expansion on the Texas Eastern Transmission (TETCO) interstate pipeline delivers feedgas to the Calcasieu Pass LNG terminal, which is currently preparing to start commissioning activities. The project is expected to be completed by the end of this year.
Several other projects have also entered service, increasing supplies to constrained demand markets in the Northeast. In New England, two projects will improve the region’s access to winter supplies of natural gas by over 100 MMcf/d:
♦ The 261 Upgrade Projects completed its second and final phase, entering service on October 6, 2021. With the new, upgraded compressor at Station 261, an estimated 20 MMcf/d of additional natural gas supply can be delivered by the Tennessee Gas Pipeline (TGP) into New England.
♦ Portland Natural Gas Transmission System’s (PNGTS) Westbrook Xpress Project, Phases 2 and 3, entered service on October 21, 2021, increasing natural gas pipeline import capacity from Canada at Pittsburg, New Hampshire, by 81 MMcf/d. The new Westbrook compressor station in Westbrook, Maine, will increase capacity on the co-operated Maritimes Northeast pipeline by 50 MMcf/d.
In addition, the Middlesex Expansion Project entered service in New Jersey on September 28, 2021. This 264 MMcf/d TETCO expansion delivers natural gas—via interconnections with other interstate pipelines—to the 724 megawatt (MW) Woodbridge Energy Center combined-cycle power plant in Woodbridge Township, New Jersey.
Some Bad News
The pipeline project tracker update also includes the cancellation of the 1.3 Bcf/d PennEast Pipeline, which was announced in late September. This 1.3 billion dollar project was designed to bring natural gas supplies from the Appalachia Basin into constrained demand markets in New Jersey and southeastern Pennsylvania.
In total, the Natural Gas Pipeline Projects Tracker includes updates to 25 interstate and intrastate natural gas pipeline projects, including announcements of new projects and estimated dates of completion. We update this resource quarterly; the next update is scheduled for late January 2022.
The PennEast decision was a victory for the opponents that have waged a seven-year campaign against the project. “The announcement that the PennEast pipeline is effectively dead is a huge relief for PennFuture and the impacted communities across the Delaware River watershed who have been tirelessly working to defeat this terrible pipeline,” said Abigail M. Jones, vice president of legal and policy at the environmental advocacy group PennFuture.
Not everyone was pleased with the PennEast decision.
“We are disappointed, although not surprised, to hear that PennEast has decided to cancel the development of this important pipeline project in New Jersey,” Mark Longo, director of the Engineers Labor-Employer Cooperative, said in a statement. “The benefits of the project were clear: It would have provided New Jersey and the entire region with the clean, affordable energy needed to grow our economy. However, many policy makers and special interest groups shamefully fought hard to stop the project and ultimately succeeded, putting the future of our energy infrastructure at risk.”
The Pennsylvania Chamber of Business and Industry lamented the economic impact of the cancelation.
“Activists are cheering upon the recent news that the sponsors of the PennEast project, a more than $1 billion investment that would have delivered Pennsylvania-produced natural gas into markets in New Jersey, have cancelled the project. Let’s be clear: this is no victory — not for ratepayers, who are now lacking a reliable source of gas and electricity; not for the economy, which is now out several thousand well-paying construction jobs at a time when the economy continues to struggle; and not for the environment, as this obstruction results in the mid-Atlantic being more reliant on imported fuels from foreign nations that do not have our strict environmental standards,” said Chamber President and CEO Gene Barr.
The pieces of the puzzle may fit together in ways that you do not expect. For years, the global elite have been openly telling us that one day we will all own nothing, we will have no privacy, and we will be extremely happy with our new socialist utopia. But exactly how do they intend to transition to such a society? Are they going to come and take all of your stuff? Needless to say, there are millions upon millions of very angry people out there that aren’t just going to hand over their stuff to a bunch of socialists. So how are they going to overcome that obstacle?
Well, the truth is that they don’t need to take your stuff to implement their goals. All they need to do is to destroy the value of your money.
If your money becomes worthless, you will start descending into poverty and it won’t be too long before you become totally dependent on the government.
And as the stuff that you have right now wears out, you won’t be able to replace it with the worthless money that you are now holding.
Eventually, you will own virtually nothing, but you probably won’t be very happy about it.
So high inflation is actually a tool that the global elite can use to further their goals.
The good news is that I do not believe that the global elite will ever be able to achieve their utopia.
The bad news is that they won’t be able to achieve their utopia because western society is going to completely and utterly collapse during the times that are ahead.
But as I demonstrated last week, the truth is that inflation is rising much faster than our paychecks are, and that means that our standard of living is going down.
And inflation is one of the big reasons why the University of Michigan Consumer Sentiment Index just hit the lowest level since 2011.
The Federal Reserve has lost control, and 2022 is going to be a very “interesting” year from an economic standpoint.
On Sunday, we learned that the average price of a gallon of gasoline in California has almost reached five dollars…Gasoline prices are going to continue to move higher, and that is really bad news.
Just about everything that we buy has to be transported, and so higher gasoline prices are going to fuel even more inflation.
Sadly, those that are on the bottom of the economic food chain are the ones that are being hurt the most. At this point, many food banks are really struggling to purchase enough food because price hikes have become so severe…
So many problems have converged all at once. Some have used the term “a perfect storm” to describe what we are facing, and I think that is definitely quite appropriate.
If you are waiting for life to “get back to normal”, you are going to be waiting for a very long time. As MN Gordon has noted, pre-2020 prices are now gone forever…
But sooner or later, this is what socialist regimes always do. They tell us to study hard, get a good job and work as hard as we can. And then they give our money to people that haven’t done any of those things.
Eventually they run out of other people’s money, and so then they just start wildly creating more.
Unfortunately, every time that this has been tried throughout history it has always ended in disaster, and now it is our turn.
Presidents have little power to bring down rising prices.
History shows the public doesn’t care.
Left unspoken was a chilling reminder from history: Inflation has a unique power to kneecap a presidency. Incumbent presidents and their parties do not do well at all when inflation (and attempts to cure it) are on voters’ minds come election time. The gas pump, the supermarket check-out counter, the heating bill, the sticker on the windshield, provide — or seem to provide — powerful indictments against the party in charge.
If that’s not enough to unsettle the White House and its allies, consider this: Presidents have almost no power to ease the pain of inflation, and the voting public cuts presidents no slack at all because of that impotence. Look into the toolbox of our country’s chief executive and you’ll find it empty of effective tools, filled instead with devices now obsolete or laughable or meaningless or politically destructive.
But if you’re looking for a president who did in fact do something to tame inflation — albeit indirectly — it was Jimmy Carter. When he appointed Paul Volcker as chair of the Federal Reserve Board, he put someone in a position of real power who was determined to fully exercise that power, no matter the consequences.
With an inflation rate in 1980 of more than 13 percent — “It was the biggest inflation and the most sustained inflation that the United States had ever had,” Volcker recalled — he led the Fed to a historic tightening of the money supply. Interest rates rose vertiginously; at one point the prime rate hit 21 percent. The consequences were dramatic and ugly — a recession more severe than any since the Great Depression. Four million workers lost their jobs.
The “stagflation” — a toxic combination of inflation and unemployment — helped send Carter down to a landslide defeat in 1980. By 1982, the unemployment rate hit 10 percent, a number high enough to cost Republicans 27 seats in the House. By 1984, however, unemployment was moving in the right direction, dropping to just over 7 percent. Economic growth was over 7 percent, inflation had dropped to under 4 percent — and Ronald Reagan won a 49-state re-election.
The United Sates has not faced a genuinely worrisome inflation rate since, and that’s another source of pain for Biden and his party. Americans have had no experience in decades with prices rising across the board; a 6 or 7 percent inflation rate is nothing compared to the Carter era, but it looks particularly worrisome compared with the recent past.
If Biden’s advisors are right, 2022 will see the lessening of inflation, as goods flow into the stores and automobile lots where cash-flushed customers will no longer bid up the costs of scarce items. But that’s more of a hope than a certainty; the White House description last summer of the “transitory” nature of this inflation seems a lot less convincing now, and the prospect of Christmas season with high priced or unavailable goods and sharply higher fuel costs does not bode well for the president’s already-sinking approval numbers.
Footnote: Road to Serfdom
In ‘The Road to Serfdom’ F. A. Hayek set out the danger posed to freedom by attempts to apply the principles of wartime economic and social planning to the problems of peacetime. Mises Institute provides a text in pdf format here
Arctic Ice Extent reaching 10 million km2 is a milestone marking recovery of half the ice lost last spring and summer. Each year the max extent is ~15M km2 and the mid-September min is ~5M km2. This year in just two months the ice gained back half the ice lost in the six months prior to mid September. The metric 1 Wadham = 1Mkm2 ice extent is in recognition of the professor who declared the Arctic would be ice-free before 2011, by which he meant less than 1M km2 extent.
The animation shows Arctic ice extents this year for the last two weeks, from day 304 (Oct. 31) to day 319 (Nov. 15). Note on the right side, the Russian shelf seas (from top: East Siberian, Laptev, Kara) were already ice covered. At top center, Chukchi adds 200k km2 to reach 90% of max last March. Top left, Beaufort sea fills in to 98% of its March max. Center left is Canadian Arctic Archipelago adding 267k km2 to reach 96% of its max. Lower left shows Baffin Bay and Gulf of St. Lawrence adding 400k km2 up to 67% of its max. .At the bottom center Barents Sea grows 231k km2 to reach 63% of its max.
The graph below shows Oct./Nov. daily ice extents for 2021 compared to 14 year averages, and some years of note:
The black line shows during this period on average Arctic ice extents increase ~3.5M km2 from ~6.3M km2 up to ~9.8M km2. The 2021 cyan MASIE line started the period ~400k km2 above average and on day 319 retained a surplus of ~380k km2. The Sea Ice Index in orange (SII from NOAA) started with the same deficit, then lagged behind in the first two weeks, before ending ~200k km2 lower than MASIE (no data yet for yesterday). 2019 and 2020 were well below average at this stage of the ice recovery.
Why is this important? All the claims of global climate emergency depend on dangerously higher temperatures, lower sea ice, and rising sea levels. The lack of additional warming is documented in a post Adios, Global Warming
The table below shows the distribution of Sea Ice on day 304 across the Arctic Regions, on average, this year and 2020.
Region
2021319
Day 319 Average
2021-Ave.
2020319
2021-2020
(0) Northern_Hemisphere
10136298
9754986
381313
9171330
964968
(1) Beaufort_Sea
1052365
1064248
-11883
1068490
-16125
(2) Chukchi_Sea
868672
614315
254357
539677
328995
(3) East_Siberian_Sea
1087137
1073635
13503
1078789
8349
(4) Laptev_Sea
897827
897084
743
889358
8468
(5) Kara_Sea
711109
637483
73626
450888
260220
(6) Barents_Sea
286732
145188
141544
15590
271142
(7) Greenland_Sea
404108
466229
-62120
502768
-98659
(8) Baffin_Bay_Gulf_of_St._Lawrence
511295
532632
-21337
446719
64575
(9) Canadian_Archipelago
824385
852284
-27899
854597
-30212
(10) Hudson_Bay
155801
248736
-92935
256849
-101047
(11) Central_Arctic
3216117
3168700
47417
3046118
169999
The overall surplus to average is 381k km2, (4%). Note large surpluses of ice in Chukchi, Barents and Kara Seas, as well as Central Arctic. The main deficits to average are in Greenland Sea and Hudson Bay, the latter being a shallow basin that will freeze over quickly once it starts. Note that 2021 ice extent exceeds that of 2020 by nearly a full Wadham, most of the difference being in Chukchi, Kara, Barents and Central Arctic.
Illustration by Eleanor Lutz shows Earth’s seasonal climate changes. If played in full screen, the four corners present views from top, bottom and sides. It is a visual representation of scientific datasets measuring Arctic ice extents.
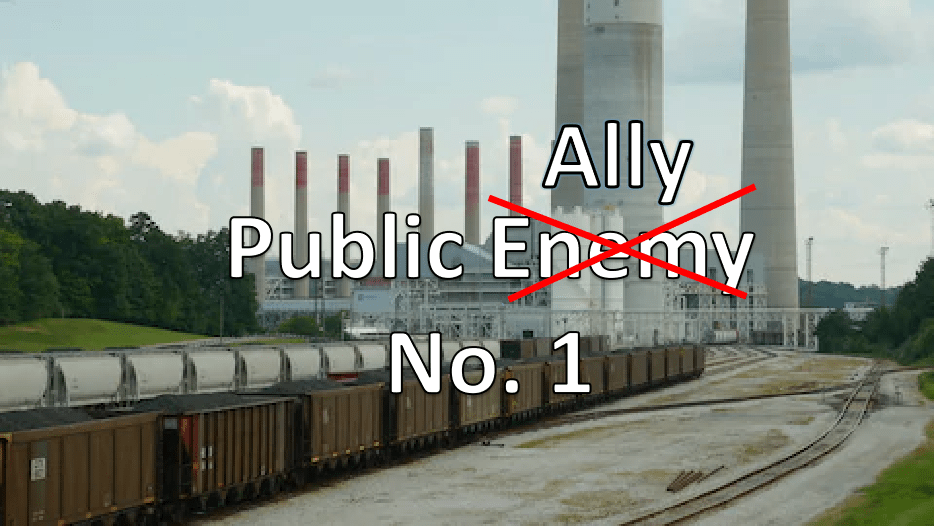
You’ve heard the pronouncements: “Coal Is Dead and Oil Is Next.” “Glasgow is the Death Knell for the Coal Industry” (Boris Johnson). “Coal is declining sharply, as financiers and insurance companies abandon the industry” (Yale360) “Parties to accelerate efforts towards the phase-down of unabated coal power” (COP26 agreement). The unspoken reality is the opposite: Demonizing coal has increased coal consumption. MISH explains in his article The Big Green Push to Get Rid of Coal Had the Opposite Effect. Excerpts in italics with my bolds.
An alleged big win to eliminate coal turned into a bust and then some.
Investors Pushing Mining Giants to Quit Coal is Backfiring
It was supposed to be a big win for climate activists: another of the world’s most powerful mining companies had caved to investor demands that it stop digging up coal.
Instead, Anglo American Plc’s exit from coal has become a case study for unintended consequences, transforming mines that were scheduled for eventual closure into the engine room for a growth-hungry coal business.
And while it’s a particularly stark example, it’s not the only one. When rival BHP Group was struggling to sell an Australian colliery this year, the company surprised investors by applying to extend mining at the site by another two decades — an apparent attempt to sweeten its appeal to potential buyers.
Now, after years of lobbying blue-chip companies to stop mining the most-polluting fuel, there’s a growing unease among climate activists and some investors that the policy many of them championed could lead to more coal being produced for longer.
BHP may end up holding on to the Australian mine it was battling to sell, Bloomberg reported last week. Earlier this year, Glencore Plc sounded out a major climate investor group before announcing it would increase its ownership of a big Colombian coal mine, according to people familiar with the matter.
India now burns more coal than Europe and the U.S combined and miners are betting on rising demand over the next decade from countries such as Vietnam, Bangladesh and Indonesia, although pollution concerns and cheaper alternatives threaten to derail those plans.
Tough to Eliminate Coal
The push to abandon coal made selling the mines difficult. So companies chose to extend their life.
Developing countries that invested in coal-powered electrical plants that have many years of useful life want reparations to develop new plants.
New wind and solar plants are cheaper but unreliable. And they are not cheaper than plants already built.
Moreover, wind can die for days and solar has on average 12 hours a day of outages.
This places additional capital investment requirements for countries to build energy storage facilities.
China alone is currently building or planning coal power plants that are the equivalent of six times Germany’s entire coal burning capacity.
It’s tough to get rid of coal when you build more coal plants than you retire.
Previously in August Victor Davis Hanson suggested several theories that might explain how Biden’s administration has destroyed everything they touch. A summary of that essay is reprinted later on, but this post presents another possible explanation. James Lewis writes at American Thinker Biden’s cobra presidency. Excerpts in italics with my bolds.
Have you noticed how Joe Biden says he wants to lower gas prices, so he cancels the Keystone pipeline?
He wants to lower unemployment, so he pays people not to work?
He wants to beat inflation, so the Fed prints more money?
Biden is President Perverse.
The Cobra Effect is economics slang for “perverse incentives.” If you give your kid money every time the kid misbehaves, that’s a perverse incentive. Every parent knows that mandates are perverse. You don’t give your teenager money to buy cocaine. (Or maybe Joe does.)
Conservatives wonder if Joe’s brain is beyond its sell-by date, but that isn’t quite right.
The resident of 1600 Pennsylvania Ave isn’t just failing; he does the opposite of a competent president. He’s perverse.
The Cobra Effect is a sort of an economics joke based on the story that New Delhi had too many cobras at one time, so the city paid a bounty for dead cobras. Then smart Indian people started to raise more cobras to get the bounty, the opposite of the intended outcome. Economists use that story to explain economic stupidity.
But Joe Biden has topped stupid and is now the most deliberately perverse POTUS in history. It’s the only explanation I can think of.
Do you want to stop racism? Teach people how to hate white folks. Are you laughing yet, America?
These are angry, bitter, hateful people with more than a little sadistic glee in their makeup.
Almost everything Joe Biden has touched since entering office has turned to dross. None of his blame-gaming, none of his distortions, none of his fantasies and unreality can mask that truth. [For details on the listed failures see the article linked in red.]
The Afghan Catastrophe
The Inflation Fiasco
The Border Disaster
Energy Insufficiency
The Race Calamity
The Crime Explosion
So why does Biden so willfully exercise this destructive touch that blows up anything he taps?
There are several possible theories:
1) Biden is non compos mentis. He has no idea of what he is doing. But to the degree he is alert, Biden listens—sort of—only to the last person with whom he talks. And then he takes a nap. When Afghanistan blows up or inflation roars or the border becomes an entry door, his eyes open, and he becomes bewildered and snarly—like an irritable and snappy Bruce Dern waking up in “Once Upon a Time in Hollywood.”
Biden has no clue about the actual destructive implementation of his toxic policies, and no concern upon whom these destructive agendas fall. He vaguely assumes a lapdog left-wing media will repackage every Biden incoherence as Periclean, and every daily “lid” as Biden’s escape for presidential research, deep reading, and intensive deliberation. Biden appears to be about where Woodrow Wilson was in November 1919.
2) Or is Biden a rank opportunist and thinking he will ride woke leftism as the country’s new trajectory? He resents his prior subservience to Obama, and now feels he can trump past signature leftist administrations as the one true and only socialist evolutionary. He is not so much the manipulated as the manipulator.
Biden fantasizes himself as a hands-on dynamic leader who bites at reporters, snaps from the podium, and issues his customary interjections. He is therefore “in command” for four or five hours a day. He enjoys acting more radical than Elizabeth Warren, Kamala Harris, Bernie Sanders, or “the squad.”—and especially being far more leftwing than his old and now passé boss Barack Obama. Joe is in control and that explains the dross touch. For the first time in his life, such an incompetent has complete freedom—to be powerfully incompetent. Biden is then not demented as much as delusionally running things.
3) Biden is unfortunately what he always was: a rather mean-spirited plagiarist, liar, and nihilist, from his Clarence Thomas character assassination infamy and Tara Reade groping to his foul racist talk and his monumental habitual grifting. His disasters are the same old, same old Biden trademark, performance-art screw-ups.
Biden likes the idea of conservative outrage, of chaos, of barking at everyone all the time. Biden accepts that no omelets can be made without broken eggs, and sort of enjoys screwing up things, as Robert Gates and Barack Obama both warned. “Wokening” the Joint Chiefs of Staff, encouraging hundreds of thousands to pour across the border, and abandoning our NATO allies in Afghanistan—who cares when tough guy, brash-talking Joe on the move jumbles stuff up? The disasters in the economy, foreign policy, crime, energy, and racial relations? Biden is just shaking things up, stirring the pot, baiting people to watch Mr. “Come On, Man” in action, as he blusters and preens and leaves a trail of destruction in his wake.
4) Biden is nothing much at all. He’s just a cardboard-cut out, a garden-variety Democratic Party hack, who is against anything conservatives are for. He assumes he will undo all that Trump did, on the theory it is simple and easy for him in his lazy, senior moments. And he is tired anyway of thinking much beyond such Pavlovian rejectionism. A closed border is bad; presto, open borders are good. Improving race relations is bad; deteriorating relations must be good. Energy independence bad; dependency good. Biden works on autopilot in his minimalist day job: just cancel anything that Trump did and worry nothing about the effects on the American people
5) Biden is a hostage of both the Left and Hunter Biden. His task is to ram down a hard Left agenda, in the fashion of a torpedo that itself blows up when it hits the target. The Left ensured the base would not bolt in 2020. So, he owes them. Biden, more or less, signed his presidency over to the squad, Nancy Pelosi, Bernie Sanders, and the Obama holdovers. They hand him a script; he tries to read it; and they follow up with the details. He is the old “Star Trek’s” tottering John Gill.
The Left may hope their own nihilist agenda sort of works. When it inevitably does not, then Joe, the delivery man, is blamed: so much more quickly, then, will be Biden’s necessary exit. They kept their part of the bargain by getting the basement denizen elected. Now he keeps the deal by handing over the presidency. Biden’s utility had about a six-month shelf life.
Now ever so slowly the leaks, the West Wing backstabbing, the furrowed anchor brows, and the unnamed sources will gently ease him out with 25th Amendment worries (e.g., “Perhaps President Biden might find taking the Montreal Cognitive Assessment of some value after all, for his own benefit, of course.”) Kamala Harris is not so inert as we are led to believe.
A cognitively challenged Biden then is pulled in every direction, by his own senility, by left-wing politicos collecting their debts, by his own spite, by his trademark narcissism, and by his neanderthal hatred of everything Trump was and did.
The problem for America is that theories one through five are not always mutually exclusive, but more likely force multipliers of the present insanity. At some point, some brave congressional representative or Senator will finally have to say to Biden, in the spirit of Oliver Cromwell and Leo Amery:
“You have sat too long here for any good you have been doing. Depart, I say, and let us have done with you. In the name of God, go!”
My Comment
It should also be noted that Biden governance follows the classical pattern for leftist autocracies. The massive spending programs already enacted and proposed serve not only to greatly expand the federal bureaucracy but also to perversely make the population financially dependent on government largess. Down the line such dependency ensures compliance with diktats constraining citizen’s rights and freedoms. Trotsky explained how the Soviets got there by nationalizing the means of production.
In a surprising interview, Bill Gates said the following: “We didn’t have vaccines that block transmission. We got vaccines that help you with your health, but they only slightly reduce the transmission. We need new ways of doing vaccines.”
It’s odd how he speaks of medicines as if they are like software. Try it out, observe how it works. When you find a problem, put the technicians to work. Every new iteration is an experiment. Free to try until you finally buy. Surely over time, we’ll find the answer to the problem of blocking or blotting out pathogens.
Software. Hardware. Applications. Subscriptions! This is how he thinks, as if the human body and its deadly dance with viruses is a recent problem and we are only at the very beginning of finding solutions, without realizing that this reality has been present for the whole of human existence and that we had tremendous success in the course of the 20th century minimizing bad pathogenic outcomes without his guidance and benefaction.
Essentially, he has long promoted the idea that traditional public health praxis was for the analog age; in the digital age, we need government planning, advanced technology, mass surveillance, and the ability to control human beings the way a software company manages personal computers.
Most people have no idea how such a rich and smart person could be so dim on essential matters of complex cell biology. Hacking the human body, improving it with uploads and downloads, is surely a more ominous challenge than inventing and managing man-made computers. So herein I try to present the reasons for Gates’s way of thinking.
Let’s travel back in time to examine his career at Microsoft and his shepherding into existence the Windows operating system. By the early 1990s, it was being billed as the essential brain of the personal computer. Security considerations against viruses were not part of its design, however, simply because not that many people were using the internet so the threat level was low. The browser was not invented until 1995. Security of personal computers was not really a question that Microsoft had dealt with.
The neglect of this consideration turned into a disaster. By the early 2000s, there were thousands of versions of malware (also called bugs) floating around the internet and infecting computers running Windows worldwide. They ate hard drive. They sucked out data. They forced ads on people. They invaded your space with strange popups. They were wrecking the user experience and threatening the future of an entire industry.
The problem of malware was dubbed viruses. It was a metaphor. Not real. It’s not clear that Gates ever really understood that. Computer viruses aren’t anything like biological viruses. To maintain a clean and functioning hard drive, you want to avoid and block a computer virus at all costs. Any exposure is bad exposure. The fix is always avoidance until eradication.
With biological viruses, we have evolved to confront them through exposure and let our immune system develop to take them on.
A body that blocks all pathogens without immunity is a weak one that will die at the first exposure, which will certainly come at some point in a modern society. An immune system that confronts most viruses and recovers grows stronger. That’s a gigantic difference that Gates never understood.
Regardless, the advent of the army of computer pathogens fundamentally threatened his proudest achievement. Microsoft frantically searched for a solution, but the creativity of the malware army moved too fast for its engineers.
Others sensed an opportunity. Companies specializing in anti-virus software had been doing business since the 1990s but grew more sophisticated in the early 2000s. Once the internet became fast enough, these software packages could be updated daily. There were ever newer companies, each with a different method and a different marketing and pricing model.
Eventually, the problem was mostly solved on the personal computer, but it took ten years. Even now, Microsoft’s products are less protected than Apple’s, and Microsoft has yet to come close to mitigating the problem of spam on its own native email client.
In short, keeping viruses out of computers constitutes the single biggest professional struggle in Gates’ life. The lesson he learned was that pathogen blocking and eradication was always the path forward. What he never really understood is that the word virus was merely a metaphor for unwanted and unwelcome computer code. The analogy breaks down in real life.
After finally stepping back from Microsoft’s operations, Gates started dabbling in other areas, as newly rich people tend to do. They often imagine themselves especially competent at taking on challenges that others have failed at simply because of their professional successes. Also by this point in his career, he was only surrounded by sycophants who would not interrupt his descent into crankiness.
And what subject did he pounce on? He would do to the world of pathogens what he did at Microsoft: he would stamp them out! He began with malaria and other issues and eventually decided to take on them all. And what was his solution? Of course: antivirus software. What is that? It is vaccines. Your body is the hard drive that he would save with his software-style solution.
At the beginning of the pandemic, I noted that Gates was pushing hard for lockdowns. His foundation was now funding research labs the world over with billions of dollars, plus universities and direct grants to scientists. He was also investing heavily in vaccine companies.
Early on in the pandemic, to get a sense of Gates’s views, I watched his TED talks. I began to realize something astonishing. He knew much less than anyone could discover by reading a book on cell biology from Amazon. He couldn’t even give a basic 9th-grade-level explanation of viruses and their interaction with the human body. And yet here he was lecturing the world about the coming pathogen and what should be done about it. His answer is always the same: more surveillance, more control, more technology.
Once you understand the simplicity of his core confusions, everything else he says makes sense from his point of view. He seems forever stuck in the fallacy that the human being is a cog in a massive machine called society that cries out for his managerial and technological leadership to improve to the point of operational perfection.
The rich, their pretenses, their influence: sometimes charming, sometimes beneficent, sometimes deeply malicious. Gates’s influence over epidemiology has been tremendously baneful, but it’s unclear whether he even knows it. In fact, I don’t think that he does. In some ways, that’s even more dangerous.
Readers might be quick to point out that Gates has benefited enormously from lockdowns and vaccine mandates, both seeing his former company grow to enormous size and from his stock ownership in vaccine makers. So yes, his ignorance has been rewarded handsomely.
As for his influence on the world, history will not likely be forgiving.
A previous series of posts here provided the case made by David Stockman against the IPCC hurryup agenda (David Stockman: Resist the GreenMageddon). It is a dangerous delusion that you can convert in a decade an energy platform that evolved over 200 years. And particularly wrongheaded to start by stopping energy supplies without anything replacing them. As put recentlyby Bill Blain (excerpts in italics with my bolds):
What COP26 protests highlights is how polarised Green politics are on collision course with the economy and growth. It’s going to take years to wean the economy off fossil fuels, but protestors will demand it happens now! Governments have politically committed themselves to a Green future, but are only just waking up to the reality of the need to transit from fossil fuels to renewables – which isn’t feasible without a long-term plan.
Much as I admire the passion of green campaigners, the current volatility of energy pricing demonstrates a massive underlying transition problem and political naivety.
We can’t fundamentally change energy provision overnight. Climate protesters furious this generation have “stolen” their futures will be even less happy if they succeed in reversing economic growth. The result will be to ensure billions of children as yet unborn don’t just face rising temperatures and sea-levels, but also chronic poverty, unemployment, starvation, migration and rising conflict over the environment – water being the primary threat.
While “democratic” western nations may embrace Degrowth populism – nations like China will not.
It doesn’t need to be a frying pan vs fire choice, but that’s not the way popular politics work.
A proposal to bring both nuclear power and natural gas into the bloc’s green finance taxonomy is circulating in Brussels. The paper has been branded as a “scientific disgrace” by campaigners who warned it would damage the EU’s credibility on green finance.
The so-called “non-paper”, obtained by EURACTIV, lays out detailed technical criteria for gas to qualify as a transitional activity under the EU’s sustainable finance rules.
To qualify as a “sustainable” investment, gas power plants or cogeneration facilities must not emit more than 100 grams of CO2 equivalent per kilowatt-hour, according to the draft paper.
It comes in the wake of declarations by European Commission President Ursula von der Leyen, who said the EU executive would soon table proposals on gas and nuclear as part of the bloc’s green finance rulebook.
“We need more renewables. They are cheaper, carbon-free and homegrown,” von der Leyen wrote on Twitter after an EU summit meeting two weeks ago where leaders debated the bloc’s response to rising energy prices.
“We also need a stable source, nuclear, and during the transition, gas. This is why we will come forward with our taxonomy proposal,” she added.
Gas as a ‘transitional activity’
The 100gCO2 emissions criteria is the same as earlier proposals circulated last year, which were rejected as too stringent by a group of 10 pro-gas EU countries who threatened to veto the proposal.
To assuage critics concerns, the paper lays out additional criteria for gas plants to qualify as a “transitional activity”, accompanied by a sunset clause (until 31 December 2030) for the commissioning of new plants.
For gas power plants, these are the criteria to qualify as a “transitional activity”:
Direct emissions are lower than 340gCO2/kWh, and
Yearly emissions are lower than 700 kgCO2/kW.
For cogeneration plants, these are the criteria to qualify as a “transitional activity”:
Life-cycle emissions are lower than [250-270] gCO2e per kWh, and
Primary energy savings of 10% compared with the separate production of heat and electricity.
Campaigners denounced those criteria as “radically weaker” than previous plans drafted by the European Commission.
“This proposal is a scientific disgrace that would deal a fatal blow to the taxonomy,” said Henry Eviston, spokesman on sustainable finance at WWF European Policy Office.
Campaigners were unsure about the origin of the non-paper. But diplomats who spoke to EURACTIV at an EU summit two weeks ago said France has been working behind the scenes to forge a compromise on the taxonomy that would satisfy supporters of gas and nuclear power.
At the initiative of Paris, representatives from like-minded EU countries held a meeting on 18 October to debate nuclear and natural gas in the context of the taxonomy, the EU diplomat said. The meeting was attended by Bulgaria, Cyprus, Czechia, Finland, France, Greece, Hungary, Malta, Poland, Romania, Slovakia, and Slovenia.
According to the same diplomatic source, participants discussed compromise proposals for technical criteria to assess the sustainability of gas and nuclear power plants.
Nuclear
On nuclear, the “non-paper” builds on the EU’s Joint Research Centre (JRC) recommendations, which concluded in a July report that nuclear power was safe and therefore eligible for a green label under the taxonomy.
The paper does not propose detailed sustainability criteria at this stage and merely divides nuclear power production activities into four categories:
Nuclear plant operation: Production of electricity, including the construction, commissioning, operation and decommissioning of nuclear power plants.
Storage or disposal of radioactive waste or spent nuclear fuel (enabling activity).
Mining and processing of uranium (enabling activity).
Reprocessing of spent nuclear fuel (enabling activity).
The “non-paper” comes in the wake of a meeting of EU energy ministers last week where twelve EU countries spoke in favour of nuclear’s inclusion in the taxonomy.
Thanks to Bill Gates we have this helpful graph showing the progress of human civilization resulting from shifts in the mix of energy sources.
Before the 19th century, it is all biomass, especially wood. Some historians think that the Roman Empire collapsed partly because the cost of importing firewood from the far territories exceeded the benefits. More recently, the 1800’s saw the rise of coal and the industrial revolution and a remarkable social transformation, along of course with issues of mining and urban pollution. The 20th century is marked first by the discovery and use of oil and later by natural gas. Since the chart is proportional, it shows how oil and gas took greater importance, but in fact the total amount of energy produced and consumed in the modern world has grown exponentially. So energy from all sources, even biomass has increased in absolute terms.
Abstract: There are lessons from recent history of technology introductions which should not be forgotten when considering alternative energy technologies for carbon dioxide emission reductions. (Synopsis is at the Footnote red link)
Abstract
Considering the urgency of the ongoing COVID-19 pandemic, detection of various new mutant strains and future potential re-emergence of novel coronaviruses, repurposing of approved drugs such as Ivermectin could be worthy of attention. This evidence-based review article aims to discuss the mechanism of action of ivermectin against SARS-CoV-2 and summarizing the available literature over the years. A schematic of the key cellular and biomolecular interactions between Ivermectin, hostcell, and SARS-CoV-2 in COVID-19 pathogenesis and prevention of complications have been proposed.
Summary (from Jo Nova)
Three ways to stop that virus getting in:
Ivermectin binds to the spike (at leucine 91), but it also binds to our ACE2 receptors as well (at histidine 378). It clogs up the lock-and-key from both ends, and when compared to Remdesivir and hydroxychloroquine, ivermectin bound more strongly to the spike than any of them.
“The free binding energy of the spike protein (open) was higher in Ivermectin (−398.536 kJ/mol) than remdesivir (−232.973 kJ/mol).” (Ewaes 2021) In this case “higher” means more negative. The higher it is, the more strongly something binds. Negative binding energies mean that binding is spontaneous, and doesn’t need an external energy source.
Ivermectin also binds to TMPRSS2 — it’s not a celebrity molecule like ACE2 — perhaps because someone didn’t think through the PR campaign and call it “Empress2” or something pronounceable — but it is just as important apparently as ACE2. It seems SARS-2 can’t get into cells which have ACE2 on the surface but don’t also have the TMPRSS2 enzyme there as well (Parmar 2021). Think of TMPRSS2 as a pair of secateurs wandering around the cell surface that need to prune the Covid spike before it can use ACE2 to get into a cell. TMPRSS2 is the not so catchy name for Transmembrane serine protease 2.
Ivermectin also had the highest binding affinity for TMPRSS2. By binding so well to all three — the spike, the ACE2 receptor and the TMPRSS2 secateurs that prune or prime the spike, ivermectin makes it much harder for the virus to get inside a cell.
Once inside a cell, the virus gains access to most resources and tools it needs to produce “baby viruses”, but there’s much more strategy to this war than just a hijacking. Some viral proteins will be sent like trojan gifts to get inside the cell nucleus — which is effectively the command centre. To get through the locked “gates” into the nucleus, these proteins must get tagged by two labels called importin-α and importin-β — they mark “the cargo” as something headed for the nucleus. But ivermectin also binds to importin-α, competing with it for spots, and again foiling the virus, clogging up the system and making it hard for SARS2 to send these proteins through the gates.
This is especially important because the nucleus will send out warning signals to other cells — and the viral proteins aim to stop that alarm system being triggered.
Ivermectin is a multipronged anti-inflammatory
The Covid virus isn’t the only virus that attacks our interferon signally system, though it is a real hallmark of SARS-2, and ultimately the virus wreaks havoc with cytokines on many levels. Luckily ivermectin also works on several parts of the immune network and mostly the effect appears to be to slow down the key amplifiers that tend to run off the rails in bad Covid infection. Sorry, immunology is acroynm-hell, so bear with me, you’ll get some idea of just how many pathways are affected. For starters, ivermectin slows down the Toll- like-Receptor-4 (TLR4)– these are ancient guards that have been around for a long time. They watch out for signs of spare parts of both bacteria and viruses and even just chemicals that are bad, and have a “pivotal role as an amplifier”. We need our TLR4, we just don’t want it to get “stuck on”.
Strap yourself in, there is so much more. Ivermectin also blocks the NF-κB pathway (Nuclear Factor-κB). It suppresses the Akt/mTOR signalling, which inhibits PAK1 which reduces STAT3 and IL-6. STAT3 induces C-reactive protein (or CRP), so less STAT3 means less CRP. These are big names in the world of immunology. Your doctor measures your CRP as a sign of inflammation. People interested in living longer talk about the mTOR system — it’s a is a kind of master controller for the whole cell cycle. Meanwhile IL-6, or interleukin 6 is another messenger that goes “inflammatory” in diseases like diabetes, depression, Alzheimers, and atherosclerosis. Obviously, it’s better to face Covid without having “raised inflammatory markers” at the start.
The safety tests have already been done
If ivermectin was a new drug discovery, and we read this paper, we might be spooked that ivermectin is so intimately and intricately involved with our core biochemistry. Wise researchers might warn that it may have significant unpredictable side effects and we should research it carefully — but most of those tests have already been done. Thanks to 30 years of mass human use with 3.8 billion doses we are aware there are only a few situations where ivermectin is dangerous, and doctors know all about that. People can still do damage through overdosing. Doses always matter. Ivermectin can bind to our GABA receptors if it can get across the blood brain barrier. In normal healthy people the blood-brain-barrier is intact and and the drug is actively excluded. Doctors should be free to prescribe this “off label”.
Fig. 1 A schematic of the key cellular and biomolecular interactions between Ivermectin, host cell, and SARS-CoV-2 in COVID19 pathogenesis and prevention of complications.
Ivermectin; IVM (red block) inhibits and disrupts binding of the SARS-CoV-2 S protein at the ACE-2 receptors (green). The green dotted lines depict activation pathways and the red dotted lines depict the inhibition pathways.
The TLR-4 receptors are directly activated by SARS-CoV-2 and also by LPS mediated activation (seen during ICU settings) causing activation of NF-Kb pathway and MAP3 Kinases leading to increased intranuclear gene expression for proinflammatory cytokines and chemokines (responsible for cytokine storm) and NO release (responsible for blood vessel dilatation, fluid leak, low blood pressure, ARDS and sepsis).
The NF-Kb and STAT-3 pathway activation is central to the pathogenesis and sequelae of COVID-19. STAT-3 physically binds to PAK-1 and increases IL-6 transcription. The annexin A2 at the cell surface converts plasminogen; PLG to plasmin under the presence of tPA. Plasmin triggers activation and nuclear translocation of STAT-3. An upregulation of STAT-3 stimulates hyaluronan synthase-2 in the lung cells causing hyaluronan deposition leading to diffuse alveolar damage and hypoxia.
STAT-3 also directly activates TGF-beta initiating pulmonary fibrosis; a typical characteristic of SARS-COV-2 lung pathology. The damaged type 2 cells express PAI-1 and an already hypoxic state also causes an upregulation of PAI (through Hypoxic inducible factor-1) along with direct stimulation by STAT-3. Simultaneous STAT-3 and PAI-1 activation inhibits t-PA and urokinase-type plasminogen activator leading to thrombi formation.
Also, the SARSCoV-2 spike protein binds to the CD147 on red blood cells and causes clumping. IVM in turn, binds to SARS-CoV-2 Spike protein and hence prevents clumping.
T cell lymphopenia in COVID-19 can also be attributed to the direct activation of PD-L1 receptors on endothelial cells by STAT-3. IVM directly inhibits the NF-kb pathway, STAT-3, and indirectly inhibits PAK-1 by increasing its ubiquitin-mediated degradation.
The natural antiviral response of a cell is through interferon regulatory genes and viral RNA mediated activation of TLR-3 and TLR7/8- Myd88 activation of transcription of interferon-regulator (IRF) family. For a virus to establish an infection, this antiviral response needs to be inhibited by blocking interferon production. The proteins such as importin and KPNA mediate nuclear transport of viral protein and subsequent IFN signaling.
The SARS-CoV-2 proteins (ORF-3a, NSP-1, and ORF-6) directly block IFN signaling causing the surrounding cells to become unsuspecting victims of the infection. IVM inhibits both importin a-b (green) as well as the KPNA-1 receptors (brown) causing natural antiviral IFN release. IVM also inhibits viral RdrP, responsible for viral replication.
The role of Ivermectin against the SARS-CoV-2 virus
The targets of activity of Ivermectin can be divided into the following four groups.
The direct “antiviral targets” may be useful in the early stages while the anti-inflammatory targets might be addressed in the later stages of the disease.
A. Direct action on SARS-CoV-2
Level 1: Action on SARS-CoV-2 cell entry Level 2: Action on Importin (IMP) superfamily Level 3: Action as an Ionophore
B. Action on host targets important for viral replication
Level 4: Action as an antiviral Level 5: Action on viral replication and assembly Level 6: Action on post-translational processing of viral polyproteins Level 7: Action on Karyopherin (KPNA/KPNB) receptors
C. Action on host targets important for inflammation
Level 8: Action on Interferon (INF) levels Level 9: Action on Toll- like-Receptors (TLRs) Level 10: Action on Nuclear Factor-κB (NF-κB) pathway Level 11: Action on the JAK-STAT pathway, PAI-1 and COVID-19 sequalae Level 12: Action on P21 activated Kinase 1 (PAK-1) Level 13: Action on Interleukin-6 (IL-6) levels Level 14: Action on allosteric modulation of P2X4 receptor Level 15: Action on high mobility group box 1 (HMGB1), Level 16: Action as an immunomodulator on Lung tissue and olfaction Level 17: Action as an anti-inflammatory
D. Action on other host targets
Level 18: Action on Plasmin and Annexin A2 Level 19: Action on CD147 on the RBC Level 20: Action on mitochondrial ATP under hypoxia on cardiac function
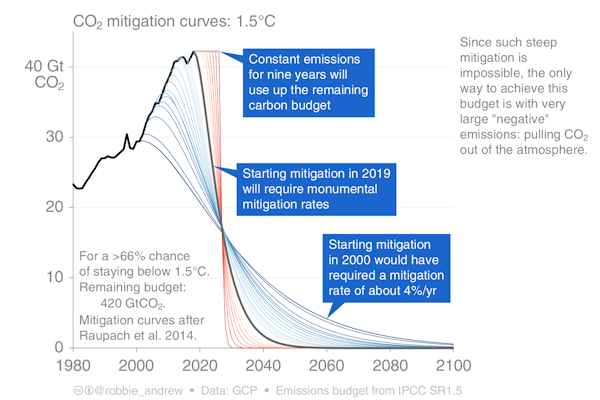
This is the fifth and final post of a series to alert readers to a compilation of the scientific and economic case against the claims of IPCC supporters and anti-fossil fuel activists. David Stockman provides the evidence and the arguments against the IPCC policy framework in a series of five essays published at International Man under the title The GreenMageddon and What It Means for You. I have stated the five themes he develops in his essays, along with some excerpts and images to illustrate the main points. Here is the Fifth theme overview and discussion.
5. GreenMageddon is no hyperbole. It’s is the virtually certain outcome of attempting to purge CO2 emissions from a modern energy system and economy that literally breathes and exhales fossilized carbon.
Indeed, the very idea of converting today’s economy to an alternative energy respiratory system is so far beyond rational possibility as to defy common sense. Yet that is exactly where the COP26 powers that be and their megaphones in the MSM are leading us.
In Truth, Green Energy is Overrated and Supplies Little of the Energy We Use
In the first place, it needs be understood that the climate change advocates essentially lie about how much “green energy” we now use and therefore the scope for energy supply system displacement of fossil fuels which would be required to get to net zero CO2 emissions by 2050.
For instance, it is commonly claimed that 12% of US primary energy consumption (2020) is accounted for by “renewables”, implying that we are off to a decent start in eliminating the fossil fuel dependency of the system.
Actually, no—not even close. That’s because “renewables” and green energy defined as solar and wind are not remotely the same thing.
According to DOE, the US consumed 11.6 quads (quadrillion BTUs) of renewables in 2020, but 7.3 quads or 63% of that was accounted for by old-style non-fossil fuels including:
Hydroelectric: 2.6 quads;
Wood: 2.5 quads;
Biofuels: 2.0 quads;
Geothermal: 0.2 quads
Of course, there is nothing wrong with these non-fossil fuels and in some cases they can be quite efficient. But they are not part of the “green solution” to displace some or all of the 73 quads of fossil fuels consumed in 2020 because most of these sources are tapped out or not desirable to expand.
We have already seen, for instance, that hydroelectric—which was a favorite of the New Deal back in the 1930s—was tapped out long ago. Up to 80% of the long rivers in the US are already damned, and environmentalists haven’t permitted a new major hydroelectric project in decades. In fact, hydro-electric output of 291 billion kWh in 2020 was well below the peak level of 356 billion kWh recorded in 1997 and was even exceeded by the 304 kWh generated way back in 1974.
Nor do we hear the Climate Howlers beating the tom-toms for the original source of modern BTUs— more wood combustion! Actually, theyadvocate the opposite: Massive tree-planting as “offsets” to carbon emissions.
Likewise, most of the 2.0 quads attributable to biofuels is accounted for by ethanol produced from fermented corn. Yet any material increase in ethanol consumption—via higher mandated blending with gasoline—would likely wreck most of the IC engines on the highways, while turning the vast food production expanses of Iowa and Nebraska into fuel farms.
Finally, consider the implicit lesson in the small amount of consumption—0.2 quads—attributable to geothermal energy. As it happens, geothermal electricity is about as close to a perfect source of renewable energy as you can get, as one analysts recently noted, but there is a huge catch:
So why isn’t there more of it?
Because there wasn’t much of it to begin with. While renewable energy sources like wind and solar are exploitable to a greater or lesser extent almost everywhere, high-temperature geothermal resources are found only there is a coincidence of high heat flow and favorable hydrology, and…..these coincidences occur only in a few places.
Which Leaves Wind and Solar, Which Leaves a Lot to be Desired
This gets us to the only so-called “renewables” which are actually expandable at scale—-solar and wind. As to the former, it needs be noted that US consumption during 2020 amounted to only 1.2 quads, or less than half of the primary energy supplied by wood (including a small amount of industrial consumption of bio-waste such at pulp mills etc.).
That’s right. After decades of big time subsidies and endless government promotion, solar is still eclipsed by the fuel first used by cavemen!
The problem with wind power, however, is no less prohibitive. In the case of the 3.0 quads of primary energy attributed to wind in 2020, virtually 100% was used by utilities to generate electricity for the grid. Accordingly, only 90% of that wind energy ever makes it to a home, industrial plant or EV auto. The difference is accounted for by BTUs lost in downstream transmission and distribution lines (T&D losses). And when you add the fact that 64% of primary solar consumption was also used by electric utilities and also suffered T&D losses, you get a truly startling fact.
To wit, only 3.4 quads of solar and wind energy actually generated net electrical power to end users in the US economy in 2020.
In turn, that tiny figure represents only 4.9% of the 69.7 quads of net energy from all fuels (after deducting utility system waste from all fuel sources) used by the entire US economy in 2020. Yet even that tiny fraction was an artifact of the massive government subsidies which have been thrown at the two green fuels.
In the case of wind power, for example, there is a Federal subsidy of 2.5 cents per kWh, which happens to represent 69% of the average wholesale price for wind power, plus a 30% investment tax credit for the original installation of wind farm CapEx. Then again, no one charges for the wind—so wind power is massively capital intensive with CapEx representing 70% of lifetime wind power costs, meaning that another 21% of the cost of power is funded by Uncle Sucker.
Green Energy is fraught with obstacles and risks.
Still, the question recurs. How do you get to, say, a 50% replacement of fossil fuels with green energy by 2035, which would be the minimum path to net zero CO2 emissions by 2050—even assuming still more wasteful Joe Biden subsidies than we already have?
In a word, you don’t. That because even a surface investigation takes you smack into the unacknowledged elephant in the green energy room. To wit, the only practical way to deliver wind and solar to the end use sectors of the economy is through massive conversion of green BTUs to electricity and the distribution of them through the leaky power grid.
Needless to say, that process would be fraught with obstacles and risks that the Climate Howlers never even remotely acknowledge. In fact, as we will show below, to convert even 50% of current fossil fuel consumption to wind and solar, would require a near doubling of total primary energy consumption in the utility sector from the 35.7 quads reported for 2020 to nearly 66 quads by 2035.
More crucially, the 10.6% share of utility primary energy or 3.8 quads posted in 2020 for solar and wind would rise to nearly 67% and 44.0 quads by 2035 (see calculations below). That is to say, solar and wind production would have to rise by nearly 12-fold over the next 15 years. And the cost of subsidies to make it happen (including drastically rising retail utility prices to consumers) would be truly staggering
Now, here’s the thing. Given the inherent intermittency and unreliability of solar and wind energy, the electric grid would become dangerously more fragile and subject to brown-outs and blackouts during periods of peak demand and low solar/wind production. That’s because when you take out half or about 11 quads of fossil energy now used by the electric utility industry you are removing baseload capacity which is essentially available 100% of the time, save for scheduled maintenance and very occasional unplanned interruptions.
By contrast, when two-thirds of the grid is powered by solar and wind as we have projected for 2035 under the COP26’s net zero regime, you have fundamentally transformed the nature of the electric power system. There would essentially be no baseload power supply left, meaning that the system would have to be equipped with massive pumped-hydro, compressed air or battery storage facilities to back-fill for no wind or sun days— plus meet time of day and seasonal demand surges, which would get far more severe when nearly the entire economy gets electrified, as further explained below.
The problem, of course, is the production of electrical power so that it can be stored and drawn-down later is inherently inefficient and a BTU waster. That’s especially the case, with pumped storage, the only practical idea for large scale system storage and back-up. Of course, what that solution does is burn a lot of BTUs pumping water uphill to a reservoir—so that the sluice-gates can be opened to regenerate the very same hydroelectric power when needed at a latter date.
Overall, it is estimated that the range of available storage solutions would result in a 10-40% dissipation of the primary green energy supplied to the utility system. So not only would massive costs be incurred to finance power storage, but the loss of BTUs in the storage loading and extraction process would require even more primary green energy capacity to make up for the wasted BTUs!
Thus, if the energy loss owing to storage systems for 32.2 quads of incremental solar and wind conservatively averages 25%, another 8 quads of solar and wind primary capacity would be needed to supply projected 2035 power requirements. That is, by 2035 utility system would need 44 quads of solar and wind or 11.5-times more capacity than its actual green power output in 2020.
For want of doubt, first consider the implications of shifting 50% of fossil fuels used in the transportation sector to solar and wind fueled electrical power production. During 2020, the transportation sector used 24.23 quads of primary energy, of which fossil fuels—petroleum products and natural gas—supplied 22.85 quads or 94% of the total.
It’s also not the half of it. When you switch to EV vehicles and and distribution of 3X more quads of energy through the utility system you are also creating havoc with load management. That’s because travel surges around holidays create peak loads that drastically exceed day-in-and-day-out levels. In the case of air travel, for instance, during a typical year revenue passenger miles in July are equal to nearly 140% of the level for the seasonal low in February.
Just imagine a hot but cloudy and windless July 4th. The normal air-conditioning and commercial demand surge would be over-layed with a huge fleet of EVs on the holiday roads and hitting the charging stations with relentless effect. This year, for instance, an record 47 million travelers hit the road on the July 4th weekend.
Of course, that is not a problem for the existing motor fuel supply system. Average demand is about 9 million b/d, but motor fuel stocks range between 220 and 260 million bbls—plus another estimated rolling inventory of 50 million barrels in the tanks of the nation’s 285 million vehicles. So with upwards of 300 million bbls or 33 days of supply in the system, peak load fluctuations are readily absorbed by the system.
Needless to say, electrical power is another breed of cat.
It can’t be stored as produced. As indicated above, production must always meet instantaneous demand or the grid will collapse. The only solution is to store dispatchable electric power in another form—pumped storage reservoirs or batteries, and that’s damn expensive.
Moreover, unlike the vastly de-centralized motor fuel stocks which are efficiently market-driven, creating a massive system-wide dispatchable surplus on the utility grid for peak EV demands would be a daunting task. After all, you would need about 140 million EVs on US roads versus today’s 1.4 million plug-in EVs to displace 50% of motor fuel demand.
Nor is the transportation sector unique. Currently the industrial sector accounts for 22.1 quads (2020) of primary energy demand, of which 19.7 quads are supplied by fossil fuels. Those fossil fuels supply various combustion equipment, IC engine driven power plants and machinery, as well as feed stocks for chemical processing industries.
The story only gets more complicated when you add-in the residential and commercial sector. For instance, the residential sector is already heavily electrified owing to the electrical powering of lights, air conditioning and household appliances. Consequently, while the household sector has primary energy demand of 6.54 quads, it actually uses 11.53 quads counting the 5 million quads of indirect energy consumption supplied through the electrical utility grid.
That is to say, the single most variable energy demand sector—America’s 130 million housing units—-would become virtually all electric. Fully 9.0 quads out of total residential energy demand of 12.0 quads (including current electrical power use) of consumption would be supplied by the electrical grid by 2035.
Would that fact create an even more egregious disconnect between unreliable solar and wind power on the fuel side of the electrical grid and variable demand on the user side?
Most surely it would. And that’s especially true when you add in the last two elements of the supply-demand picture. To wit, the commercial sector is growing at about 0.6% per annum, so by 2035 total primary use would be 5.3 quads and the incremental wind and solar requirement to replace half of current fossil fuels, which currently account for 88% of primary energy demand in the sector, would total 2.9 quads.
Finally, the baseline demand for primary energy in the utility sector itself is about 37.0 quads (2019) and it has not been growing for years. So on a 2035 projection, current fossil and non-fossil sources of utility energy would be as follows before giving account to the displacement shifts estimated above in the four end-use sectors of the economy. And this optimistically assumes no loss of nuclear or hydro capacity in the interim.
On an all-in basis, therefore, the implicit transformation of the utility sector would be staggering, and that would only get you half-way to zero net carbon by 2050. Here is the summary of what would be required in terms of total solar and wind capacity in the utility sector by 2035:
Current solar & wind: 3.8 quads;
transportation sector replacement: +8.5 quads;
residential sector replacement: +3.9 quads;
industrial sector replacement: +12.9 quads;
commercial sector replacement: +2.9 quads;
utility sector replacement: +4.0 quads;
back-up storage: +8.0 quads;
Total Solar & Wind, 2035: 44.0 quads;
Multiple of 2020 level: 11.6X
It goes without saying that the above is an economic train-wreck waiting to happen. You simply don’t go from 3.8 quads of solar and wind after decades of tepid gains to 44.0 quads in less than 15 years. Plain and simply, such a shift would take the US hostage to a centralized utility grid based energy respiratory system that would be dangerously unstable, imbalanced and subject to catastrophic black swan type events.
Summary
No electricity is stored in a grid; supply must match demand at all times, or it must shut down to save itself. Climatists want to electrify everything, especially heating and cars, thereby spiking and complicating demand. Meanwhile the plan is to increase intermittent and remote wind and solar plants, making supply unpredictable. Get ready to be stuck at home, freezing in the dark. That’s GreenMageddon.
Footnote
The diagram at the top indicates many dimensions of modern life that are not discussed in this series of posts. The short video below reminds that fossil fuels yield a plethora of ancillary byproducts that enhance and extend our lives; which will also be taken away by the Green agenda.
This post is the fourth of five to alert readers to a compilation of the scientific and economic case against the claims of IPCC supporters and anti-fossil fuel activists. David Stockman provides the evidence and the arguments against the IPCC policy framework in a series of five essays published at International Man under the title The GreenMageddon and What It Means for You. I will state the five themes he develops in his essays, along with some excerpts and images to illustrate the main points. Here is the fourth theme overview and discussion.
4. Zero Carbon is suicidal because it requires cutting off essential energy supplies with nothing to replace them. Renewables can not keep pace with increasing electrical demand, let alone replace any baseload thermal power plants with wind or solar generation. Nor will hydro or nuclear power cover the losses from shuttering thermal power plants.
Overview
The chart below dramatically underscores why the CO2 witch-hunt is such a deadly threat to future prosperity and human welfare. To wit, even after decades of green energy promotion and huge subsidies from the state, renewables accounted for only 5% of primary global energy consumption in 2019 because:
They are still very un-competitve (high cost) relative to the installed base of fossil, nuclear and hydroelectric energy; and,
They do not really even account for the 5% share reflected in the chart in terms of ability to delivery work to the economy owing to intermittency of wind and solar power and the fact that by convention government scorekeepers gross-up renewables-based electrical power delivered to end-users to account for transmission and distribution (T&D) losses in the electric power grid.
By contrast, the 84% share attributed to oil, natural gas and coal is actually far larger in practical terms as we look into the future. That’s because most of the prime hydro sources have been tapped out long ago and are therefore not a meaningful source of growth. During the last 10 years, for example, US hydro-power output has only increased from 275 billion KWh to 288 billion KWh or by barely 0.24% per annum.
Likewise, nuclear power capacity outside of China stopped growing decades ago due to massive political and regulatory resistance. Germany, for example, is in the process of closing its last nuclear plants from a fleet that once generated 170,000 GW hours annually (2000) and is now generating only 75,000 GW hours, with a zero target by the year 2030. Even in the US, nuclear power remains dead in the water, with annual output rising from 754 billion KWh in 2000 to just 809 billion KWh in 2019.
Beyond that, the Climate Howlers are not talking about a gradual substitution of solar and wind for the three fossil based sources of primary energy as existing plants reach the end of their useful lives over the next 50 years.
To the contrary, zero net CO2 emissions targets for 2050 will require the massive early retirement and dismantlement of perfectly good power plants and tens of millions of internal combustion (IC) engine vehicles.
Closing Functional Power Plants is a Double Loss
The prospect of substituting green power for existing fossil fuel capacity over the next several decades is where the rubber meets the road. But to grasp the full extent of the impending calamity it is necessary to recall that Keynesian GDP accounting inherently obfuscates the true economic cost in a drastically downward direction.
In fact, Keynesian GDP accounting is just the modern iteration of Frederic Bastiat’s famous “broken window fallacy”. Gross capital spending gets added to the total of GDP with no offset for depreciation and asset write-offs. That’s why, we suppose, climate change activists get all giddy about the alleged economic growth benefits and job gains from green investment: They just don’t count all the assets wasted and jobs lost by shutting down efficient coal mines or fossil-fired utility plants.
Nor are we talking about small amounts. To come even close to the utterly ridiculous COP26 target of net zero emissions by 2050 literally tens of trillions worth of fossil-fired power plants, heating units, chemical processing plants and internal combustion engine vehicles would have to be decommissioned and taken out of service long before their ordinary useful economic lives had been reached.
Fossil fuel consumption in the electric power utility sector—the only sector where green energy has even made a dent—-has hardly declined at all.
What happened, instead, is that between 2000 and 2019, US coal and oil-fired generation dropped from 2,090 billion KWhs to 1,004 billion KWhs or by 52%, but that was nearly off-set by a huge jump in natural gas-fired generation. Specifically, natural gas fired output of 601 billion KWhs in 2000 rose to 1,586 billion KWhs by 2019, a gain of 164%. Accordingly, the needle on overall fossil-based generation hardly moved, dropping from 2,691 billion KWhs in 2000 to 2,590 billion KWhs in 2019.
So the question recurs, how in the world do these lame-brains expect to get to zero CO2 emissions from the utility sector when over the last 19-years, the rate of fossil-fired production has declined by a trivial –0.20% per annum.
Moreover, as we suggested above regarding the global balances, there is no reason whatsoever to expect any material displacement of fossil-based power production by nuclear or hydro. Combined these two sectors produced 1,097 billion KWhs in 2019, but if anything production is likely to fall in the next several decades.
That’s right. In the last quarter quarter century there has been a grand total of two nuke plants commissioned. This means quite evidently that the nation’s grand total of 94 operating commercial nuclear reactors at 56 nuclear power plants in 28 states are old as the hills— averaging 25-40 years old and heading for decommissioning in the normal course.
The implication cannot be gainsaid. Unless there is a total political reversal with respect to nuclear power, the 809 billion KWHs generated in 2019, which represented nearly 20% of total utility output, will likely be shrinking from normal retirements faster than new plants can be licensed, built and made operational, a process which typically takes well more than a decade.
How Will Growing Demand for Power Be Met?
Finally, there is the matter of growth. Even at the tepid level of GDP growth during the last decade, and despite continued improvements in the efficiency of electrical power use in the US economy, total power output rose from 3,951 billion KWHs in 2009 to 4,127 billion KWhs in 2019, representing a modest 0.44% per annum growth rate.
Then again, a continuation of that modest growth trend—which would be the minimal gain compatible with a continued slow rise in real GDP—would result in total power output requirements of 4,427 billion KWhs by 2035 or 300 billion KWHs more than current levels.
So here’s the skunk in the woodpile. Total solar and wind-fueled power output in 2019 was just 367 billion KWhs or 8.9% of total utility output. That is, it will require the equivalent of fully 82% of current so-called green power production just to supply projected system growth. And that’s to say nothing of replacing nuclear production that is likely to be falling due to retirements and obsolescence or, more importantly, displacing some of the 2,590 billion KWhs of fossil production still in the nation’s electrical power grid.
Let us re-iterate: Unless a large share of that 2,590 billion KWhs of capacity is shuttered, the idea of zero net CO2 emissions is a pipe dream.
At the same time, it would take trillions of taxpayer subsidies to lift the current 367 billion KWhs of green power production toward even half of power requirements by 2035, which would exceed 2,200 KWhs. And that simply isn’t going to happen in a month of Sundays.
Worse, Power Output and Reliability Requires Over-Sized Renewables Installations
Moreover, that’s not even the half of it. Green power production, and especially wind which accounted for 4X more output than solar in 2019, ( 295 billion KWhs versus 72 billion KWhs) is highly intermittent based on seasonal patterns and daily wind strength. Nationally, wind plant performance tends to be highest during the spring and lowest during the mid-to late summer, while performance during the winter (November through February) is around the annual median. However, this pattern can vary considerably across regions, mostly based on local atmospheric and geographic conditions.
In a word, to get the same output and reliability as gas or coal-fired base-load plants, green power plants need to be drastically oversized both in terms of maximum output capacity and back-up storage units. As shown below, for most regions of the country, median monthly wind capacity factors range between just 25% and 35%.
Needless to say, low capacity factors mean high all-in costs for electrical energy delivered to the grid. Analysts use a concept to capture this called LCOE (levelized cost of energy), which is the present value of total cost over the lifetime of a plant divided by the cumulative amount of electricity generated over the lifetime.
Accordingly, the cost of funding power output growth plus displacement of substantial amounts of fossil fired production would be staggering. Recent detailed study by the Institute for Energy Research show the LCOE calculations for the range of fuels sources:
LCOE Per Megawatt Hour Of Capacity:
Combined cycle natural gas: $36;
Nuclear: $33;
Hydro: $38;
Coal: $41;
Onshore wind: $85;
Solar PV: $89;
Offshore Wind: $132.
These differentials between conventional and green sources of power generation are clearly staggering and contradict the constant propaganda from the Climate Howlers, who falsely claim that solar and wind are cheaper than existing power sources.
But as we will amplify in the final installment (Part 5), the actual scenario is far more forbidding than even these all-in cost differentials would suggest. That’s because the second part of the green agenda is to convert the nation’s efficient fleet of 285 million IC engine vehicles to electric battery power and 70 million natural gas and oil heated homes to green electricity, among others.
What that will do, of course, is make peak power demand swings on the grid far more extreme—even violent—just as the reliability of a green-powered utility sector falls sharply.


 Tyler Durden posted at zerohedge


 The table below shows the distribution of Sea Ice on day 304 across the Arctic Regions, on average, this year and 2020.


 Previously in August Victor Davis Hanson suggested several theories that might explain how Biden’s administration has destroyed everything they touch. A summary of that essay is reprinted later on, but this post presents another possible explanation. James Lewis writes at American Thinker
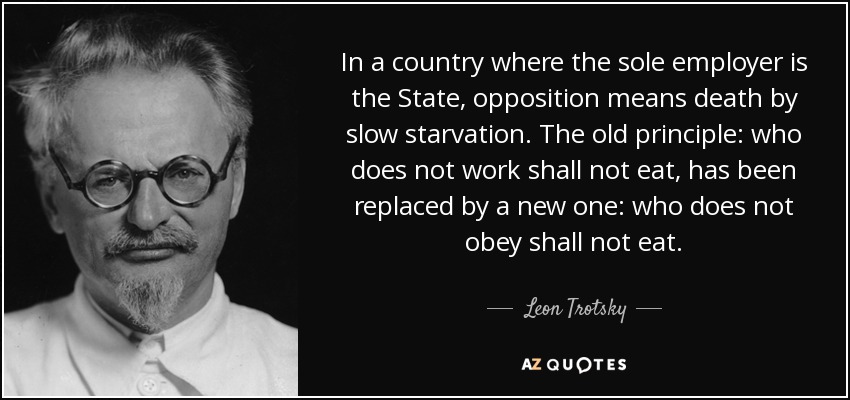


 A previous series of posts here provided the case made by David Stockman against the IPCC hurryup agenda (David Stockman:

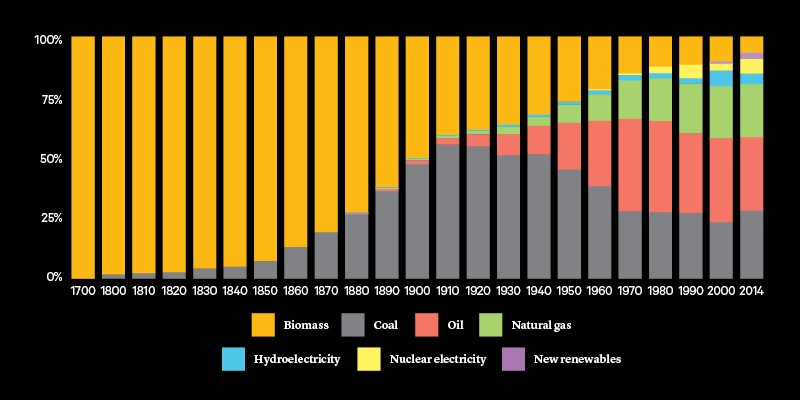

 This post is the fourth of five to alert readers to a compilation of the scientific and economic case against the claims of IPCC supporters and anti-fossil fuel activists. David Stockman provides the evidence and the arguments against the IPCC policy framework in a series of five essays published at International Man under the title