Eyal Shahar writes at Brownstone Institute The Mystery of Unaccounted Excess Deaths in the US. Excerpts in italics with my bolds.
By April 2022, the number of reported Covid deaths (993,739) had accounted for almost all of the CDC estimate of excess deaths (about 1,080,000). The official narrative will tell you that most of the difference is missing Covid deaths – people who died from Covid but were not diagnosed.
That’s a simpleminded summary.
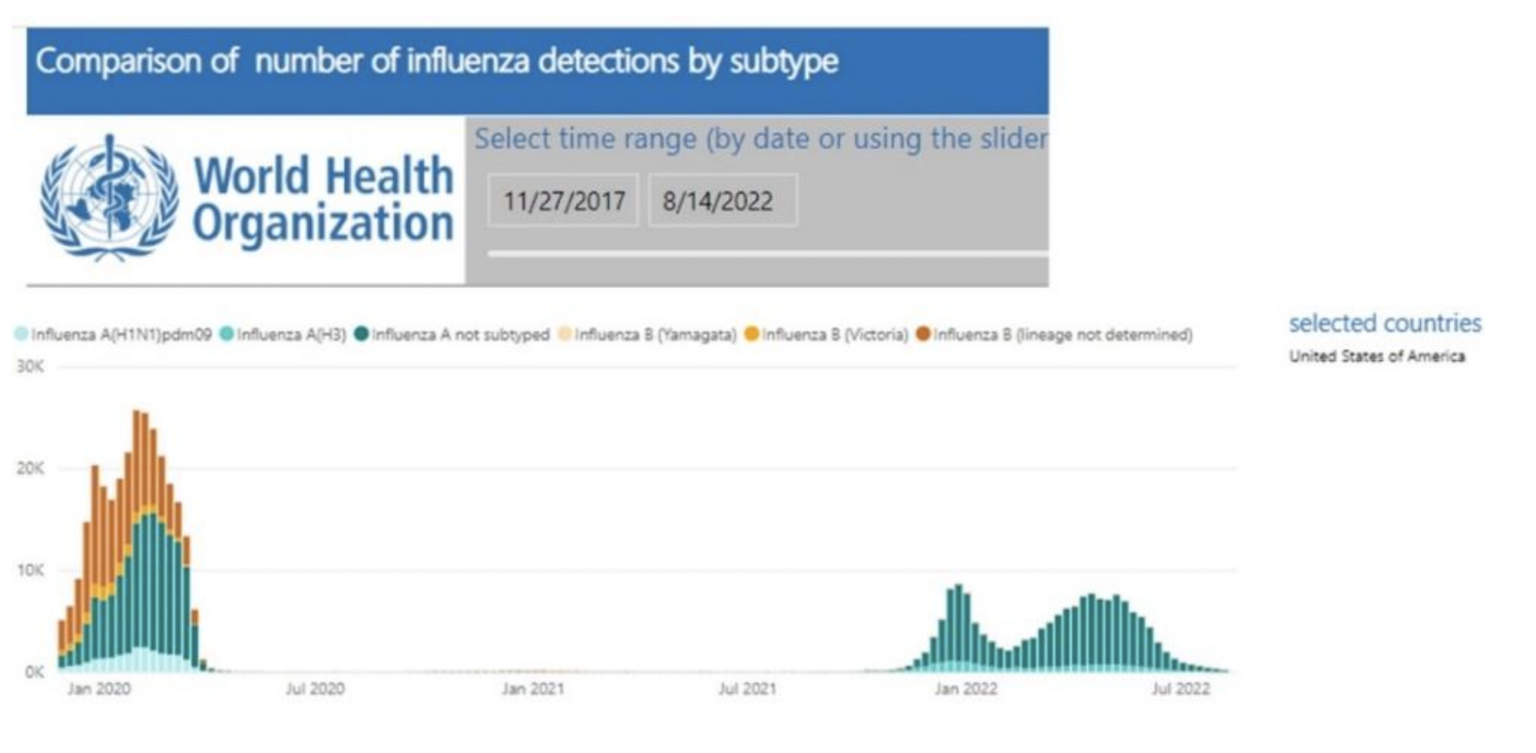
First, flu returned last winter (Figure 1) and its share in excess mortality is unknown. A comparison of Covid deaths with excess deaths must be truncated in September 2021, before the beginning of the flu wave.
Second, Covid deaths might have been missed early on, but it is absurd to assume that they continued to be missed throughout the pandemic. On the contrary, liberal coding rules, financial incentives, extensive testing, and a Covid-oriented mindset must have led to overcounting of Covid-related deaths.
Third, lockdowns, social isolation, fear-mongering, and disruption of normal life took their toll, too. There is no doubt that those baseless interventions have cost (and will cost) lives. So the question is not whether they contributed to excess mortality, but how much? What percentage of the excess mortality in the US is due to panic reaction and official fear-mongering? How many excess deaths are not accounted for by Covid?
Sources of data
Three sources of data were used to check the robustness of the main results (qualitatively), and to obtain a range of estimates: 1) CDC excess death file (weekly estimates), from which it is also possible to compute weekly Covid deaths. 2) CDC Covid death file (cumulative by each day), from which weekly deaths can be computed. 3) Our World in Data (OWID) website, from which Covid deaths and estimated excess deaths can be computed between various dates.
Cutoff dates for selected periods were dictated by weekly end-dates in the CDC excess death file. Available OWID dates were within two days.
Unaccounted excess deaths
Figure 2 shows data from an 18-month period – April 2020 through September 2021 – terminating the observations before the return of the flu. Counts of Covid deaths are shown from the three sources, and estimates of excess deaths from two. The difference between excess deaths and Covid deaths is unaccounted excess deaths.
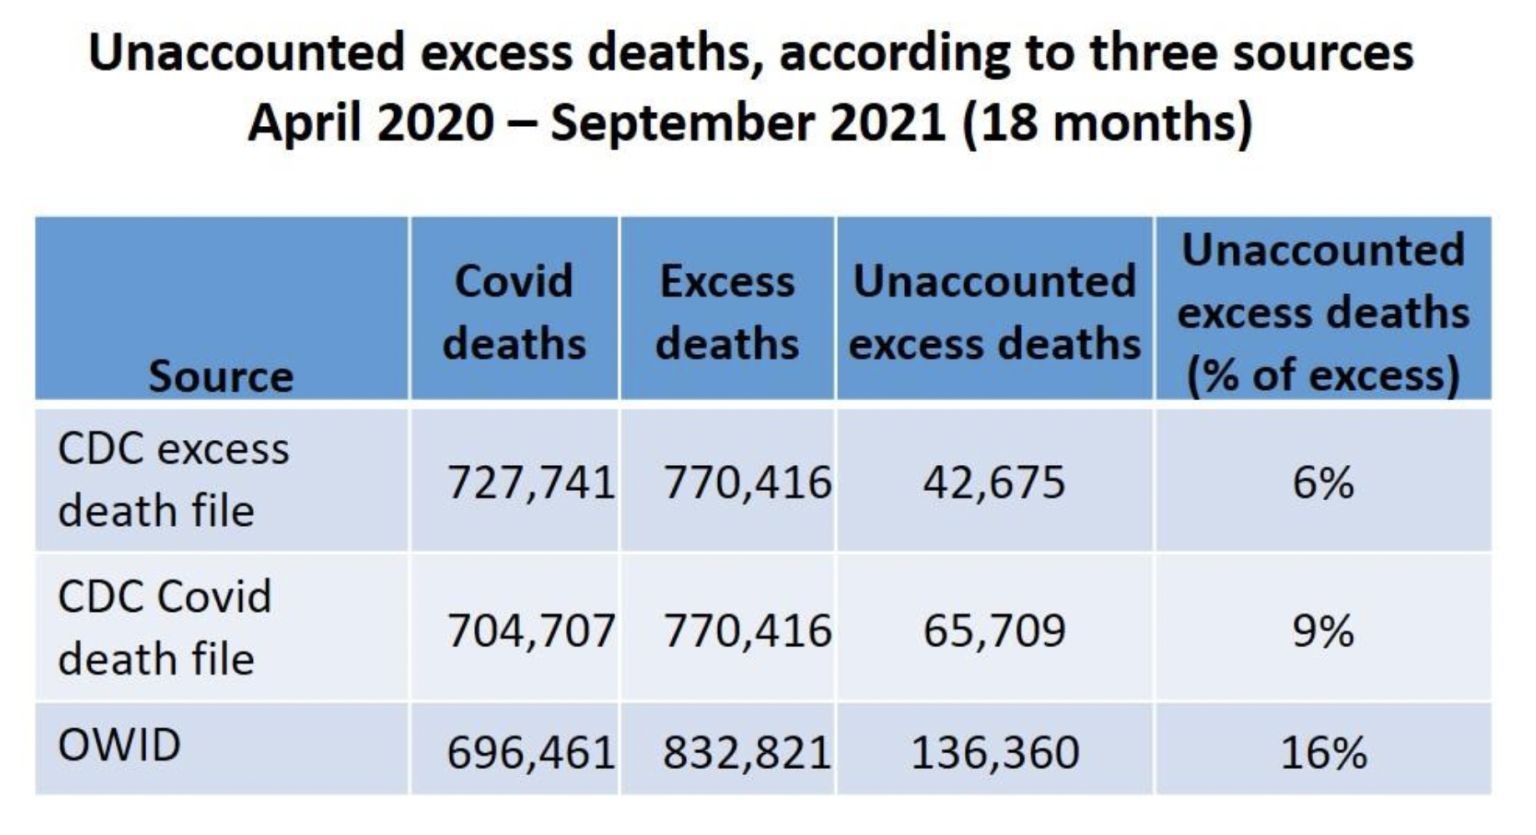
Overall, the share of unaccounted excess deaths over the 18-month period was 6-9% (CDC) or 16% (OWID). This summary, however, is hiding important variation over time.
Three consecutive periods
Review of weekly estimates revealed two periods with a significant percentage of unaccounted excess deaths (April-December, 2020 and June-September, 2021), separated by a five-month period (January – May, 2021) in which the opposite was observed: the number of Covid deaths exceeded the estimate of excess deaths. It was seen in 20 of 21 weeks of that period.
The data for each of the three periods is shown next.
First period
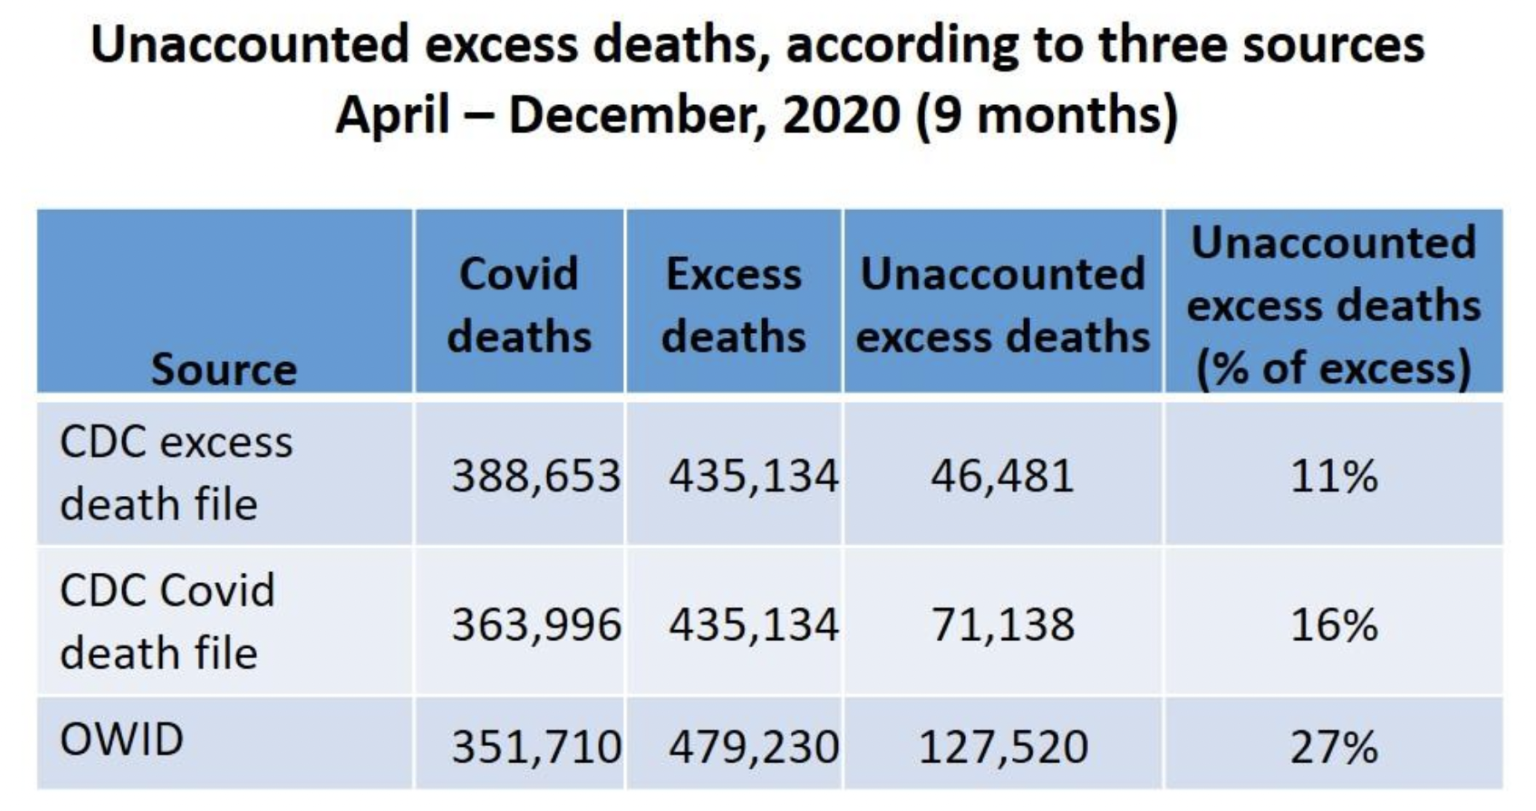
In the first nine months of the pandemic, the share of unaccounted excess deaths ranged from 11% to 27% of all excess deaths, depending on the source of data (Table). The OWID estimate is higher than CDC-based estimates due to a lower count of Covid deaths and a higher estimate of excess deaths (as seen in the entire period.) Notice, again, that the count of deaths in the Covid file is closer to the OWID than to the excess death file.
Interim period
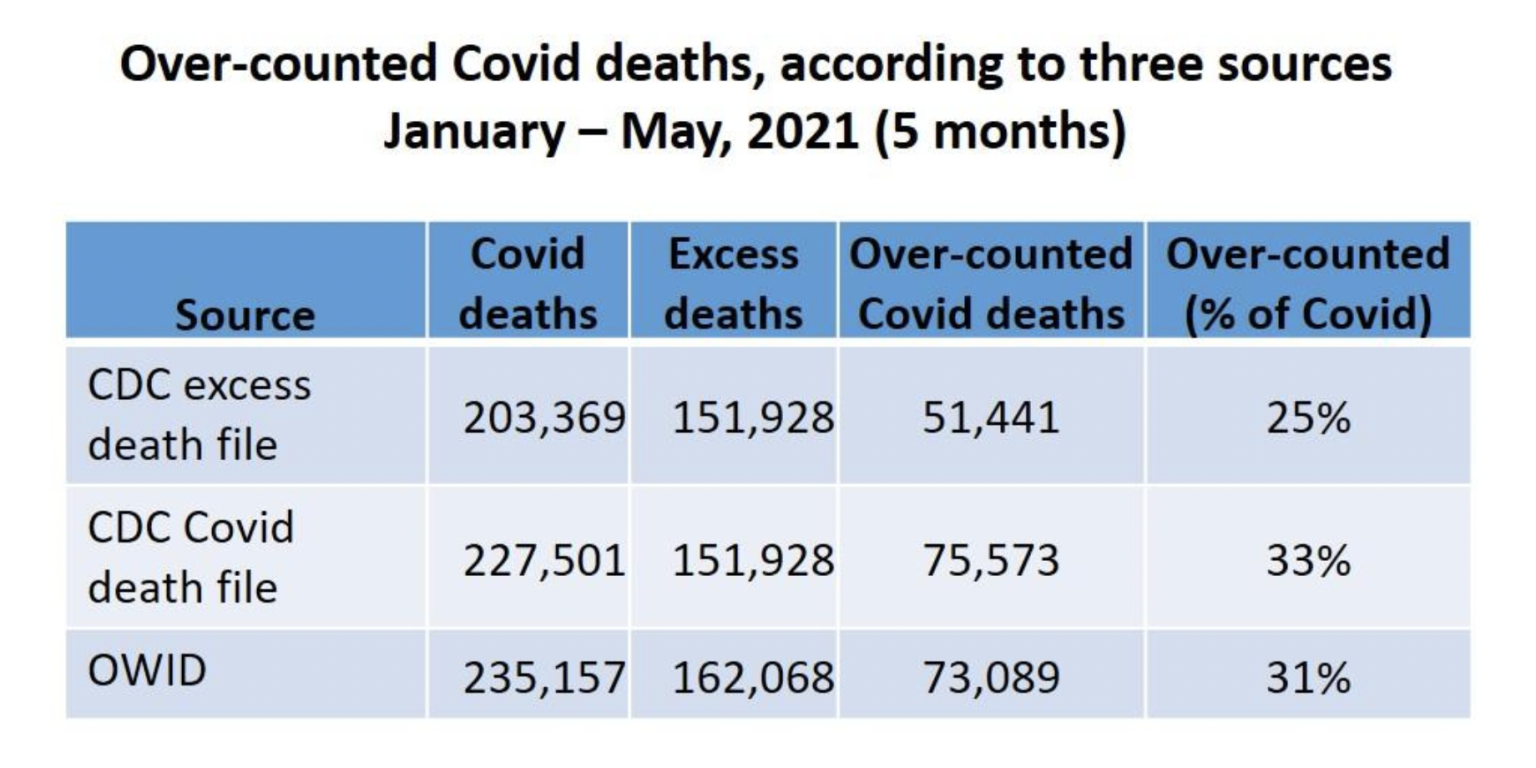
At the beginning of 2021, the pattern was reversed. The number of Covid deaths exceeded the estimate of excess deaths, indicating overcounting of Covid deaths (Table). A so-called Covid death that did not contribute to excess mortality was not caused by Covid. It was death “with Covid,” or sometimes death “with a positive PCR.”
Other than data error, the only alternative explanation to overcounting is overestimation of the “normal” number of deaths (by both sources), resulting in underestimation of excess deaths. There was no drastic change, however, in the CDC estimates of weekly expected deaths, which gradually declined from about 61,000 at the beginning of January to about 55,000 by the end of May.
Misattribution of deaths to Covid during that five-month period was substantial: One-quarter to one-third of reported Covid deaths would have happened regardless of a Covid diagnosis.
Direct evidence of misattribution requires selecting a large sample of death certificates from different times, retrieving the associated medical records, and reclassifying Covid deaths by a panel of experts. Don’t count on the CDC to initiate a study that might shatter the official narrative.
Last period
The results for the last period are striking (Figure 5). Not only do we observe, again, unaccounted excess deaths, but their share is substantially higher than in the first part of the pandemic. Unaccounted excess deaths make up 26% to 43% of the excess mortality in these four months, as compared with 11% to 27% in the first nine months. The average number of unaccounted excess deaths per month was doubled (CDC data) or increased by almost 50% (OWID).
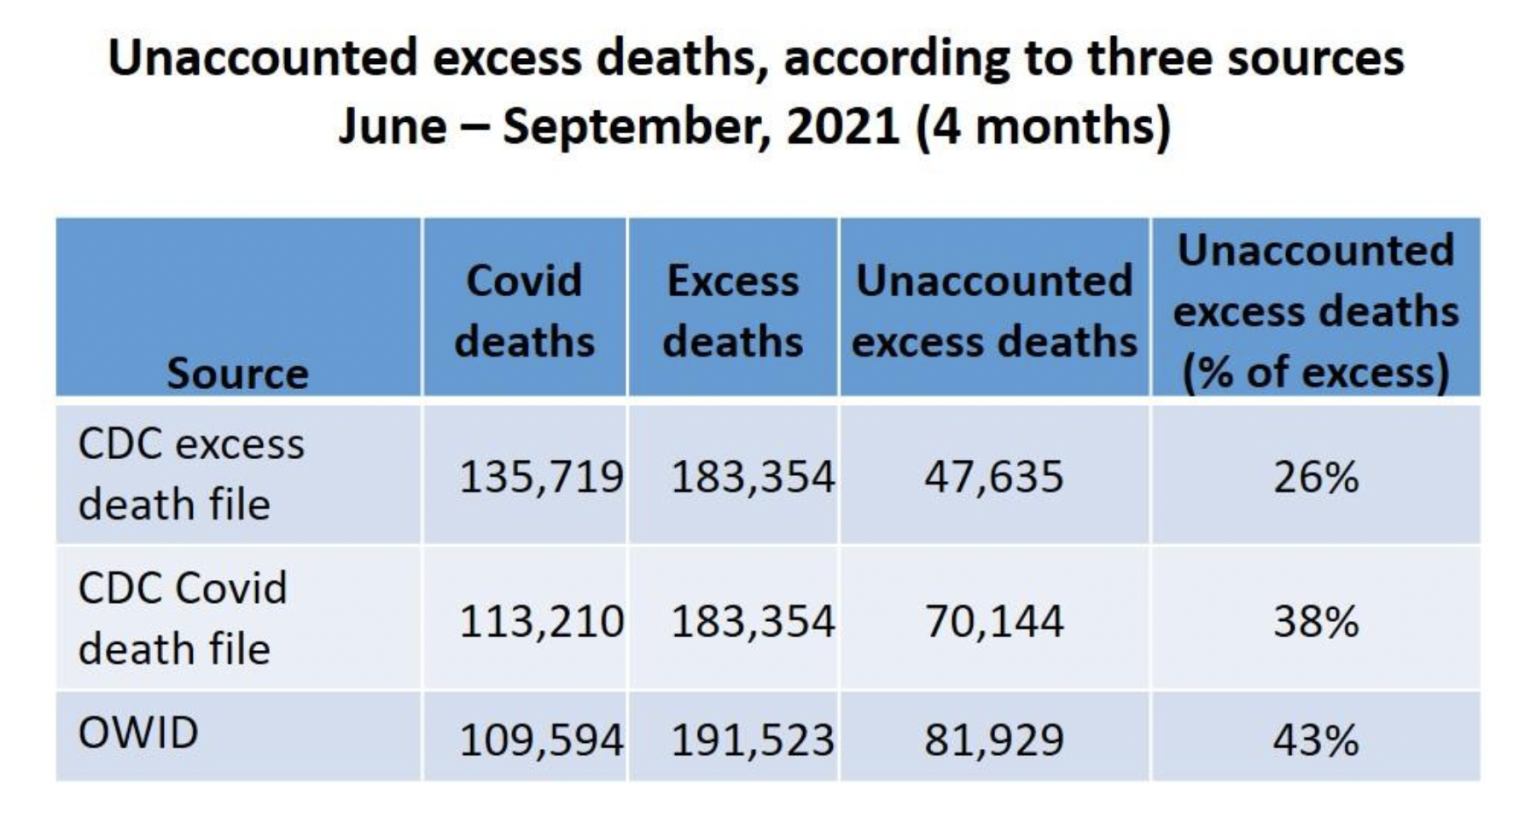
What has accounted for these 47,000 to 82,000 excess deaths?
The last period contained the rising part of the Delta wave (as of July). Were some Covid deaths of vaccinated people not attributed to Covid (because the vaccines were promised to be 95% effective)? Did some of those deaths result from the continued effects of panic and fear-mongering? Were some of them vaccine fatalities?
Estimates of unaccounted excess deaths (April 2020 – September 2021)
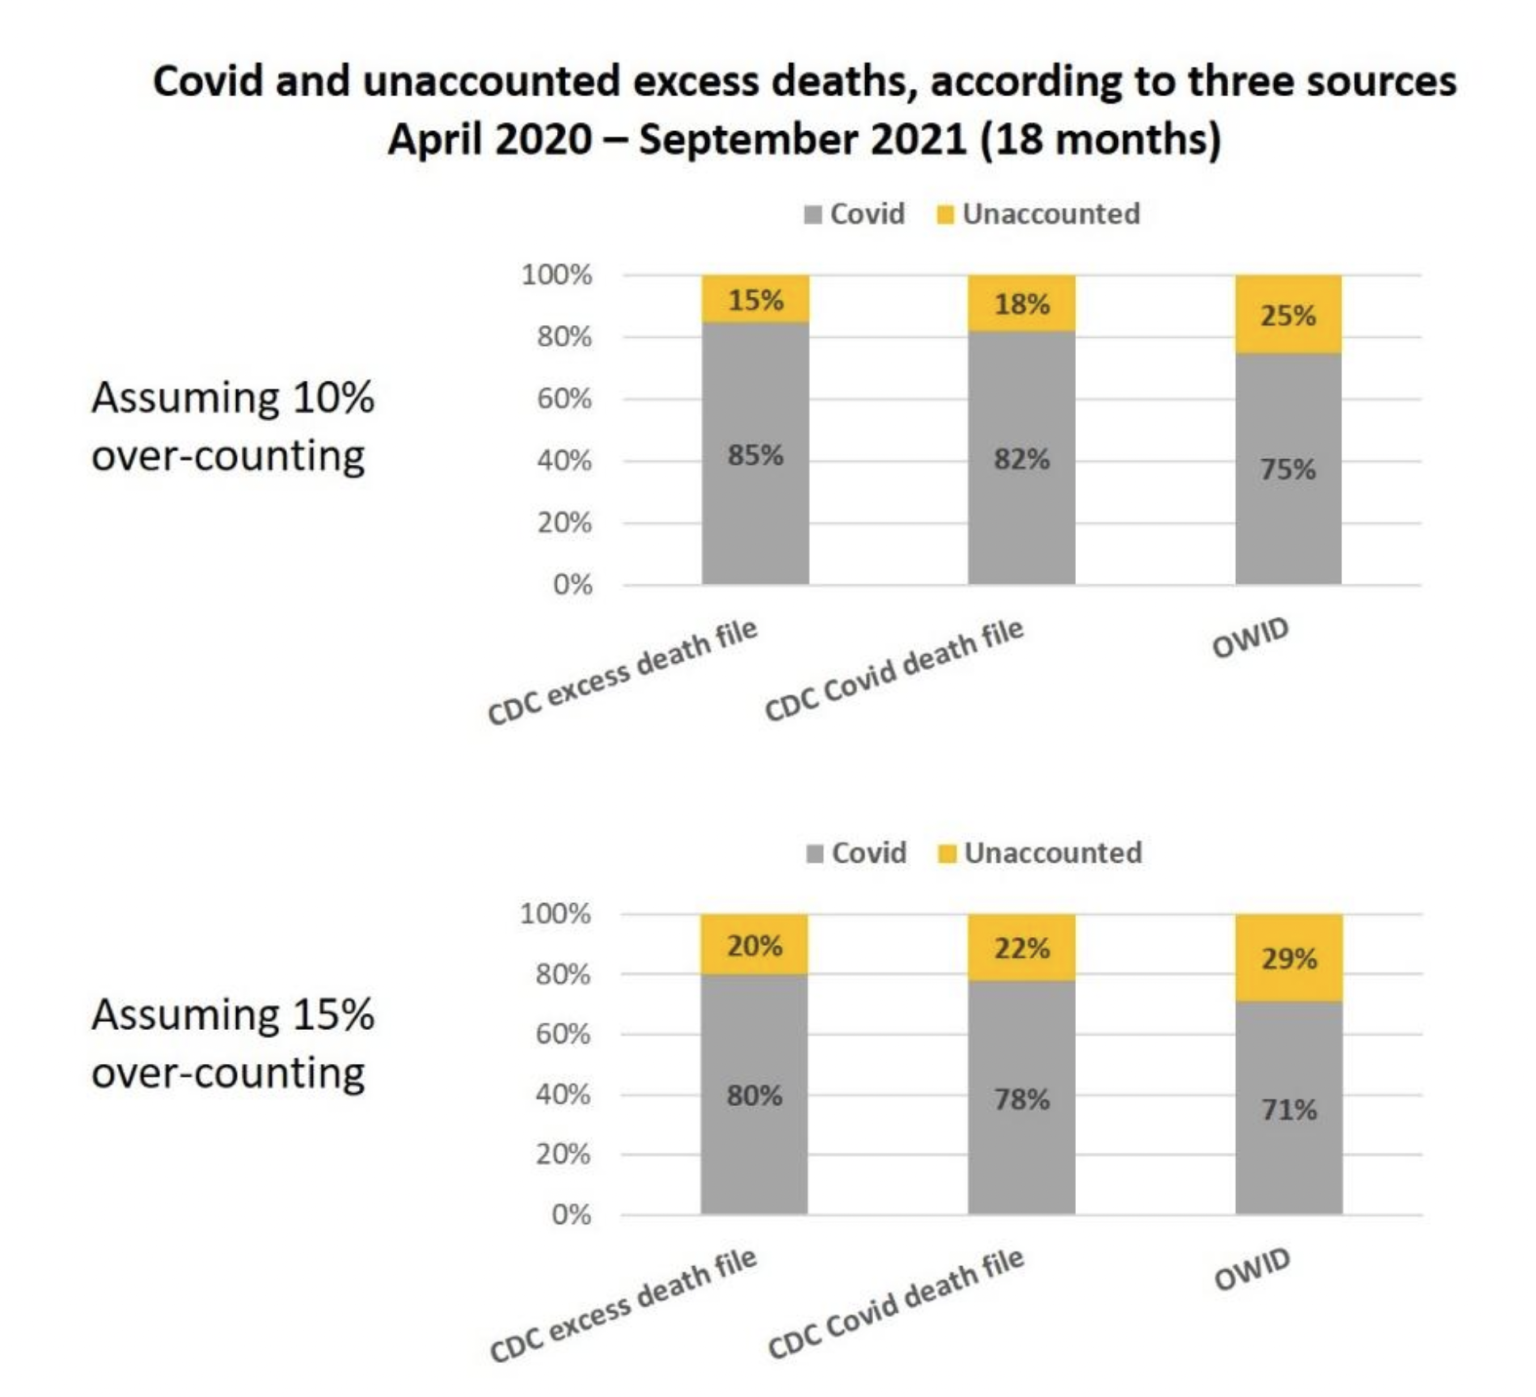
The first table (Figure 2) showed 6-16% unaccounted excess deaths over an 18-month period. That computation assumed that no death was misattributed to Covid, which is nonsense, of course – on both theoretical grounds and empirical evidence. We just saw substantial overcounting in the first five months of 2021.
A conservative estimate of misattribution over the 18-month period would allow for just 10%. That is, 90% of reported Covid deaths were true Covid deaths. The remainder belong to the category of unaccounted excess deaths. A realistic estimate might be 15%.
On these two assumptions, unaccounted deaths make up 15% to almost 30% of the excess mortality (Figure 6). The average of the six estimates is 21%.
Were these unavoidable pandemic deaths?
The CDC and other officials will call these deaths “indirect pandemic deaths.” They are not. Most of these deaths would not have happened if the Covid pandemic were handled like a previous flu pandemic – without fear-mongering, without lockdown, without symbolic masks, and without disruption of normal life. One journalist attributed them to “circumstances of the crisis.” Who created these circumstances?
The mystery of unaccounted excess deaths in the US is solved, at least in part. Many of them are accounted for by poorly justified interventions and relentless impositions on normal human activity.
At least 115,000 deaths belong in that category and the true number might be twice as high.
Postscript 2022 Excess Death Statistics
Jesse Santiano, M.D. brings the analysis up to date and adds an element in his article Excess deaths continue in 2022. Excerpts in italics.
I went to the CDC Wonder website to see if excess deaths are still present in 2022. February 2022 is still incomplete, so I compared only the month of January for each year from 2018 to 2022. Using the same month from 2018 to 2022 removes the seasonal variations in deaths.
2018 and 2019 are the pre-pandemic years and serve as a baseline trend. 2020 is the start of COVID-19, but in January 2020, it was just beginning, and there were only a tiny amount of COVID-19 deaths.

CDC: Coronavirus Disease 2019 Case Surveillance — United States, January 22–May 30, 2020
Since the shots were started in December 2020 (see appendix at the bottom), January 2021 will reflect the excess deaths from (a) COVID-19, (b) its injections for 18 and older, and (c) the effects of the lockdowns like suicides and domestic violence.
January 2022 reflects the excess deaths from the five years and older. Those are primarily due to the COVID injections since the dominant SARS-CoV-2 variant is the Omicron which is much less deadly than previous variants.
I grouped the ages into 10-year groups for simplicity. The years 2018 to 2022 have different features, which are discussed below. The table below is presented and repeated in the lower part of the page. The excess deaths (in red) for 2022 are in the right-most column.

What the table means
2018, 2019, and 2020
The number of deaths for all age groups in 2019 is lower than in 2018. There is a downward trend in mortality based on United Nations projections, as shown by the graph from macrotrends.net below.
A slight increase in deaths in January 2020 is expected, and this is due to population growth. According to the CDC, the rise in fatalities secondary to COVID-19 started in March 2020. (See CDC graph above)
2021
January 2021 shows the deaths from all causes, including COVID-19 and its shots. The age groups 18 and above who started to have the COVID injections in December 2020 will have more deaths in January 2021 than in January 2020.
In contrast, the <1 year to 14 years old who started late in getting the COVID shots (October 29, 2021, for 5-11 years old) have a lower number of deaths in 2021.
2022
The all-cause deaths in 2022 will include deaths from the less lethal Omicron variant and booster shots. The expected number of mortalities should be known for baseline comparison to know if there are excess deaths. The
In summary, this article shows that in January 2022, the death rates continue to exceed the expected number of deaths. If my assumptions and calculations are accurate, we may be witnessing the lasting effects of experimental gene therapy shots.

dont count on these type of facts ever changing the minds of the people who still believe the narrative, they woudl of lost the narrative belief had they just looked into one hour. but they refuse to do so, no understanding why not. those who are open minded enough have already seen the lies and fraud. it seems to me that classes have already been laid out and are pretty much set, I hope I am wrong tho. seems reason and logic cant overcome fear.
LikeLike
Yeah, it’s hard to be optimistic when people who are asleep call themselves “woke.”
LikeLiked by 2 people
Reblogged this on HiFast News Feed.
LikeLike
Reblogged this on Calculus of Decay and commented:
who will save us from this malfeasance
LikeLike