 For ice extent in the Arctic, the bar is set at 15M km2. The average peak in the last 17 years occurs on day 62 at 14.986M km2 before descending, though some years the extent can be above 15M much later. Ten of the last 17 years were higher than 15M, and recently 2020, 2022 and now 2023 ice extents cleared the bar at 15M km2. The actual day of annual peak ice extent varied between day 59 (2016) to day 82 (2012).
All of this means that 2023 peaked while passing the 15M km2 threshold two days later than average. The graph below shows the situation evolving over the last four weeks anticipating the annual maximum.
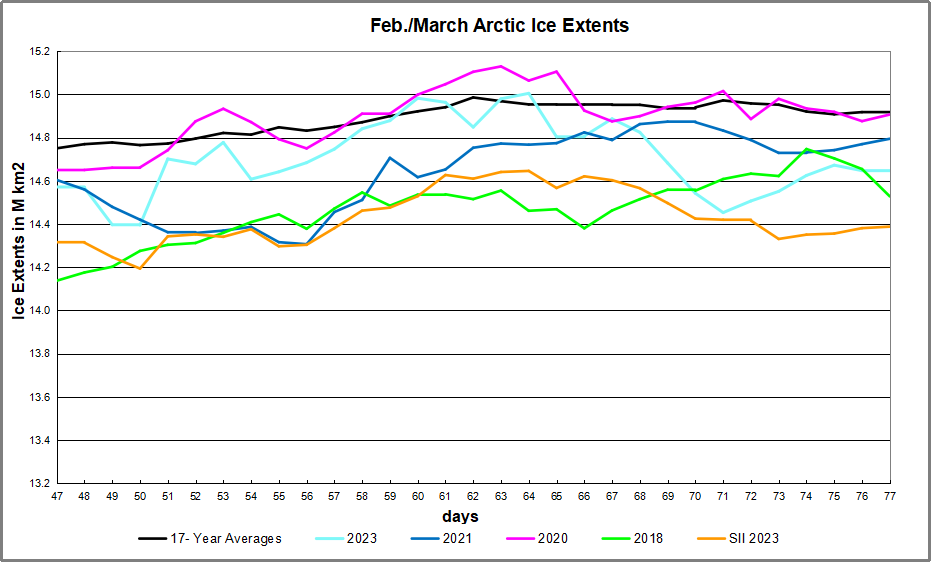
The NH ice extent gap on day 77 is at 269k km2, or 1.8%. After the day 62 peak, 2023 extents declined sharply until day 71 before recovering to reduce the deficit. (Note that ice extent is affected also by winds piling up drift ice, as well as melting from intrusions of warmer air or water.) SII has shown lower extents throughout this period, averaging 250k km2 less than MASIE.
March monthly average extents in recent years have been below average. While average extents will decline furher, we shall see what this year does with only two weeks left to make a difference.
| Region | 2023077 | Day 77 Average | 2023-Ave. | 2018077 | 2023-2018 |
| (0) Northern_Hemisphere | 14649553 | 14918812 | -269258 | 14528206 | 121348 |
| (1) Beaufort_Sea | 1070966 | 1070266 | 700 | 1070445 | 521 |
| (2) Chukchi_Sea | 966006 | 965801 | 206 | 966006 | 0 |
| (3) East_Siberian_Sea | 1087137 | 1087109 | 29 | 1087137 | 0 |
| (4) Laptev_Sea | 897845 | 897837 | 7 | 897845 | 0 |
| (5) Kara_Sea | 934539 | 922767 | 11771 | 934807 | -268 |
| (6) Barents_Sea | 605659 | 637818 | -32159 | 689702 | -84043 |
| (7) Greenland_Sea | 835991 | 617943 | 218048 | 514678 | 321313 |
| (8) Baffin_Bay_Gulf_of_St._Lawrence | 1249789 | 1546282 | -296493 | 1399951 | -150162 |
| (9) Canadian_Archipelago | 854843 | 853118 | 1724 | 853109 | 1734 |
| (10) Hudson_Bay | 1260903 | 1259573 | 1330 | 1257207 | 3696 |
| (11) Central_Arctic | 3243341 | 3217827 | 25514 | 3131403 | 111939 |
| (12) Bering_Sea | 739914 | 760728 | -20814 | 445480 | 294434 |
| (13) Baltic_Sea | 67881 | 80745 | -12864 | 127449 | -59568 |
| (14) Sea_of_Okhotsk | 822356 | 982054 | -159698 | 1136990 | -314633 |
The main deficit to average is in Baffin Bay and Sea of Okhotsk, partly offset by a surplus in Greenland Sea. Smaller pluses and minuses are found in other regions.
Typically, Arctic ice extent loses 67 to 70% of the March maximum by mid September, before recovering the ice in building toward the next March.
What will the ice do this year? Where will 2023 rank in the annual Arctic maximum competition?
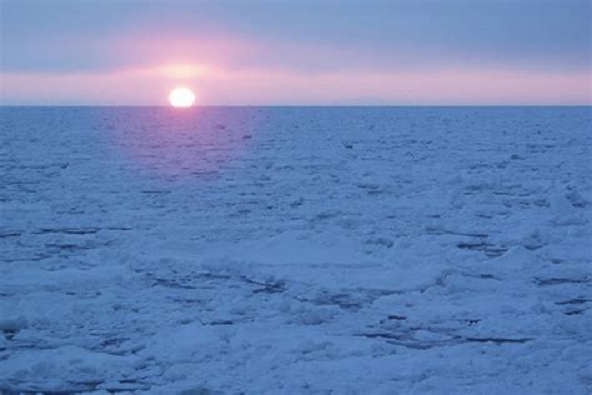
Drift ice in Okhotsk Sea at sunrise.

For more on the Pacific basins see post Meet Bering and Okhotsk Seas

Reblogged this on Climate Collections.
LikeLike