Greens Killing Electricity, Nuclear In Decline

Green energy initiatives are steadily undermining the electrical grid essential to modern society. Coal-fired power is often termed “Climate Enemy #1”, but the War on Nuclear Energy started much earlier and has been more successful. This century is seeing many NPP closures, and almost none constructed.

The problem is that Nuclear plants produce neither dispatchable nor nondispatachable power. Capital costs are high while variable costs of nuclear electricity are very low, and plants have long 30 to 40 year lifetimes. Nuclear is economic as a base load producer of reliable electricity 24/7. It is not intermittent like wind and solar, and not very flexible like coal, gas or hydro to ramp up or down to meet changing demand. As we shall see, public policies as well as markets are now skewed in favor of wind and solar. The deck is stacked against Nuclear, and base load supply to electrical grids is threatened, not to mention dreams of zero carbon power production.

Update June 5, 2019 Ohio House passes bill to save nuclear power plants with Democrats Support Reuters

Update May 31, 2019 at bottom Democrats’ Curious Disdain for Nuclear Power

Background: War on Nuclear Power

From Environmental Progress, excerpts in italics with my bolds.

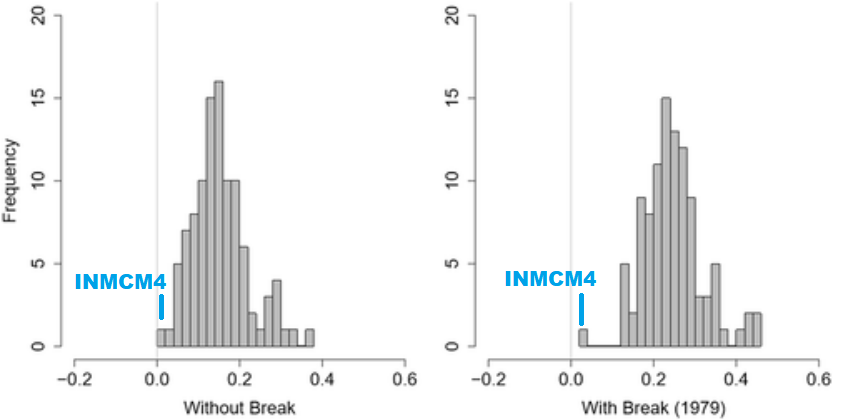
Nuclear has declined as a share of global electricity since 1995, and in absolute terms since 2006.

Nuclear’s underlying problem has to do with the well-funded and well-organized war against it that began in the 1960s.

Anti-nuclear groups opposed nuclear for being abundant and cheap and sought to make it expensive and scarce.

Anti-nuclear groups and individuals have consistently advocated coal and natural gas instead of nuclear for 40 years, and often accept contributions from fossil and other energy companies.

Even though nuclear is the safest way to make reliable electricity, it is regulated as though it is the most dangerous.

Opponents of nuclear have won large federal subsidies for wind and solar that have been in place for a quarter-century, and state clean energy mandates that explicitly exclude nuclear.

While it is tempting to blame low natural gas prices and misplaced post-Fukushima jitters, nuclear’s troubles are rooted in regulatory capture — a capture that finds its genesis in the origins of the U.S. environmental movement. This capture is now threatening to bring this climate-friendly energy source to the brink.

Everywhere the underlying reason is the same: anti-nuclear forces, in tandem with rent-seeking economic interests, have captured government policies. On one extreme lies Germany, which decided to speed up the closure of its nuclear plants following Fukushima. In Sweden the government imposed a special tax on nuclear. In the U.S., solar and wind are far more heavily subsidized than nuclear. And states across the nation have enacted Renewable Portfolio Standards, RPS, that mandate rising wind and solar, and that exclude nuclear.

In flat contradiction of their stated views that climate change represents an imminent catastrophic threat, anti-nuclear environmentalists from Germany to Illinois to California bless the burning of fossil fuels if it means they can force the closure of a nuclear power plant.

“We don’t need nuclear power,” environmental activist Bill McKibben told an audience at Middlebury in 2014, after a showing of the pro-nuclear documentary “Pandora’s Promise.” The world, he has repeatedly insisted, can be powered entirely on wind, water and solar energies. At the same time, Vermont Senator Bernie Sanders, whom McKibben endorsed early in the Democratic presidential nomination process, and national environmental groups, were quietly blessing the replacement of Vermont Yankee with natural gas.

The problem with nuclear is that it is unpopular, a victim of a 50 year-long concerted effort by fossil fuel, renewable energy, anti-nuclear weapons campaigners, and misanthropic environmentalists to ban the technology.

The Current Battle to Save Ohio’s Electrical Grid

Jessie Balmert writes in the Cincinnati Enquirer with an obvious bias against nuclear energy and in favor of wind and solar. Energy overhaul: ‘Clean Air Program’ just for nuclear plants, not wind or solar. Excerpts in italics with my bolds.

FirstEnergy Solutions, owner and operator of the Davis-Besse Nuclear Power Station, has cleared a hurdle in its bankruptcy proceedings after U.S. Bankruptcy Court Judge Alan Koschik on Monday approved FES’ amended reorganization plan. It was the fifth revised plan filed in bankruptcy court by FES. (Photo: File)

COLUMBUS – Ohio Republicans’ energy overhaul started as a thinly veiled attempt to rescue two northern Ohio nuclear plants with new fees on everyone’s electric bills.

Now, the veil is off.

Changes made to House Bill 6 last week would direct most of the $197.6 million collected from new fees on Ohioans’ electric bills to Akron-based FirstEnergy Solutions, which operates two nuclear plants outside Toledo and Cleveland.

Renewable energy companies from wind to solar would not get a cut of this “Ohio Clean Air Program.”

In a double blow, lawmakers also axed current programs that encourage electricity providers to purchase renewable energy and help customers become more energy efficient.

And lawmakers ensured utilities could charge customers a fee for two coal plants operated by Piketon-based Ohio Valley Electric Corporation through 2030. The plants are located in Gallipolis and Madison, Indiana.

The cost of a bailout

The latest version of House Bill 6 would charge Ohioans a $1 fee each month starting in 2021 for nuclear energy. The fee is higher for businesses ($15) and industrial customers ($250 to $2,500). Those fees end after 2026.

The proposal also allows electric companies to charge residents up to $2.50 each month for the two coal plants. This isn’t a new charge for many electricity customers, who are billed between $0.51 and $1.64 a month for these plants thanks to an Ohio Supreme Court decision. (An average Duke Energy Ohio residential customer pays $0.97 a month.)

But the proposed changes would lock that fee in until 2030.

At the same time, the bill eliminates current green energy and energy efficiency requirements, which cost the average customer about $4.39 each month.

Republican lawmakers argued the state shouldn’t be picking winners and losers in the energy market. Meanwhile, the bill has clear winners: nuclear and coal.

“My goal would be we should eventually get rid of all of this stuff and just let everybody compete as best as we can,” said Rep. Nino Vitale, R-Urbana, who leads the committee where the energy bill is being debated.

But the federal government already offers tax credits and benefits to renewable energy, creating an uneven playing field, Vitale said.

“Part of this bill is to correct the distortion – not bail someone out,” Vitale said.

At the heart of the debate is whether Ohio taxpayers should save FirstEnergy Solutions.

The company, which was spun off from parent FirstEnergy Corp., filed for bankruptcy in March 2018 with more than $2.8 billion in debt.

Without help from taxpayers, FirstEnergy Solutions says the company will close its two nuclear plants in Ohio: Davis-Besse, east of Toledo, in May 2020 and Perry, east of Cleveland, in May 2021.

The two plants employ more than 1,300 skilled workers who pay taxes and raise children in northern Ohio.

“We like to produce power in Ohio and use Ohio power,” said Larry Tscherne, business manager for International Brotherhood of Electrical Workers Local 245, which represents Davis-Besse workers.

But opponents of the bailout say FirstEnergy made poor business decisions by investing in coal and nuclear plants rather than diversifying its energy portfolio. The company’s financial situation is not Ohio ratepayers’ problem.

Nuclear energy is costly compared to natural gas, coal and some renewable energy. Nuclear plants require security, disaster plans and maintenance that other plants do not. That has made nuclear energy dependent on subsidies to survive nationwide.

“Clean air is obviously good,” testified Michael Haugh with the Ohio Consumers’ Counsel. “But having state government choose outcomes in the competitive marketplace is not good.”

The Case for Nuclear Power from Steffen Henne, head of research for the Center for Industrial Progress.

Q: The Ohio General Assembly is debating a new bill that would subsidize our two nuclear plants to keep them open. Apparently, the plants produce 14 percent of the state’s power. Would shutting them down (as seems likely if the bill fails) almost certainly raise carbon emissions, at least in the short term?

HENNE: This depends on many factors, including how much electricity from other states will be imported and how much new natural gas capacity will replace Ohio’s coal fleet in the coming years to fill the gap. Ohio’s power generation is dominated by natural gas (34 percent) and coal (47 percent) right now. Taking out 14-15 percent of zero-CO2 generation immediately would definitely lead to higher CO2 emissions compared to keeping these power plants alive, even if the absolute emissions might decline over time.

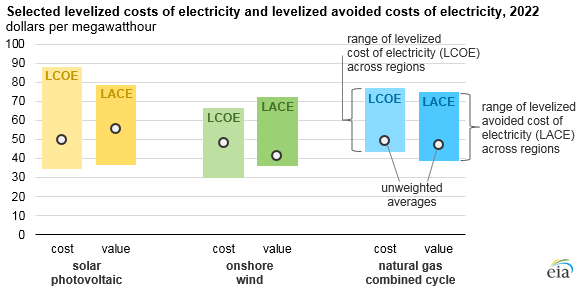
It’s noteworthy that the problems of nuclear and coal power plants to turn a profit are in some significant way rooted in the presence of unreliable solar and wind. Both technologies are able to produce very cheap baseload electricity but in an environment where solar and wind can just produce when the weather is right and every other generator has to adapt to the gluts and shortfalls, the cost this creates are high for nuclear and coal plants, which have been built to run at high capacity constantly. The current nuclear reactors are usually inefficient at what’s called load following because they were not designed to do that. Although solar and wind create the problem, they don’t have to pay for the cost in the current regulatory framework.

To the extent natural gas outcompetes nuclear on fair terms, that’s a different story, but it rarely makes sense to build a new natural gas power plant if the existing nuclear capacity could still do the job. And natural gas still emits more CO2 than existing nuclear power plants in any assessment I have ever seen.

Q: Does nuclear power offer the best hope as a power source that produces energy without carbon emissions and is available 24-7? Are the Generation IV nuclear power plants as promising as their proponents claim?

HENNE: There are really only two major countries that have created affordable, abundant power with low CO2 emissions, France and Sweden, and both have done it by using nuclear technology. You can use wind and solar to some extent and at a high cost, as Denmark has done, but this is not really scalable. Denmark now has the highest electricity prices in Europe together with Germany, in large part because of their focus on wind, and they are dependent on the constant imports and exports of power to stabilize their power grid. Without the availability of large conventional power fleets in their neighborhood, the wind experiment would already be over and Danes would sit in the dark. Germany doesn’t even meet its short-term goals in CO2 emission reductions because their costly scaling of solar and wind is completely insufficient.

Yes, nuclear energy right now is the only way to reduce CO2 by significant margins without ruining the economy, grid reliability, and energy security. That is because of the inherent properties in nuclear technology, which turns an abundantly available raw material into a concentrated energy source that does not emit CO2 from a chemical combustion process.

Generation IV is an umbrella term that applies to a variety of different technologies. It is difficult to judge at this stage which of these technologies will be successful or most successful at delivering the most abundant, affordable, and reliable energy. But some of the concepts are really promising. There are, for example, fast spectrum reactors, which promise to be able to use the “waste” of other nuclear fission reactors as fuel and overall increase efficiency of the fuel. Today’s typical reactors only use a tiny fraction of the energy content in the uranium or other fuels, which means there is huge potential for efficiency increase with innovation. Other innovative approaches seek to circumvent the cost escalations in the current American regulatory and anti-nuclear social framework, which for the industry means large reactors will be delayed for years or even decades, increasing the upfront cost. Small modular reactors, which can be built in a factory instead of requiring extensive on-site work, might be a good option to reduce cost.

All that innovation potential should be exciting news for everyone concerned about CO2 emissions and the availability of affordable energy to advance human flourishing.

Q: What do you make of the fact that green organizations generally oppose nuclear power, and also insist that climate change is an emergency that must be addressed immediately?

HENNE: I think we have to recognize that for organizations like Greenpeace it doesn’t make sense to actually solve a problem. The more abstract and diffuse the doomsday narrative, the better for their business model. Both climate change catastrophism and nuclear catastrophism are really great for them.

There is also an esoteric religious component to it. The reason why wind and solar are the preferred green “solution” is that they are supposedly natural versus the “artificial” splitting of the atom. Facts don’t matter in that narrative. Although nuclear is the safest technology to generate power it is still vilified as poisonous and dangerous.

Solar and wind are not proposed because they are real solutions but because they fit into that religious thinking.

The most immoral part of it is the absolute disregard for human flourishing. If you cannot afford energy, you have no energy. If you don’t have reliable energy, you have no energy. But affordable and reliable energy is probably the most central aspect of our survival and safety, including safety from climate. Over the last 100 years, climate-related deaths plummeted. Not because the climate suddenly became so much better for us, although the mild warming and increasing CO2 over recent decades was certainly beneficial to us, but because we were able to use technology to protect us from a naturally dangerous environment. And that required the caliber of energy that so far only fossil fuels, nuclear technology, and to some extent large-scale hydropower were able to deliver on a scale of billions.

Summation from Michael Schellenberger at Quillette Why Renewables Can’t Save the Planet

The problem with nuclear is that it is unpopular, a victim of a 50 year-long concerted effort by fossil fuel, renewable energy, anti-nuclear weapons campaigners, and misanthropic environmentalists to ban the technology.

In response, the nuclear industry suffers battered wife syndrome, and constantly apologizes for its best attributes, from its waste to its safety.

Lately, the nuclear industry has promoted the idea that, in order to deal with climate change, “we need a mix of clean energy sources,” including solar, wind and nuclear. It was something I used to believe, and say, in part because it’s what people want to hear. The problem is that it’s not true.

France shows that moving from mostly nuclear electricity to a mix of nuclear and renewables results in more carbon emissions, due to using more natural gas, and higher prices, to the unreliability of solar and wind.

Oil and gas investors know this, which is why they made a political alliance with renewables companies, and why oil and gas companies have been spending millions of dollars on advertisements promoting solar, and funneling millions of dollars to said environmental groups to provide public relations cover.

What is to be done? The most important thing is for scientists and conservationists to start telling the truth about renewables and nuclear, and the relationship between energy density and environmental impact.

“Nuclear power is one of the chief long-term hopes for conservation … Cheap energy in unlimited quantities is one of the chief factors in allowing a large rapidly growing population to preserve wildlands, open space, and lands of high scenic value … With energy we can afford the luxury of setting aside lands from productive uses.”

Fifty years of empirical research show that Siri was right and the anti-growth anti-people extremists who started the anti- nuclear movement were wrong. More energy is good for people, and it’s good for nature.

Energy allows cities and agricultural intensification, which frees the countryside for return of forests and wildlife. Moving to nuclear frees us from air pollution, including carbon emissions.

Update May 31, 2019 Democrats’ Curious Disdain for Nuclear Power

Just published at National Review:  Until they embrace nuclear energy as a key to reducing emissions, the party’s many presidential candidates will be hard to take seriously on climate change.  Excerpts in italics with my bolds.

The Democrats’ disdain for nuclear energy deserves attention, because there is no credible pathway toward large-scale decarbonization that doesn’t include lots of it. That fact was reinforced Tuesday, when the International Energy Agency published a report declaring that without more nuclear energy, global carbon dioxide emissions will surge and “efforts to transition to a cleaner energy system will become drastically harder and more costly.”

At the same time that an increasing number of rural communities are fighting the encroachment of large-scale renewable projects, the U.S. is facing a wave of nuclear-reactor retirements. Nine reactors in the U.S. are slated to be retired over the next three years, and the IEA estimates that domestic nuclear capacity could shrink by more than half in the next 20 years. The agency points to the many challenges facing the nuclear sector, including increased regulations, low-cost natural gas, and competition from subsidized renewables.

This is, frankly, one of the biggest and longest-running disconnects in American politics: The leaders of the Democratic party insist that the U.S. must make big cuts in greenhouse-gas emissions because of the threat posed by climate change, but for nearly five decades, they have either ignored or professed outright opposition to nuclear energy. The last time the party’s platform contained a positive statement about nuclear power was way back in 1972.

America’s top Democrats repeatedly tout the need for “clean” energy and massive deployments of wind and solar power, but by denying the role that nuclear energy must play in any successful decarbonization efforts, they are ignoring the scientific consensus. If they truly care about the dangers posed by climate change, they should stand up and tell the truth about the need for nuclear energy. Until that happens, their various plans to address the issue will be impossible to take seriously.

Footnote:

Many do not realize how intermittent power from wind and solar farms cannibalize the electricity supply.  Since wind and solar capacity is subsidized, any actual power they produce gets top priority for consumption, since it has little or no marginal cost to the grid.  So on days when solar power is abundant in the afternoon, it absorbs the high price demand, while base load and dispatchable plants are denied that revenue.  That pattern will drive those plants into bankruptcy, leaving the grid without backup power, unless more subsidies are added to keep them open.

NPR Defends Pseudo-Science

This morning in the car doing some errands I listened to an NPR broadcast regarding a NYT article claiming the Trump administration is attacking the fundamentals of climate science. Two journalists involved in the NYT article made two revealing defenses of IPCC climate ideology.

First they objected to the Geological Survey decision to limit consideration (required by US law) of climate change to impacts foreseen between now and 2040, setting aside projections out to 2100. Their reasoning: We won’t see any significant effects from our reducing (or not) CO2 emissions until the second half of this century. All of the forecasted temperature rise of 8F, along with sea level rise, storms, droughts, floods, etc. is only seen to occur after 2040. How do they know this? It is certain because it comes directly from the Oracle of Delphi the Climate Models, which have so accurately forecast the climate in the past (sic).  All the pressure to unplug industrial civilization now, with results to appear many decades later.

Then they expressed shock that a Presidential Commission may be set up to review and questions climate assumptions put into agency planning. They said everyone agrees on the science of global warming, and this is not the way climate science is done. The two journalists, without a single bit of self-awareness, proceeded to discredit the possible chairman William Happer by saying he was not a “climate scientist.” Like, how would they know? He is a world expert on atmospheric gases responses to infrared radiation, which is the supposed mechanism of man made global warming, and something about which they  are  clueless.

In other news today, Arnold Swartzenegger was “starstruck” to meet with teen climate activist Greta Thunberg. How bad will this nightmare get before people wake up?

See Also Stop Fake Science. Approve the PCCS!

Get a Second Opinion Before Climate Surgery

Cutting Through the Fog of Renewable Power Costs


Most every day there are media reports saying solar and wind power plants are now cheaper than coal. Recently UCS expressed outrage that some coal plants remain viable because industrial customers are able to commit purchasing of the reliable coal-fired supply.

Joe Daniel writes at Forbes The Billion-Dollar Coal Bailout Nobody Is Talking About: Self-Committing In Power Markets. A typical companion piece at Forbes claims The Coal Cost Crossover: 74% Of US Coal Plants Now More Expensive Than New Renewables, 86% By 2025.

Having acquired some knowledge of this issue, I wondered how these cost comparisons dealt with the intermittency problem of wind and solar, and the requirement for backup dispatchable power to balance the grid.

EIA has developed a dual assessment of power plants using both Levelized Cost and Levelized Avoided Costs of Electricity power provision. The first metric estimates output costs from building and operating power plants, and the second estimates the value of the electricity to the grid. Source: EIA uses two simplified metrics to show future power plants’ relative economics Excerpts in italics with my bolds.

EIA calculates two measures that, when used together, largely explain the economic competitiveness of electricity generating technologies.

The levelized cost of electricity (LCOE) represents the installed capital costs and ongoing operating costs of a power plant, converted to a level stream of payments over the plant’s assumed financial lifetime. Installed capital costs include construction costs, financing costs, tax credits, and other plant-related subsidies or taxes. Ongoing costs include the cost of the generating fuel (for power plants that consume fuel), expected maintenance costs, and other related taxes or subsidies based on the operation of the plant.

The levelized avoided cost of electricity (LACE) represents that power plant’s value to the grid. A generator’s avoided cost reflects the costs that would be incurred to provide the electricity displaced by a new generation project as an estimate of the revenue available to the plant. As with LCOE, these revenues are converted to a level stream of payments over the plant’s assumed financial lifetime.

Power plants are considered economically attractive when their projected LACE (value) exceeds their projected LCOE (cost). Both LCOE and LACE are levelized over the expected electricity generation during the lifetime of the plant, resulting in values presented in dollars per megawatthour. These values range across geography, as resource availability, fuel costs, and other factors often differ by market. LCOE and LACE values also change over time as technology improves, tax credits and other taxes or subsidies expire, and fuel costs change.

The relative difference between LCOE and LACE is a better indicator of economic competitiveness than either metric alone. A comparison of only LCOE across technology types fails to capture the differences in value provided by different types of generators to the grid.

Some power plants can be dispatched, while some—such as those powered by the wind or solar—operate only when resources are available. Some power plants provide electricity during parts of the day or year when power prices are higher, while others may produce electricity during times of relatively low power prices.

Solar PV’s economic competitiveness is relatively high through 2022 as federal tax credits reduce PV’s LCOE. As those tax credits are phased out, technology costs are expected to have declined to the point where solar PV remains economically competitive in most parts of the country. Because solar PV provides electricity during the middle of the day, when electricity prices are relatively high, solar PV’s value to the grid (i.e., LACE) tends to be higher than other technologies.

Onshore wind also sees higher economic competiveness in the earlier part of the projection, prior to the expiration of federal tax credits in 2020. Over time, wind remains competitive in the Plains states, where wind resources are highest. Wind’s LACE is relatively low in most areas, as wind output tends to be highest at times when power prices are low.

[Note: The video Can We Rely on Wind and Solar?  was banned by Youtube after 2 miilion views some years ago.  It can still be viewed on Facebook

To get the coal comparison to renewables, there is a study Benchmark Levelized Cost of Electricity Estimates from National Academies Press. Excerpts in italics with my bolds.

The EIA Annual Energy Outlook supporting information identifies the methodology and assumptions that affect the reported estimates of LCOE for utility-scale generation technologies. The reported estimates are for the years 2022 and 2040. The focus here is on the 2022 estimates as the benchmark for the “current” costs. The assumptions include choices regarding the effects of learning, capital costs, transmission investment, operating characteristics, and externalities. These choices are both important and appropriate for the benchmark comparison (e.g., learning rates), are important and require some adjustment (e.g., capital costs), or are supplemental to the EIA assumptions (e.g., externality costs).

Note:  For the externality of CO2 emissions, the chart below shows a $15/ton “Social Cost of Carbon.”

EIA separates electricity generation technologies into categories of dispatchable and nondispatchable (EIA, 2015f, p. 6). The former include conventional fossil fuel plants that have a fairly consistent available capacity and can follow dispatch instructions to increase or decrease production. The latter consist of intermittent plants such as wind and solar, which depend on the availability of the wind and sunlight and typically cannot follow dispatch instructions easily or at all. It is generally recognized that the different operating profiles create different values for the technologies (Borenstein, 2012; Joskow, 2011). Empirical estimates for existing technologies show that the value of wind, which blows more at night when prices are low, can be 12 percent below the unweighted average price of electricity; and the value of solar, with the sun tending to shine when prices are higher, can be 16 percent greater than the unweighted average (Schmalensee, 2013).

One procedure utilized for putting nondispatchable technologies on an equivalent basis is to pair them with appropriately scaled dispatchable peaking technologies to produce an output that is like that of a conventional fossil fuel plant (Greenstone and Looney, 2012). Another approach, used by Schmalensee (2013), is to calculate the value of nondispatchable technologies based on spot prices. EIA provides a similar estimate based on its projected simulations, which is known as the levelized avoided cost estimate (LACE).

For purposes of equivalent comparison of the LCOE, the approach here combines these adjustments to provide an estimate of the net difference between the LACEs for the technology and for a conventional combined-cycle natural gas plant. The net differences are added to (e.g., for wind) or subtracted from (e.g., for solar) the other components of the LCOE.

With the above assumptions and adjustments to obtain an approximation of equivalent LCOE, the results appear in Figure B-1 and Table B-1.


FIGURE B-1 Levelized cost of electricity for plants entering service in 2022 (2015 $/MWh).
SOURCE: EIA, 2015f, 2016g. Because Annual Energy Outlook 2016 does not assess conventional coal and IGCC technologies, their values (in 2013 dollars) were sourced from Annual Energy Outlook 2015 and then converted to 2015 dollars using the Bureau of Economic Analysis’ gross domestic product (GDP) implicit price deflator.

It is clear from Figure B-1 that new natural gas plants are the dominant technology. And without accounting for the costs of externalities, new IGCC coal plants are more competitive than even the best of the wind and solar. Onshore wind is the closest to being competitive. But the relative cost estimates shown here are similar to those in Greenstone and Looney (2012). The primary renewable technologies are not cost-competitive, and the differences are significant. This is for entry year 2022. Looking ahead to 2040, with some additional cost reductions for renewables and more substantial increased fuel costs for natural gas, the situation changes for wind but not for solar.

CONCLUSION

Equivalent estimates of the LCOE are available from the supporting analyses of AEO2016. The data without the effect of selective policies indicate that existing technologies for clean energy are not competitive with new natural gas. And without accounting for the costs of externalities, the principal renewable technologies of wind and solar are not cost-competitive with new coal plants.

FIGURE B-2 Electric power generation by fuel (billions of kilowatt hours [kWh]) assuming No Clean Power Plan, 2000-2040. SOURCE: EIA, 2016f, Figure IF3-6.

[Note:  Again Youtube banned the video “Bill Gates Slams Unreliable Wind and Solar Power Energy.” It can still be viewed on Facebook:

Footnote: The above analyses do not adequately consider the effect of cheap subsidized solar and wind power driving dispatchable power plants into bankruptcy.  For more on electricity economics see Climateers Tilting at Windmills

Climate Out of Control

Coors Baseball Field, Denver, Colorado, April 29, 2019

Frank Miele writes at Real Clear Politics Climate Is Unpredictable, Weather You Like It or Not!
Excerpts in italics with my bolds.

They say all politics is local; so is all weather.

So on behalf of my fellow Westerners, I have to ask: What’s up with all this cold weather? It may not be a crisis yet, but in the two weeks leading up to Memorial Day — the traditional start of summer activities — much of the country has been donning sweaters and turning up the heat.

I know, I know. Weather is not climate, and you can’t generalize from anecdotal evidence of localized weather conditions to a unified theory of thermal dynamics, but isn’t that exactly what the climate alarmists have done, on a larger scale, for the past 25 years?

Getting Coors Field ready for Colorado Rockies to play baseball.

Haven’t we been brainwashed by political scientists (oops! I mean climate scientists!) to believe that the Earth is on the verge of turning into “Venus: The Sequel.” You know, catastrophic overheating from greenhouse gases, rising oceans, death and mayhem — oh, yeah, and the world ending in 12 years if we don’t ban carbon or something.

But despite the best fake climate data and the scariest computer simulations, Mother Nature doesn’t seem to be cooperating with the global-warming scare scenario. Sure, there is warm weather in other parts of the country, but here in Montana we have been desperately seeking spring. Instead of enjoying our beautiful outdoors, we are stuck in perennial chill mode, shivering under our blankets and wondering if it will snow in late May.

Cars pile up in the snow, Denver, May 21, 2019

In Denver, they didn’t have to wonder. Last Tuesday that area got more than three inches of the white stuff, the most at this late date since 1975. They also matched the record low of 31 degrees. Snow also hit Minnesota, Arizona and California. Yosemite had as much as two feet of snow fall.

Should we start to panic? Roll out computer models to explain why our tootsie toes are turning blue? Maybe we could get rich by promoting the end of the world — even if it’s by ice instead of fire. But let’s face it, intelligent people already know that climate changes on a regular basis and that mankind deals with it just as other species do — by adapting. Technically, we are currently between ice ages, so if it gets a little cold, here’s some advice — get used to it! And if it gets a little warmer? Be grateful! Ice ages are much more deadly than any old heat wave.

Fact of the matter is that for the past few years, real scientists have been warning us that sunspot activity is currently at an unusually low level. In February, there was not even one sunspot recorded, and history tells us that fewer sunspots means colder weather. That’s why current predictions call for cooling weather for the next 20-30 years till the sunspot cycle ticks upward again.

OK, the climate terrorists tell us, you may be right about the next 30 years but that doesn’t mean global warming won’t resume a few years after that. Well, no, but what they won’t tell you is that during the period of increased warming in the late 20th century, sunspot activity was at an 8,000-year high. That was the conclusion of a study in 2004 led by Sami Solanki of the Max Planck Institute in Germany.

So let me get this straight. When sunspot activity is at millennially high levels, Earth gets warmer. When sunspot activity drops to negligible levels, Earth gets cooler. Sounds like a pattern, doesn’t it? In fact, it sounds like something that would interest real scientists.

So why don’t climate scientists just admit that humans don’t control climate, and get on with the business of recording data and analyzing it? That’s easy to explain. Because you can’t mandate massive changes in human behavior if the sun dictates terrestrial temperature variations. The sun doesn’t care what Democratic propagandists say, and all the carbon in the world won’t put one little ol’ sunspot on the surface of our nearest star, so you can expect the sun to be dismissed as irrelevant. Carbon is king.

After all, who ya gonna believe? Al Gore or your own lying thermometer?


It’s Models All the Way Down

In Rapanos v. United States, Justice Antonin Scalia offered a version of the traditional tale of how the Earth is carried on the backs of animals. In this version of the story, an Eastern guru affirms that the earth is supported on the back of a tiger. When asked what supports the tiger, he says it stands upon an elephant; and when asked what supports the elephant he says it is a giant turtle. When asked, finally, what supports the giant turtle, he is briefly taken aback, but quickly replies “Ah, after that it is turtles all the way down.”  By this analogy, Scalia was showing how other judges were substituting the “purpose” of a law for the actual text written by congress.

The moral of the story is that our perceptions of reality are built upon assumptions. The facts from our experience are organized by means of a framework that provides a worldview, a mental model or paradigm of the way things are. Through the history of science, various pieces of that paradigm have been challenged and have collapsed when contradicted by fresh observations and measurements from experience. Today a small group of scientists have declared themselves climate experts and claim their computer models predict a dangerous future for the planet because of our energy choices.

The Climate Alarmist paradigm is described and refuted in an essay by John Christy published by GWPF The Tropical Skies: Falsifying climate alarm. The content comes from his presentation 23 May 2019 to a meeting in the Palace of Westminster in London, England. Excerpts in italics with my bolds

At the global level a significant discrepancy has been confirmed between empirical measurements and computer predictions.

“The global warming trend for the last 40 years, starting in 1979 when satellite measurements began, is +0.13C per decade or about half of what climate models predicted.”

Figure 3: Updating the estimate.
Redrawn from Christy and McNider 2017.

The top line is the actual temperature of the global troposphere, with the range of original 1994 study shown as the shaded area. We were able to calculate and remove the El Niño effect, which accounts for a lot of the variance, but has no trend to it. Then there are these two dips in global temperature after the El Chichón and Mt Pinatubo eruptions. Volcanic eruptions send aerosols up into the stratophere, and these reflect sunlight, so fewer units of energy get in and the earth cools. I developed a mathematical function to simulate this, as shown in Figure 3d. 

After eliminating the effect of volcanoes, we were left with a line that was approximately straight, apart from some noise. The trend, the dark line in Figure 3e, was 0.095◦C per decade, almost exactly the same as in our earlier study, 25 years before.

Our result is that the transient climate response – the short-term warming – in the troposphere is 1.1◦C at the point in time when carbon dioxide levels double. This is not a very alarming number. If we perform the same calculation on the climate models, you get a figure of 2.31◦C, which is significantly different. The models’ response to carbon dioxide is twice what we see in the real world. So the evidence indicates the consensus range for climate sensitivity is incorrect.

Almost all climate models have predicted rapid warming at high altitudes in the tropics due to greenhouse gas forcing.

They all have rapid warming above 30,000 feet in the tropics – it’s effectively a diagnostic signal of greenhouse warming. But in reality it’s just not happening. It’s warming up there, but at only about one third of the rate predicted by the models.”

Figure 5: The hot spot in the Canadian model.
The y-axis is denominated in units of pressure, but the scale makes it linear in altitude.

Almost all of the models show such a warming, and none show it when extra greenhouse gas forcing is not included. Figure 6 shows the warming trends from 102 climate models, and the average trend is 0.44◦C per decade. This is quite fast: over 40 years, it amounts to almost 2◦C, although some models have slower warming and some faster. However, the real-world warming is much lower; around one third of the model average.

Figure 7 shows the model projections in pink and different observational datasets in shades of blue. You can also easily see the difference in warming rates: the models are warming too fast. The exception is the Russian model, which has much lower sensitivity to carbon dioxide, and therefore gives projections for the end of the century that are far from alarming. The rest of them are already falsified, and their predictions for 2100 can’t be trusted.

The next generation of climate models show that lessons are not being learned.

“An early look at some of the latest generation of climate models reveals they are predicting even faster warming. This is simply not credible.”

Figure 8: Warming in the tropical troposphere according to the CMIP6 models.
Trends 1979–2014 (except the rightmost model, which is to 2007), for 20°N–20°S, 300–200 hPa.

We are just starting to see the first of the next generation of climate models, known as CMIP6. These will be the basis of the IPCC assessment report, and of climate and energy policy for the next 10 years. Unfortunately, as Figure 8 shows, they don’t seem to be getting any better. The observations are in blue on the left. The CMIP6 models, in pink, are also warming faster than the real world. They actually have a higher sensitivity than the CMIP5 models; in other words, they’re apparently getting worse! This is a big problem.


Figure 9: (b) Enlargement and simplification of the tropical troposphere
The tropical troposphere in the Fifth Assessment Report.
The coloured bands represent the range of warming trends. Red is the model runs incorporating natural and anthropogenic forcings, blue is natural forcings only. The range of the observations is in grey

Conclusion

So the rate of accumulation of joules of energy in the tropical troposphere is significantly less than predicted by the CMIP5 climate models. Will the next IPCC report discuss this long running mismatch? There are three possible ways they could handle the problem:
• The observations are wrong, the models are right.
• The forcings used in the models were wrong.
• The models are failed hypotheses.

I predict that the ‘failed hypothesis’ option will not be chosen. Unfortunately, that’s exactly what you should do when you follow the scientific method.

New Low in Climate Posturing

At least Madonna posing was entertaining, and children get to feel good about skipping school in order to stop the climate from changing.  But some posturing is both vapid and damaging.

The New York Post Editorial Board explains: A new low in posturing over climate change. Excerpts in italics with my bolds.

Of all New York politicians’ efforts to posture on climate change, the drive to divest public pension funds from fossil fuels may be the most deranged.

The bill from state Sen. Liz Krueger (D-Manhattan) and Assemblyman Felix Ortiz (D-B’klyn) would force state Comptroller Tom DiNapoli to sell off all the fund’s holdings in the 200 largest oil, gas and coal companies within five years.

The unions whose members’ retirements depend on the funds are against it. A union-funded report found that the fossil-fuel holdings outperform their green-energy counterparts in the long term.

Also in opposition is DiNapoli, who notes that “manipulation by legislative fiat has hurt pension funds in other states.”

The pension fund pays more than $1 billion a month in benefits. With an unaudited value of $210.2 billion, it now has about $6 billion in fossil-fuel stocks. Diversification of investments is central to fiscal prudence: Let politicians start banning any given stock, and you’re well on the road to requiring a massive taxpayer bailout — and/or huge cuts to the pensions of some classes of retirees.

Thankfully, New York courts have struck down past legislative efforts to mandate specific investment decisions: The state Constitution protects the comptroller’s discretion.

But that’s no guarantee that the principle will survive the climate-change zealots. After all, Gov. Andrew Cuomo has called on the state authorities he controls (the MTA, the New York Power Authority, the Thruway Authority) to divest from fossil fuels.

All that magical thinking about fighting climate change just might persuade state judges. And DiNapoli is surely worried that, if he goes to court over the issue, he’ll face a challenger in the next election who’ll promise to do as the green extremists demand.

Sensible lawmakers need to quash this nonsense before it goes any further.

Models Wrong About the Past Produce Unbelievable Futures

Models vs. Observations. Christy and McKitrick (2018) Figure 3

The title of this post is the theme driven home by Patrick J. Michaels in his critique of the most recent US National Climate Assessment (NA4). The failure of General Circulation Models (GCMs) is the focal point of his presentation February 14, 2018. Comments on the Fourth National Climate Assessment. Excerpts in italics with my bolds.

NA4 uses a flawed ensemble of models that dramatically overforecast warming of the lower troposphere, with even larger errors in the upper tropical troposphere. The model ensemble also could not accommodate the “pause” or “slowdown” in warming between the two large El Niños of 1997-8 and 2015-6. The distribution of warming rates within the CMIP5 ensemble is not a true indication of a statistical range of prospective warming, as it is a collection of systematic errors. Despite a glib statement about this Assessment fulfilling the terms of the federal Data Quality Act, that is fatuous. The use of systematically failing models does not fulfill the “maximizing the quality, objectivity, utility, and integrity of information” provision of the Act.

USGCRP should produce a reset Assessment, relying on a model or models that work in four dimensions for future guidance and ignoring the ones that don’t.

Why wasn’t this done to begin with? The model INM-CM4 is spot on, both at the surface and in the vertical, but using it would have largely meant the end of warming as a significant issue. Under a realistic emission scenario (which USGCRP also did not use), INM-CM4 strongly supports the “lukewarm” synthesis of global warming. Given the culture of alarmism that has infected the global change community since before the first (2000) Assessment, using this model would have been a complete turnaround with serious implications.

The new Assessment should employ best scientific practice, and one that weather forecasters use every day. In the climate sphere, billions of dollars are at stake, and reliable forecasts are also critical.

The theme is now picked up in the latest NIPCC report on Fossil Fuels. Chapter 2 is the Climate Science background and the statements below in italics with my bolds come from there.

Chapter 2 Climate Science Climate Change Reconsidered II: Fossil Fuels

Of the 102 model runs considered by Christy and McKitrick, only one comes close to accurately hindcasting temperatures since 1979: the INM-CM4 model produced by the Institute for Numerical Mathematics of the Russian Academy of Sciences (Volodin and Gritsun, 2018). That model projects only 1.4°C warming by the end of the century, similar to the forecast made by the Nongovernmental International Panel on Climate Change (NIPCC, 2013) and many scientists, a warming only one-third as much as the IPCC forecasts. Commenting on the success of the INM-CM model compared to the others (as shown in an earlier version of the Christy graphic), Clutz (2015) writes,

(1) INM-CM4 has the lowest CO2 forcing response at 4.1K for 4xCO2. That is 37% lower than multi-model mean.

(2) INM-CM4 has by far the highest climate system inertia: Deep ocean heat capacity in INM-CM4 is 317 W yr m-2 K -1 , 200% of the mean (which excluded INM-CM4 because it was such an outlier).

(3)INM-CM4 exactly matches observed atmospheric H2O content in lower troposphere (215 hPa), and is biased low above that. Most others are biased high.

So the model that most closely reproduces the temperature history has high inertia from ocean heat capacities, low forcing from CO2 and less water for feedback. Why aren’t the other models built like this one?

The outputs of GCMs are only as reliable as the data and theories “fed” into them, which scientists widely recognize as being seriously deficient (Bray and von Storch, 2016; Strengers, et al., 2015). The utility and skillfulness of computer models are dependent on how well the processes they model are understood, how faithfully those processes are simulated in the computer code, and whether the results can be repeatedly tested so the models can be refined (Loehle, 2018). To date, GCMs have failed to deliver on each of these counts.

The reference above is to a study published in July 2018 by John Christy and Ross McKitrick  A Test of the Tropical 200‐ to 300‐hPa Warming Rate in Climate Models. Excerpts in italics with my bolds.

Abstract

Overall climate sensitivity to CO2 doubling in a general circulation model results from a complex system of parameterizations in combination with the underlying model structure. We refer to this as the model’s major hypothesis, and we assume it to be testable. We explain four criteria that a valid test should meet: measurability, specificity, independence, and uniqueness. We argue that temperature change in the tropical 200‐ to 300‐hPa layer meets these criteria. Comparing modeled to observed trends over the past 60 years using a persistence‐robust variance estimator shows that all models warm more rapidly than observations and in the majority of individual cases the discrepancy is statistically significant. We argue that this provides informative evidence against the major hypothesis in most current climate models.

Discussion

All series‐specific trends and confidence intervals are reported in the supporting information Table S1. The mean restricted trend (without a break term) is 0.325 ± 0.132°C per decade in the models and 0.173 ± 0.056°C per decade in the observations. With a break term included they are 0.389 ± 0.173°C per decade (models) and 0.142 ± 0.115°C per decade (observed). Figure 4 shows the individual trend magnitudes. The red circles and confidence interval whiskers are from models, and the blue are observed.  Trend magnitudes and 95% confidence intervals. Number in upper left corner indicates number of model trends (out of 102) that exceed observed average trend.

If models accurately represented the magnitude of 200‐ to 300‐hPa warming with only nonsystematic errors contributing noise, these distributions would be centered on zero. Clearly, they are centered above zero, in fact in both the restricted and general cases, the entire distribution is above zero.

Table S2 presents individual run test results. In the restricted case, 62 of the 102 divergence terms are significant, while in the general case, 87 of 102 are. The model‐observational discrepancy is not simple uncertainty or random noise but represents a structural bias shared across models.

Worst and Best Models (Table S2) No Break With Break
bcc‐csm1‐1 220.1 593.3
CanESM2 410.3 534.4
CCSM4 258.1 430.6
EC‐EARTH 296.0 222.5
FIO‐ESM 129.2 310.9
GISS‐E2‐H 157.3 444.8
GISS‐E2‐H‐CC 139.0 468.5
GISS‐E2‐R 382.4 237.7
HadGEM2‐ES 50.0 575.4
INMCM4 0.0 2.9

Note. First column: test score for restricted case (no break). Score is significant at 5% if it exceeds 41.53. Second column: test score for unrestricted case (with break at 1979). Score is significant at 5% if it exceeds 50.48.

Conclusion

Comparing observed trends to those predicted by models over the past 60 years reveals a clear and significant tendency on the part of models to overstate warming. All 102 CMIP5 model runs warm faster than observations, in most individual cases the discrepancy is significant, and on average the discrepancy is significant. The test of trend equivalence rejects whether or not we include a break at 1979 for the PCS, though the rejections are stronger when we control for its influence. Measures of series divergence are centered at a positive mean and the entire distribution is above zero. While the observed analogue exhibits a warming trend over the test interval it is significantly smaller than that shown in models, and the difference is large enough to reject the null hypothesis that models represent it correctly, within the bounds of random uncertainty.

Footnote:

The reference to Clutz (2015) is the post Temperatures According to Climate Models

See also: 2018 Update: Best Climate Model INMCM5

Required Reading: NIPCC 2019 Summary on Fossil Fuels

Those who seek the truth about global warming/climate change should welcome this latest publication from the Nongovernmental International Panel on Climate Change (NIPCC). Excerpts from the Coauthors’ introduction in italics with my bolds. H/T Lubos Motl

Climate Change Reconsidered II: Fossil Fuels assesses the costs and benefits of the use of fossil fuels (principally coal, oil, and natural gas) by reviewing scientific and economic literature on organic chemistry, climate science, public health, economic history, human security, and theoretical studies based on integrated assessment models (IAMs). It is the fifth volume in the Climate Change Reconsidered series and, like the preceding volumes, it focuses on research overlooked or ignored by the United Nations’ Intergovernmental Panel on Climate Change (IPCC).

NIPCC was created by Dr. S. Fred Singer in 2003 to provide an independent peer review of the reports of the United Nations’ Intergovernmental Panel on Climate Change (IPCC). Unlike the IPCC and as its name suggests, NIPCC is a private association of scientists and other experts and nonprofit organizations. It is not a government entity and is not beholden to any political or corporate benefactors. This and previous volumes in the CCR series, along with other publications and information about NIPCC, are available for free on NIPCC’s website .

The NIPCC authors do something their IPCC counterparts never did: conduct an evenhanded cost-benefit analysis of the use of fossil fuels. Despite calling for the end of reliance on fossil fuels by 2100, the IPCC never produced an accounting of the opportunity cost of restricting or banning their use. That cost, a literature review shows, would be enormous.

We thank the more-than-100 scientists, scholars, and experts who participated over the course of four years in writing, reviewing, editing, and proofreading this volume. This was a huge undertaking that involved thousands of hours of effort, the vast majority of it unpaid. The result exceeded our hopes, and we trust it meets your expectations.

The NIPCC authors cite thousands of books, scholarly articles, and reports that contradict the IPCC’s alarmist narrative. We once again tried to remain true to the facts when representing the findings of others, often by quoting directly and at some length from original sources and describing the methodology used and qualifications that accompanied the stated conclusions. The result may seem tedious at times, but we believe this was necessary and appropriate for a reference work challenging many popular beliefs.

The NIPCC authors conclude, “The global war on energy freedom, which commenced in earnest in the 1980s and reached a fever pitch in the second decade of the twenty-first century, was never founded on sound science or economics. The world’s policymakers ought to acknowledge this truth and end that war.”

Footnote:

Lubos Motl commented on this publication following his translating of the SPM into Czech.  Some excerpts in italics.

The NIPCC reports are actually amazing

Previous NIPCC volumes have also been extensive and they dedicated more space to the physical and biological scientific foundations. The newest 2019 report dedicated to the fossil fuels is unavoidably more practical and economics-oriented.

But it rationally discusses all the extra layers of the causal chains of the climate warning. Even if one assumes that there will be a warming, does it hurt the environment? The economy? Don’t the benefits exceed the costs? Don’t the costs of the mitigation policies exceed their benefits? As you may guess, the correct answers to all these questions – advocated in the NIPCC report – are almost universally the “skeptical ones”.

It’s so unfortunate that despite the higher quality of the NIPCC report (or at least comparable quality, if one were really generous to the IPCC), the left-wing media establishment – in some loose alliance with the governments – was capable of promoting the IPCC reports as if they were the Holy Scriptures while the NIPCC reports remained almost completely hidden from the world public. 

Are you wealthy enough to believe in Climate Change?

Some insights from an article by Adam Brickley in the Daily Signal Australia’s Election Shock Shows the Perils of Moralizing Climate Change. Excerpts in italics with my bolds.

One post-mortem on the election from the Australian Broadcasting Corporation pointed out the wealth issue thusly:

In [Warringah’s] case and in other inner-city seats, support for climate action looks broadly consistent with a “post-materialist” sensibility. … Here the emphasis on quality of life over immediate economic and physical needs encourages a focus on issues like climate change. But this is a sensibility that speaks to those in higher socio-economic brackets, and principally with higher levels of education.

Put more bluntly, climate-based politics appeal primarily to those insulated from the potential economic consequences of climate policies by their high incomes, and shielded from even seeing those effects by their urbanized lifestyles.

Those not materially blessed enough to live as “post-materialists,” however, still make their decisions based on what it takes to put food on the table, pay the rent, and provide for their families.

This sort of growing rich-poor political divide is not unique to Australia. In Israel, working-class Israelis have solidified behind Prime Minister Benjamin Netanyahu while wealthy areas swing strongly against him.

In the United States, Donald Trump won states like Michigan and Wisconsin while some of Brooklyn’s trendiest neighborhoods elected Alexandria Ocasio-Cortez to the House.

It’s not just that the working class is drifting right. The upper classes, especially in gentrifying inner cities, are gravitating hard to a left that is increasingly focused on perceived moral issues and less interested in bread-and-butter economics.

However, there is one key difference that makes Australia unique. Perhaps more than any other nation, Australia has seen climate change loom over its politics for over a decade.

Former Labor Prime Minister Kevin Rudd made it the signature issue of his premiership from 2007-2010, with at least one costly program literally going up in flames. Rudd’s plan to re-insulate Australian homes for energy efficiency failed to account for the flammability of the new insulation and led to the deaths of four workers.

In 2009, Rudd’s cap-and-trade proposal caused a massive split in the Liberal Party when then-party leader Malcolm Turnbull tried to force the party to support Rudd on the issue—leading the party’s legislators to remove him and replace him with anti-cap-and-trade leader Tony Abbott.

Australia has been through “climate change elections” before, and experimented with environmental policy as much as any nation on Earth. The results illustrate what happens when politics becomes centered on creating a “better world” by making life harder in the real world.

Such ideas may gain traction among those who know they can afford to weather the storm, and the rich can condemn the poor for their “materialism” in rejecting the new order, but working people (rightly) prioritize feeding their children as a higher moral goal.

Given that Australia’s ever-shifting politics has sometimes drawn comparisons to “Game of Thrones,” perhaps it’s worth noting that Australian Labor and Daenerys Targaryen learned the same lesson in their big finales this weekend: No matter how lofty your aims, there’s little morality in burning the world down in the name of building a better one.

Don’t Miss the Memo on Climate Change


Marlo Lewis, Jr. provides a web memo entitled A Policy Maker’s Guide to Climate Change Excerpts in italics with my bolds.

Here are five things you need to know:

1. Climate change is not a “planetary emergency.”

2. The climate catastrophe narrative is concocted out of overheated climate models, inflated emission scenarios, political hype, and unmerited pessimism about human adaptive capabilities.

3. All metrics of human well-being show the state of the world is improving; sustaining such progress requires greater access to affordable energy.

4. The very real costs of climate “solutions” hugely exceed their hypothetical benefits.

5. Citizens have more to fear from the climate policy agenda than from climate change itself.

This memo provides supporting evidence for those conclusions.For example,

Models vs. Data. Much of what passes for climate science today is model-based speculation about future climate impacts. The United Nations Intergovernmental Panel on Climate Change (IPCC) runs an ensemble of 32 model groups called CMIP5.[1] The models on average projected twice as much warming over the past 40 years as actually occurred in the lower global atmosphere.[2]

A reasonable explanation for the models’ lack of realism is that they overestimate climate sensitivity—the long-term change in average global temperature after a doubling of atmospheric carbon dioxide concentration. The average climate sensitivity estimated in two dozen recent studies is 40 percent lower than the average estimated by the U.N. models.[3]

Only one model in the CMIP ensemble has accurately tracked temperature trends in the bulk atmosphere over the past 40 years—the Russian INM-CM4. When INM-CM4 is run with a realistic emission scenario in which natural gas increasingly displaces coal as an electricity fuel, the world achieves the Paris climate treaty’s 1.5°C warming limit with no new climate policies.[7]

Improving State of the World. If climate change were a global ecological crisis, we would expect to find evidence of declining human health and well-being. Instead, we find dramatic improvement in life expectancy, per capita income, food security, and various health related metrics.[8]

Conclusion. Perceptions of a “planetary emergency” arise from overheated climate models, inflated emission scenarios, disregard of basic data on human health and well-being, and relentless exaggeration by political interests claiming to speak for “the science.” The very real costs of coercive de-carbonization outweigh the hypothetical benefits. The more “ambitious” the climate policy, the more likely it is to damage economic growth, consumer welfare, and our institutions of self-government.[42]

Link to WebMemo in pdf format A Policy Maker’s Guide to Climate Change