GHGs Endangerment? Evidence?


Stanford sock4

Once again Stanford University (my alma mater) fills its stocking with coal instead of scientific gifts. It is often said, “Extraordinary claims require extraordinary evidence.” As we will see, a recent Stanford climate change publication makes over-the-top claims based upon suppositions rather than evidence. The paper published in Science is Strengthened scientific support for the Endangerment Finding for atmospheric greenhouse gases, by Philip B. Duffy et al. Two of the leading (out of 15) authors are Christopher B. Field and Noah S. Diffenbaugh of Stanford’s Woods Institute for the Environment. Excerpts in italics with my bolds.

The abstract makes extraordinary claims:

Abstract
We assess scientific evidence that has emerged since the U.S. Environmental Protection Agency’s 2009 Endangerment Finding for six well-mixed greenhouse gases, and find that this new evidence lends increased support to the conclusion that these gases pose a danger to public health and welfare. Newly available evidence about a wide range of observed and projected impacts strengthens the association between risk of some of these impacts and anthropogenic climate change; indicates that some impacts or combinations of impacts have the potential to be more severe than previously understood; and identifies substantial risk of additional impacts through processes and pathways not considered in the endangerment finding.

The core of their argument is:

The EF was structured around knowledge related to public health and public welfare, with a primary focus on impacts in the U.S. The information on public welfare was grouped in sections on (1) air quality, (2) food production and agriculture, (3) forestry, (4) water resources, (5) sea level rise and coastal areas, (6) energy, infrastructure, and settlements, and (7) ecosystems and wildlife. We follow that organization here. In addition, some of the most important advances in understanding the risks of climate change involve sectors or impact types not highlighted in the EF. We summarize the evidence for four of these that are broadly important: ocean acidification, violence and social instability, national security, and economic wellbeing. We characterize changes since the EF in terms of (1) strength of evidence for a link with anthropogenic climate change, (2) potential severity of observed and projected impacts, and (3) risks of additional kinds of impacts, beyond those considered in the EF (Fig. 1).

Fig. 1
Summary of changes in the amount and implications of new evidence since the EF, on each of the impact areas discussed in the EF, and four additional impact areas where evidence of climate sensitivity has matured since the EF.
An upward pointing arrow indicates increasing evidence of endangerment. A downward pointing arrow indicates decreasing evidence of endangerment. A solid arrow indicates that the new evidence is abundant and robust. An outlined arrow indicates that the new evidence, in addition, comes from multiple approaches, is based on independent lines of information, or builds on a new level of mechanistic understanding. The left column refers to confidence in the impacts discussed in the EF. The middle column refers to impact areas that are discussed in the EF but where new evidence points to specific impacts that are fundamentally more severe or pervasive than those discussed in the EF. The right column refers to types of impacts not discussed in the EF.

What about the Warming?

Let’s start with their first theme: We characterize changes since the EF in terms of (1) strength of evidence for a link with anthropogenic climate change. Looking in the text we find the single point of evidence to be a projection from CMIP5 climate models, represented in this diagram:

Fig. 2 The frequency of years in 2080 to 2099 of the RCP8.5 scenario where the June-July-August (JJA) seasonal temperature equals or exceeds the warmest JJA value in the period from 1986 to 2005.

Now showing the globe in bright red colors is certainly in the Christmas spirit and would make a fine ornament for the tree. But there are several problems. We are supposed to believe they can predict summer temperatures 60 to 80 years from now, when trustworthy weather models become unreliable more than 10 days in the future. Next, on average CMIP5 models are configured to forecast future warming at a rate 5 times the past warming (historically observed). Then, the CO2 concentrations fed into the models come from the notorious RCP8.5 scenario.

People like Dr. Judith Curry who have looked into the suppositions comprising RCP8.5 have concluded that it is not only extreme, it is so unlikely as to be nearly impossible. Thus it serves as a scare tactic, but not for reasonable future projections. See: Is RCP8.5 an impossible scenario?

The burning world figure comes from this paper by one of the Stanford lead authors Climate change hotspots in the CMIP5 global climate model ensemble. Out of an array of various projection images, obviously the global warming ornament was chosen specifically for its cherry red color.

To see how they mislead with this model output, let’s consider comparable observations. For the same season (NH Summer), Berkeley Earth provides this global summary of recent warming:

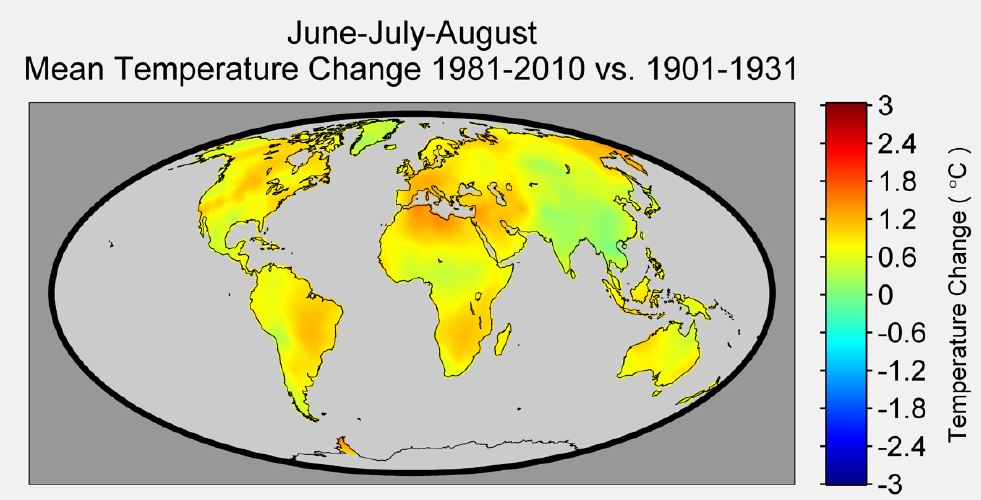
So in the last century of observed temperatures, we get yellows and greens, warming of 0.0 to 1.0 degrees celsius. But the models say the next century we will be on fire. And there is another deception. Notice that the BEST globe shows only continents since that dataset is built on records from land stations. Figure 2 above smears warming also over the oceans (71% of earth’s surface), when we know that land temps are much more volatile than is the ocean. For example, here is a comparable representation of sea surface temperatures (SSTs):

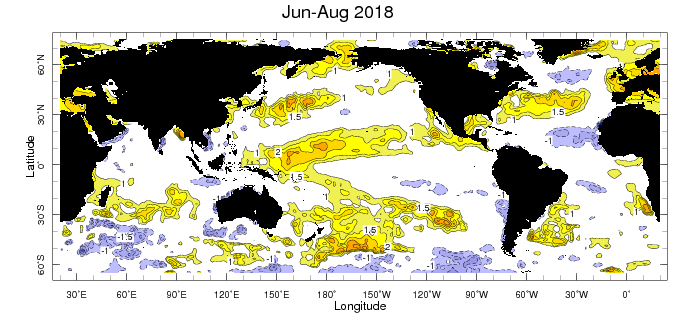
This map displays seasonal standardized sea surface temperature anomalies for the season indicated.

The climatological base period used to calculate the sea surface temperature anomalies is 1971-2000, and the base period used for the standardization is November 1981 to present. Yellow to orange colors on the map indicate areas where sea surface temperature for the season shown is above the climatological value for that season of the year, and blue shades indicate where sea surface temperature is below normal. Shading and contours start at +/- 1.0 s.d., and the shading and contour interval is 0.5 s.d. Source: Columbia IRI climate monitoring (here)

Again, observations do not portend what the unvalidated climate models predict. There are some warm spots, cool spots, and a lot of neutral.

0d37f35b357b035e4623ae67429c4c4afad51c806fe2ccdbad14772381992347

What about the Impacts?

Turning to the main theme of this report: We characterize changes since the EF in terms of (2) potential severity of observed and projected impacts, and (3) risks of additional kinds of impacts, beyond those considered in the EF. The bulk of the text and all of the 281 references pertain to impacts expected from models’ supposed warming. The same research process is repeated ad infinitum: Plug the extreme scenario assumptions into models super-sensitive to GHGs, and then project the horrific impacts from such unlikely levels and supposed results. And the usual litany of disasters is covered (from Duffy et al.2018):

The information on public welfare was grouped in sections on (1) air quality, (2) food production and agriculture, (3) forestry, (4) water resources, (5) sea level rise and coastal areas, (6) energy, infrastructure, and settlements, and (7) ecosystems and wildlife.

Billions of dollars have been spent researching any and all negative effects from a warming world: Everything from Acne to Zika virus.  But these are not what we have experienced and observed, rather they are the models’ imagined future.

Litany of Changes

Seven of the ten hottest years on record have occurred within the last decade; wildfires are at an all-time high, while Arctic Sea ice is rapidly diminishing.

We are seeing one-in-a-thousand-year floods with astonishing frequency.

When it rains really hard, it’s harder than ever.

We’re seeing glaciers melting, sea level rising.

The length and the intensity of heatwaves has gone up dramatically.

Plants and trees are flowering earlier in the year. Birds are moving polewards.

We’re seeing more intense storms.

But: Weather is not more extreme.
And Wildfires were worse in the past.
But: Sea Level Rise is not accelerating.

But: Arctic Ice has not declined since 2007.
arctic-sept-2007-to-20181

But: All of these are within the range of past variability.

In fact our climate is remarkably stable.

And many aspects follow quasi-60 year cycles.

But: Actual climate zones are local and regional in scope, and they show little boundary change.


But: Ice cores show that it was warmer in the past, not due to humans.

But: The planet is greener because of rising CO2.

In conclusion:

Duffy et al. Omitted Recent Scientific Findings that Contradict their Alarms

You may have noticed that no downward arrows appeared in Duffy et al. summary of new science regarding GHG endangerment.  Let’s correct that now.  In addition to exhibits above, there are several findings refuting the link between CO2 emissions and global temperatures.

Why is there no mention of the CERES satellite data showing no effect of rising GHGs upon the radiative behavior of the atmosphere?

We once again observe a rather close match overall. At the very least, we can safely say that there is no evidence whatsoever of any gradual, systematic rise in DWLWIR over the TLT, going from 2000 to 2018. If we plot the difference between the two curves in Fig.9 to obtain the “DWLWIR residual”, this fact becomes all the more evident:

Why do they ignore the radiosonde data showing the temperature profile of the atmosphere has not shifted as GHG theory predicts?

Why do they not report that the optical density at the top of the atmosphere has not changed in 60 years despite rising CO2?

And why do they fail to point out that CMIP5 models only match temperature observations in the tropical troposphere when the CO2 sensitivity is turned off?

In addition, there is no mention that GCMs projections are running about twice as hot as observations. Omitted is the fact GCMs correctly replicate tropospheric temperature observations only when CO2 warming is turned off.

Figure 5. Simplification of IPCC AR5 shown above in Fig. 4. The colored lines represent the range of results for the models and observations. The trends here represent trends at different levels of the tropical atmosphere from the surface up to 50,000 ft. The gray lines are the bounds for the range of observations, the blue for the range of IPCC model results without extra GHGs and the red for IPCC model results with extra GHGs.The key point displayed is the lack of overlap between the GHG model results (red) and the observations (gray). The nonGHG model runs (blue) overlap the observations almost completely.

Summary:

This paper does not prove GHGs endanger the climate.  It repeats old suppositions and disregards contrary observational evidence, both new and long-established.

See also:  No GHG Warming Fingerprints in the Sky

Climate alarms are balanced on an array of suppositions.


Courts Still Shielding Mann from Climate Exposure


An editorial from National Review summarizing how the courts function as Michael Mann’s protective shield  NR Won’t Be Cowed by a Litigious Michael Mann  December 21, 2018.  Excerpts below with my bolds.

At this rate, Jarndyce v. Jarndyce will be replaced in the Western canon as the go-to example of the court case that never ends by National Review, Inc. v. Michael E. Mann, which is now well into its seventh year as a live proposition and, alas, showing no end in sight.

For those who have forgotten, this is the 2012 case in which Mann sued National Review for libel over a 270-word blog post that criticized his infamous “hockey stick” graph portraying global warming, in response to which National Review refused to acquiesce to what was, and remains, nothing less than an attempt to use the law to bully the press into submission. That this case is both frivolous in nature and clear-cut in National Review’s favor seems to be obvious to everyone except for Michael Mann and the D.C. Court of Appeals. Indeed, in the years since Mann made his play, National Review has been joined by a veritable Who’s Who of American media organizations — including, but not limited to, the ACLU, the National Press Club, Comcast, the Cato Institute, the Washington Post, Time Inc., Reporters Committee for Freedom of the Press, and the Electronic Frontier Foundation, all of which have filed amicus briefs on NR’s side. Tellingly, National Review has also been supported by the City of Washington, D.C., in which jurisdiction the case was brought. And yet, inexplicably, the D.C. Court of Appeals continues to drag its feet.

This is extraordinary, especially given that at stake here is the integrity of the First Amendment. It is extraordinary foremost because National Review’s case is both straightforward and strong: that it is not, and it has never been, the role of the courts to settle literary or scientific disputes. But it is also extraordinary because National Review’s case is being heard under rules laid out by Washington, D.C.’s robust “anti-SLAPP” law, the explicit purpose of which is to make it more difficult to harass people and organizations with frivolous libel threats and thereby to protect a sturdy culture of free speech. How, we ask, can this be reconciled with a case such as ours, in which, among other inexplicable delays, the court has taken two years to add a single footnote to the records (and modify another)? That a slam-dunk case that is being examined under an expedited process should have yielded so many years of expensive radio static is a genuine national disgrace, and should be widely regarded as such.

National Review neither encourages nor enjoys protracted, expensive, tedious litigation. Indeed, it is our resolute view that questions such as these must be resolved outside of the courtroom. But we will be cowed neither by pressure nor by the passage of time, and we are proud of our role as a champion of the First Amendment. To those who would abridge, undermine, or attempt to circumvent that bulwark of free expression, our response is, as it ever was: Get Lost.

See also:  Rise and Fall of the Modern Warming Spike

School Reality vs. Identity Ideology

Heather MacDonald writes as update on the struggle in schools to create an educational environment in the face of student misbehavior sanctioned by minority racial privileges. Her article at City Journal is Back to Discipline. Excerpts in italics with my bolds.

Disparate impact reflects disparate reality.

A federal commission on school safety has repudiated the use of disparate-impact analysis in evaluating whether school discipline is racially biased. The Trump administration should go further, and extirpate such analysis from the entirety of the federal code of regulations, as well as from informal government practice.

Disparate-impact analysis holds that if a facially-neutral policy negatively affects blacks and Hispanics at a higher rate than whites and Asians, it is discriminatory. Noticing the behavioral differences that lead to those disparate effects is forbidden. In the area of school discipline, disparate-impact analysis results in the conclusion that racially neutral rules must nevertheless contain bias, since black students nationally are suspended at nearly three times the rate of white students. In 2014, the Obama administration relied on this methodology to announce that schools that suspended or expelled black students at higher rates than white students were violating anti-discrimination laws.

To understand how counterfactual such an analysis is, consider Duval County, Florida, which has Florida’s highest juvenile homicide rate. Seventy-three children, some as young as 11, have been arrested for murder and manslaughter over the last decade, according to the Florida Times-Union. Black juveniles made up 87.6 percent of those arrests and whites 8 percent. The black population in Duval County—which includes Jacksonville—was 28.9 percent in 2010 and the white population 56.6 percent, making black youngsters 21.6 times more likely to be arrested for homicide than white youngsters. Nationally, black males between the ages of 14 and 17 commit homicide at ten times the rate of white and Hispanic male teens combined; if Hispanics were removed from the equation, the black-white disparity would be much greater.

Beneath those homicide numbers is a larger juvenile crime wave. “The reason so many kids commit murder in Jacksonville is not because they are murderers, but because they are everything else: drug dealers, robbers, thieves, rapists and a bunch of other types of criminals whose crimes of choice has a great likelihood of leading to a murder,” a teen murder convict, Aaron Wright, told the Florida Times-Union. Fifty-nine percent of juvenile murder convicts from Duval County who responded to the paper’s inmate survey reported that they were committing another crime such as robbery or burglary when they or their co-defendant killed their victim. Wright himself was robbing a woman when his fellow robber shot and killed her, making Wright guilty of felony murder.

The same family dysfunction and lack of socialization that create this juvenile crime wave inevitably affects classroom behavior. Duval County Public Schools also have the highest number of violent campus incidents of any Florida school district. Nationwide, schools with the highest minority populations report the highest number of disciplinary infractions. Schools that are 50 percent minority or more experience weekly gang activity at nearly ten times the rate of schools where minorities constituted 5 percent to 20 percent of the population, according to the 2018 “Indicators of School Crime and Safety” report produced by the U.S. Justice and Education Departments. Gang violence in schools with less than 5 percent minority populations was too low to be usable statistically. Widespread weekly disorder in classrooms was reported in schools with at least 50 percent minority populations at more than five times the rate as in schools with 5 percent to 20 percent minorities. More than four times as many high-minority schools reported weekly verbal abuse of teachers compared with schools with a minority student body less than 20 percent. Widespread disorder and teacher abuse at schools with less than 5 percent minority populations was again too low to be statistically reliable.

The “School Crime and Safety” reports produced during the Obama years contained identical disparities. And yet the Obama administration held that the only possible reason why blacks are disciplined in school more than whites is teacher and administrator bias. Never mind that teaching is the most “woke” profession in the country after social work, with education schools frantically indoctrinating their students in white privilege and critical race theory.

And so school districts, threatened with a loss of federal funding if they didn’t reduce racial disparities in discipline, left disruptive students in the classroom rather than removing them. The results were predictable: chaos and less learning than ever. In Des Moines, for example, students hit teachers and other students with little consequence, according to the Des Moines Register, leading to a teacher exodus. A nine-year-old boy was repeatedly struck by a fellow student, but the teacher felt powerless to do anything lest she be accused of discriminating against a minority student.

In 2018, a cell-phone video captured a classroom assault emblematic of the post-disciplinary era. A physics teacher in Texas had confiscated a student’s smart phone. “Give me my fucking phone. This is the last time asking your stupid ass,” the teen yelled, towering over the teacher sitting frozen behind his desk, grinning nervously, the very image of submission. The student aggressively swept the papers on the teacher’s desk to the floor, then violently shoved him in the face. Still impassive, the teacher pushed the phone across the desk back to the student, who grabbed it with a self-righteous shrug and strode away. The school principal explained that it “was just a bad day the student was having,” and commended the teacher’s response. The other students who observed this adult capitulation to thuggery learned a terrible lesson about their apparent immunity from any consequences for atrocious behavior.

A substitute teacher who worked in Los Angeles’s inner-city schools documents similar insubordination in his recent book, Sit Down and Shut Up: How Discipline Can Set Students Free. One student, recounts author Cinque Henderson, shoved a pregnant teacher in order to grab her laptop and watch a video. The dean then interrogated the teacher about why the student was not “jibing with her.” An instructor from Miami-Dade County told Henderson: “It is virtually impossible to discipline a student. I know we are losing a generation of kids of color as a result of allowing them to run wild.”

The Times-Union analysis identifies the biggest factor in juvenile violence: absent fathers. Eighty-four percent of the juvenile murderers who responded to the paper’s survey had what the paper discreetly calls “divorced or separated parents”—the reality more likely being that their parents never married in the first place. “I believe that my life may have took a different turn . . . had my father been a man and raised me,” a 61-year-old teen murderer and career criminal told the paper.

Excusing insubordination and aggression in the name of racial equity is not a civil rights accomplishment. The third-party victims of such behavior are themselves disproportionately minority—whether fellow classmates who cannot learn, or law-abiding residents of high-crime neighborhoods who have to worry about taking their children safely to school without being carjacked or caught in a drive-by shooting.

But the alleged beneficiary of a racial double standard in conduct is also a victim. Schools are usually the last chance to civilize children if their family has failed to do so. They accomplish that civilizing mission through the application of a color-blind behavioral code, neutrally enforced, that communicates to students that their behavioral choices have consequences. A student who perceives that his race is an excuse for bad conduct will be handicapped for life. Pace the race advocates, it is this disparate-impact-induced state of affairs—not the supposed implicit racism of teachers and principals—that constitutes an actual school-to-prison pipeline.

Not all of the administration’s social policies are as farsighted as the rescission of disparate-impact analysis in student discipline. This week, Trump signed an executive order creating “opportunity zones,” a concept trotted out by every administration over the last 40 years to revive low-income communities. But tax rates are not the main impediment to investment in poor communities; crime is. If the Trump administration wanted to continue breaking the mold of stale poverty initiatives, it would focus on family breakdown as the cause of urban crime and disorder. While policy is severely limited in its capacity to restore marriage norms, the administration should use every rhetorical outlet available to revalorize fathers and men.

Meantime, expect a battle over the future of disparate-impact analysis. The New York Times has accused the Trump administration of attacking “protections for minority students,” and the advocates are predictably outraged. Incoming House Speaker Nancy Pelosi has promised to defend “vital student anti-discrimination protections.” The incoming head of the House Education Committee, Bobby Scott, will likely seek to enshrine disparate-impact methodology further in statutory law. Doing so would not only distort policymaking; it would also continue poisoning civil discourse and society with unjustified claims of racism. The only antidote to such a counterattack is a willingness to tell the truth about the behavioral disparities that create disparate impact in the first place.

Heather Mac Donald is the Thomas W. Smith Fellow at the Manhattan Institute, a contributing editor of City Journal, and the author of The Diversity Delusion: How Race and Gender Pandering Corrupt the University and Undermine Our Culture.

Energy Conundrums

world energy by sources

Anyone paying attention to global warming/climate change knows that activists intend to disrupt (legally or otherwise) the energy platform supporting modern industrial society. It is a radical movement since the developed world (think G20) depends upon fossil fuels for nearly 90% of its energy. Gail Tverberg has again insightfully probed into the ways our energy supply is impacted by these alarmist concerns. Whether or not you believe global warming is now or could become catastrophic (I don’t), policymakers around the world are tinkering with energy supplies under pressure from greens convinced oil, coal and gas should be left in the ground.

At her blog Our Finite World, Tverberg describes the implications and dangers in a recent post  Electricity won’t save us from our oil problems The title is a link to her presentation, and I encourage you to go and read the whole thing. Here are some excerpts in italics with my bolds, selected and somewhat reordered according to my sense of her findings, along with some added images.

Electrical Supply Threatened by Prices Too Low for Producers

Almost everyone seems to believe that our energy problems are primarily oil-related. Electricity will save us.

It wasn’t until I sat down and looked at the electricity situation that I realized how worrying it really is. Intermittent wind and solar cannot stand on their own. They also cannot scale up to the necessary level in the required time period. Instead, the way they are added to the grid artificially depresses wholesale electricity prices, driving other forms of generation out of business. While intermittent wind and solar may sound sustainable, the way that they are added to the electric grid tends to push the overall electrical system toward collapse. They act like parasites on the system.

We end up with an electricity situation parallel to the chronic low-price problem we have for oil. Prices for producers, all along the electricity supply chain, fall too low. Of course, consumers don’t complain about this problem. The electricity system also becomes more fragile, as we depend to an ever greater extent on electricity supplies that may or may not be available at a reasonable price at a given point in time. The full extent of the problem doesn’t become apparent immediately, either. We end up with both the electrical and oil systems speeding in the direction of collapse, while most observers are saying, “But prices aren’t high. How can there possibly be a problem?”

Perverse Direct and Indirect Subsidies

Simply removing the subsidies that come from Production Tax Credits doesn’t fix the situation either. In one sense, the problem reflects a combination of many types of direct and indirect subsidies, including state mandates and the requirement that intermittent renewables be allowed to go first. In another sense, the problem is that, in a self-organizing economy, energy prices (including electricity prices) can only rise temporarily. The increase in energy prices is made possible by a growing debt bubble. At some point, this debt bubble collapses. Raising interest rates, as the US is doing now, is a good way of collapsing the debt bubble.

Slide 18 shows that in the US, the only types of renewable generation growing to any significant extent are intermittent wind and solar. Very high subsidies have helped push these types of generation along.

Parts of these subsidies are being phased out, but other, less visible subsidies remain. The fact that intermittent wind and solar are given priority on the grid, when they happen to be available, is a huge subsidy. Also, renewable mandates mean that generation is being added that is not really needed, lowering prices that that the self-organizing competitive pricing system creates for backup electricity providers. This is part of the reason for the unprofitability of many natural gas, coal, and nuclear companies.

There is also a problem with wholesale rates being too low for nuclear, when electricity rates are competitively set. To work around this problem, some areas use capacity auctions, which are intended to offset the inadequate funding for electricity providers providing backup electricity capacity. One catch is that a capacity auction is, in some sense, needed for every member of the supply chain. Just asking electricity generating companies to bid on providing capacity doesn’t guarantee that the full supply chain will be available.

Furthermore, the subsidies for intermittent wind and solar discourage other innovation because they lead to terribly low wholesale prices for innovators to compete against, particularly in areas where hour by hour competitive rating is done. The ultimate problem is that if one type of electricity production is subsidized (even if in subtle ways), all electricity producers must be subsidized. Governments cannot possibly afford such widespread subsidies.

Falsely Hoping Future Prices Will Save the Industry

By way of background, the US Energy Information Administration publishes “levelized cost of electricity” estimates that companies producing electricity are expected to use for planning purposes. When new generating capacity is added, planning needs to be started several years in advance. This is why what is being published now is the EIA’s calculation of expected wholesale costs (at a 2017 price level) for 2022.

Current wholesale prices for “dispatchable” electricity (the opposite of intermittent electricity) seem to be in the 3 to 4 cents per kWh range in the continental US, so all of the amounts shown assume that electricity prices will be much higher in the future. This thinking is in parallel with the “high oil prices will save the oil industry in the future” view that is prevalent in the oil industry. This thinking has helped keep the prices of shares of energy stocks up: “Even if there are problems now,” the thinking goes, “certainly higher prices in the future will fix the situation.”

With respect to wind, there are two reasons why variable wind can be sold in Power Purchasing Agreements (PPAs) for 2 to 3 cents per kWh. The first is the substantial subsidies that have been available, making this pricing arrangement profitable to wind producers. The second is the low value that intermittent electricity provides to the grid. In fact, prices locked into these PPAs are slightly below the bottom of the range of expected future natural gas prices (Figure 1, below). This suggests that the primary value of wind generation is to replace natural gas as a future fuel.

There is one reason why it might make sense to somewhat believe the first item, “Rising cost of electricity production will be no problem.” This has to do with the cost-plus type of electricity pricing (“regulated pricing”) that is used in some states of the United States. When cost-plus pricing is used, higher costs can, in theory, be passed on to consumers. The catch is that higher electricity prices tend to raise the price of finished goods and services. If wages are not rising rapidly enough, this can lead to an affordability problem. Industrial users of electricity are especially likely to cut back their electricity demand because higher prices make their products less competitive in the world economy.

After the talk, I decided to look at this situation a bit more closely. This analysis strongly suggests that since 2000, increased globalization has been playing a major role in holding down US demand for electricity. If there is an opportunity, industrial production will move to jurisdictions where the total cost of production (including wages, benefits, electricity costs, and other costs) is lower, even if there has not been a big increase in industrial electricity prices.

Industries get very unhappy when their electricity rates rise, making them uncompetitive with producers in other countries. The rates we are discussing are UK industrial electricity rates, so are a little higher (perhaps 1.5 times higher) than the wholesale prices discussed on Slides 5 and 6. If the price of 8.3 cents per kWh for industrial electricity is a big problem today, how can countries possibly withstand much higher rates, based on higher carbon prices or based on required technology that is much more expensive?

Suppose a worker gathers reeds and uses them to make baskets. If his production per hour falls, he will have fewer baskets to sell in the marketplace. He cannot expect the price of each basket to rise to make up for his lower production.

For some reason, economists seem to have overlooked this obvious problem. There is no reason to expect that the buyer will be penalized for the higher costs of the energy industry. These higher costs look much like growing inefficiency. In the real world, the seller is generally penalized for falling efficiency. Why do we have so much confidence that the price per barrel of oil can rise, or the price per kWh of electricity can rise, if the price of baskets that a less-efficient worker makes doesn’t rise?

Coal (and nuclear) are the products that have historically kept US electricity prices low. Replacing coal with fuels that are much higher in cost and more variable in availability seems likely to be problematic. Industrial users are likely to be especially distressed.

The United States has been fortunate enough to have very low natural gas prices recently. A major problem is that these prices are not really high enough for companies extracting natural gas as their primary business. If we really need to depend on natural gas, we will likely need much higher prices. In particular, natural gas prices will need to be high enough for natural gas companies to have bond ratings that are above junk ratings.

Low Prices Also Threaten Oil Production

I have been following oil since 2005, so I have had a chance to hear the discussion evolve. Oil prices were clearly too high for some consumers back in July 2008, when the sub-prime housing debt bubble popped in the United States. By early 2014, I started hearing that oil companies were very unhappy about the low price level available in 2013. In fact, some companies were sufficiently unhappy that they began cutting back on investment in new fields. It was not much later that oil prices dropped further, making the low-price problem even worse for producers.

It is difficult for any new technology to get a foothold in a situation where energy prices of all kinds tend to be low. In addition, the pressure seems to be in the direction of reducing energy prices further, even if this means less energy production of all kinds.

One common inaccurate assumption is that oil prices rise primarily in response to the rising cost of oil production. If a person looks at the data, it becomes clear that interest rates have a huge impact on prices. This seems to happen because the purchase of high-value goods with debt (such as factories, homes, cars, and buildings of all kinds) seems to have a very significant impact on total Demand. Lower interest rates make these high-value goods more affordable. (Quantitative Easing (QE) is a way of reducing long-term interest rates; it also seems to affect oil prices.)

Economies Collapse When Goods are Unaffordable

One way of understanding the situation is by understanding that energy consumption is required for jobs that pay well. If insufficient energy supplies are available at a low price, the vast majority of jobs available will be low-paid service jobs. There will, of course, be a few managers and business owners. But these few managers and owners cannot, by themselves, generate enough Demand for goods and services made with energy products to keep commodity prices up. This is why the system tends to fail.

This is probably the most important reason that economies tend to collapse. Most people miss the affordability connection because they interpret “Demand” to be something that anyone can do, without thinking about the affordability aspect. Without sufficient income, a person cannot demand a new home or new car, or gasoline from a fuel station.

See also:  Killing the Energy Goose

Climateers Tilting at Windmills

US CBO Skeptical of Carbon Tax

Introduction:  HuffPost Gets Huffy over CBO Analysis

In a baffling repudiation of the federal government’s own scientists, the Congressional Budget Office (CBO) last week said that climate change poses little economic risk to the United States in the next decade.

The statement, which went so far as to highlight dubiously positive effects of rising global temperatures, poses a potential hurdle for future legislation to curb surging greenhouse gas emissions, experts said, and amounts to textbook climate change denial.

What CBO Actually Said

The US Congressional Budget Office released the document Options for Reducing the Deficit: 2019 to 2028 (Title is link to pdf)  It consists of 35 policy options of which #35 is Impose a Tax on Emissions of Greenhouse Gases. The discussion is as follows (text in italics with my bolds).

Background

The accumulation of greenhouse gases in the atmosphere— particularly carbon dioxide (CO2), which is released when fossil fuels (such as coal, oil, and natural gas) are burned and as a result of deforestation—contributes to climate change, which imposes costs on countries around the globe, including the United States.

Many estimates suggest that the effect of climate change on the nation’s economic output, and hence on federal tax revenues, will probably be small over the next 30 years and larger, but still modest, in the following few decades. Among the more certain effects of climate change on humans over the next several decades, some would be positive, such as reductions in deaths from cold weather and improvements in agricultural productivity in certain areas. However, others would be negative, such as declines in the availability of fresh water in areas dependent on snowmelt and the loss of property from high-tide flooding and from storm surges as sea levels rise. Uncertainty about the effects of climate change— and the potential for unlimited emissions to cause significant damage—grow substantially in the more distant future.

Scientists generally agree that reducing global emissions of greenhouse gases would decrease the magnitude of climate change and the expected costs and risks associated with it. The federal government regulates some emissions in an effort to reduce them; however, emissions are not directly taxed. A well-designed tax that covered most energy-related emissions would be expected to reduce emissions.

Greenhouse gas emissions are typically measured in CO2 equivalents (CO2e), which reflect the amount of carbon dioxide estimated to cause an equivalent amount of warming. Under current law, emissions are projected to decline from 5.4 billion metric tons of CO2e in 2019 to 5.2 billion metric tons of CO2e in 2028.

Option

This option would impose a tax of $25 per metric ton on most emissions of greenhouse gases in the United States—specifically, on most energy-related emissions of CO2 (for example, from electricity generation, manufacturing, and transportation) and some other greenhouse gas emissions from large manufacturing facilities. To simplify implementation, as well as to provide incentives to deploy technologies that capture emissions generated in the production of electricity, the tax could be levied on oil producers, natural gas refiners (for sales outside the electricity sector), and electricity generators. The tax would increase at an annual inflation-adjusted rate of 2 percent.

Revenues—Option 35 Impose a Tax on Emissions of Greenhouse Gases (Billions of Dollars)

2019 2020 2021 2022 2023 2024 2025 2026 2027 2028 2019– 2023 2019– 2028
66.0 103.4 105.9 108.2 111.2 115.1 118.9 119.5 123.2 127.1 494.7 1,099.0

Effects on the Budget

According to estimates made by the staff of the Joint Committee on Taxation and the Congressional Budget Office, implementing this option would increase federal revenues by $1,099 billion from 2019 through 2028. On average, about 5 billion metric tons of greenhouse gas emissions would be taxed each year over that period. Taxed emissions would be roughly 4 percent lower than projected under current law in 2019 and 11 percent lower in 2028. Despite the projected decline in emissions over the 10-year period, tax revenues would rise over time because the additional revenues caused by increases in the tax rate would more than offset the decrease in revenues caused by the decline in taxable emissions. A tax that was somewhat higher or somewhat lower than the $25 dollar per ton tax considered in this option would generate a roughly proportionally larger or smaller amount of revenues.

A tax on greenhouse gas emissions would reduce taxable business and individual income. The resulting reduction in income and payroll tax receipts would partially offset the increase in excise taxes. The estimate for the option reflects that income and payroll tax offset.

The estimate for this option is uncertain for two key reasons. First, the projected amount of emissions released in the absence of the tax depends on estimates of future economic activity and future changes in the relative prices of various fuels and energy technologies, both of which are uncertain. Second, even if projections of future emissions under current law are accurate, estimated reductions in emissions stemming from the tax are uncertain, in part because they depend on the development of new technologies and on individuals’ and firms’ reactions to the changes in prices that the tax would induce. CBO’s estimates of reductions in emissions rely on past responses to such changes, as reported in the published literature.

Other Effects

An argument in favor of this option is that it would reduce U.S. emission of greenhouse gases and would do so in a cost-effective way. In particular, the tax would reduce emissions in a more cost-effective manner than regulations because such a tax would create uniform incentives for businesses and households throughout the economy to reduce their emissions. The tax would increase the cost of producing carbon-intensive goods and services in proportion to the amount of greenhouse gases emitted as a result of their production and consumption. Moreover, those cost increases would trigger corresponding increases in the prices of consumer goods. As a result, the tax would provide incentives for businesses to produce goods in ways that yield fewer emissions (for example, by generating electricity from wind rather than from coal) and for individuals to consume goods in ways that yield fewer emissions (for example, by driving less). Specifically, this tax would motivate emission reductions that cost less than $25 per ton to achieve, but not those that would cost more than $25 per ton.

Although the effects of climate change on the U.S. economy and on the federal budget are expected to be small in the next few decades, the effects are much more uncertain—and potentially far larger—in the more distant future. Many scientists think there is at least some risk that large changes in global temperatures will trigger catastrophic damage, causing substantial harm to human health and well-being as well as the economy. Moreover, greenhouse gases are long-lived, affecting the climate for many decades after they are emitted. As a result, delaying actions to limit emissions reduces the possibility of avoiding potentially harmful future effects. Because this option would take effect in January 2019, it would help avoid the compounded problems that might be caused by such delays.

An argument against a tax on greenhouse gas emissions is that curtailing U.S. emissions would burden the economy by raising the cost of producing emission-intensive goods and services while yielding uncertain benefits for U.S. residents. For example, most of the direct benefits of lessened emissions and associated reductions in climate change might occur outside of the United States over the next several decades, particularly in developing countries that are at greater risk from changes in weather patterns and an increase in sea levels.

Another argument against this option is that reductions in domestic emissions could be partially offset by increases in emissions overseas if carbon-intensive industries relocated to countries without restrictions on emissions or if reductions in energy consumption in the United States led to decreases in foreign fuel prices. More generally, averting the risk of future damage caused by emissions would depend on collective global efforts to cut emissions. Most analysts agree that reducing emissions in this country would have small effects on climate change if other countries with high levels of emissions did not also cut them substantially (although such reductions in the United States would still diminish the probability of catastrophic damage and could spur other countries to cut their emissions).

An alternative approach for reducing emissions of greenhouse gases in a cost-effective manner would be to establish a cap-and-trade program that set caps on such emissions in the United States. Under such a program, allowances that conveyed the right to emit one metric ton of CO2e apiece would be sold at open auction. The overall number of allowances in a given year would be capped, and the cap would probably be lowered over time. If the caps were set to achieve the same cut in emissions that is anticipated from the tax, then the program would be expected to raise roughly the same amount of revenues between 2019 and 2028. In contrast with a tax, a cap-and-trade program would provide certainty about the quantity of emissions from sources that are subject to the cap (because it would directly limit those emissions), but it would not provide certainty about the costs that firms and households would face for the greenhouse gases that they continued to emit.

Footnote: Additional CBO Response to HuffPost

In a lengthy statement to HuffPost, the CBO referred to three of its own past reports, including one that said, “Even under scenarios in which significant climate change is assumed, the projected long-term effects on GDP would tend to be modest relative to underlying economic growth.”

“Although CBO has not undertaken a full analysis of the budgetary costs stemming from climate change, it has recently analyzed the potential costs of future hurricane damage caused by climate change and coastal development,” read an excerpt from one report highlighted in the statement. “All told, CBO projects that the increase in the amount of hurricane damage attributable to coastal development and climate change will probably be less than 0.05 percent of GDP in the 2040s.”

The agency’s report attributed differing climate predictions to “the imperfect understanding of physical processes and of many aspects of the interacting components (land, air, water, ice, and all forms of life) that make up the Earth’s climate system.”

My Comment

The US Congressional Budget Office is required to examine any reasonable and feasible policies to reduce the government’s operating deficit. In that context, it looked at pricing carbon emissions and projected revenues and economic effects. Arguments for and against the policy option were summarized accordingly. Alarmists are intolerant of arguments against their preferred objective to keep fossil fuels in the ground. On the other hand, CBO weighs likely negative economic effects against the unlikely prospect of concerted international cooperation to reduce emissions.

Blame Everything on Climate Change

A recent editorial from Investor’s Business Daily Is There Anything Environmentalists Won’t Blame On Climate Change?  As you will see, experience shows the question is rhetorical.  Excerpts below with my bolds.

Climate Change: CNN published a huge story saying the source of the migrant caravan wasn’t so much corrupt Central American governments, violence or lousy economic policies. It was climate change. This is just the latest attempt by environmentalists to blame any and all bad news — even acne and animal bites — on climate change.

The CNN story, complete with pictures, videos and charts, claims that climate change is responsible for the drought in parts of Honduras, Guatemala, El Salvador and Nicaragua that forced thousands to flee for the U.S.

Well, not “responsible,” exactly. The author admits part way through that “Studies have not definitively tied this particular drought to climate change.”

Story Is Bunk
In other words, the entire premise of story is pretty much bunk. The best the CNN reporter could come up with is that “computer models show droughts like the one happening now are becoming more common as the world warms.”

Why would you need computer models to tell you what is supposedly happening right now? Probably because in the U.S., at least, there’s been no increase in droughts since the 1890s.

Unfortunately, playing fast and loose with the facts and jumping to wild conclusions is now the standard operating procedure when it comes to global warming.

This week also saw a bold headline declaring that “climate change was behind 15 weather disasters in 2017.” Again, not exactly. These events were “influenced” by it, the story said.

That’s a bit hard to swallow, too. Every adverse weather event is now somehow attributable to climate change. Whether it’s a big snowstorm, heavy rains, a dry spell, unusually cold weather, unusually hot weather, or anything that can be labeled as “unusual.”

At least those have something to do with the weather. These days, virtually anything bad that happens gets blamed on climate change.

Blaming Climate
Pick a topic and add “climate change” to it in a Google search and you’re likely to find some article or study suggesting a connection between the two.

This week, CNN ran another blame-climate-change-first story. This one claimed that the rate of animal bites “has increased over the past 10 years, according to Dr. Joseph Forrester, one of the authors of the study published Tuesday in the BMJ. He anticipates that it will continue to rise, partially because of climate change.”

Time magazine blamed mental health problems on climate change. “Trauma, post-traumatic stress disorder and depression all rank among the ailments linked to climate change,” the story said

Another story argued that global warming was connected to sexual violence.

EcoWatch warned pet owners that climate change was probably the reason their dogs have fleas because “climate change is creating an ideal habitat for pests.”

The Denver Post claimed that climate change was partly responsible for the decline in fertility rates.

Another article claimed a few years ago that “various skin disorders such as acne scars are the result of global warming and climate change.”

One website had collected examples of just about everything that’s been connected to global warming. There were hundreds of examples.

Why The Avalanche?
A beer shortage, a building collapse in England, the creation of ISIS, rising insurance premiums, kidney stones, prostitution, teenage drinking and homelessness are but a few.

Why the avalanche of such claims? One obvious reason: If you want to get attention to your story or cause, the best way to do so is to claim there’s some climate change connection.

Yet despite these endless tales of woe, the public remains indifferent. France had to back down on a modest increase in fuel taxes it had imposed specifically to fight global warming, after protests consumed the nation. Liberal Washington state overwhelmingly rejected a carbon tax. Countries that made solemn pledges to cut CO2 emissions three years ago as part of the Paris climate change agreement aren’t close to living up to them. Fighting climate change continues to rank at the bottom of the public’s list of priorities.

Common Sense
Most likely that’s because the public has far more common sense than environmentalists or the mainstream media. They know that bad things have always happened. There were devastating hurricanes, floods, droughts, starvation, deprivation, wars and other terrible tragedies — including acne — long before mankind started burning fossil fuel.

They also know that the climate is always changing. (Take a trip to the Grand Canyon if you don’t believe it.)

And the public knows that not everything bad that is happening today can possibly be the result of a less-than-1-degree Celsius increase in average global temperatures over the past 100 years.

Trying to convince people otherwise just exposes what a hoax the whole climate change mania has become.

Obsessing Over Global Temperatures


Reification is the Fallacy of Misplaced Concreteness. It is a mental process by which someone comes to believe that an abstraction (idea or concept) is a material, physical object in the real world. Mike Hulme observes that many people are obsessing over global temperatures, not realizing they are abstractions and not things to be feared. He provides calm and sensible views regarding global temperature reporting. The post at his blog is Climatism and the Reification of Global Temperature. Excerpts in italics with my bolds.

Over the last 40 years global-mean surface air temperature – ‘global temperature’ for short – has gained an extraordinary role in the science, politics and public discourse of climate change. What was once a number crudely calculated through averaging together a few dozen reasonably well-spaced meteorological time series, has become reified as an objective entity that simultaneously measures Earth System behaviour, reveals the future, regulates geopolitical negotiations and disciplines the human imagination. Apart perhaps from GDP rarely can so constructed an abstract entity have gained such power over the human world.

All of this is very nicely illustrated in a new paper published in the journal Geophysical Research Letters, titled ‘Predicted chance that global warming will temporarily exceed 1.5°C’. Doug Smith and 32 colleagues set out to develop a new capability to predict the likelihood that global temperature will exceed 1.5°C above pre-industrial levels, for a variety of durations upwards from a month, in the coming five years. The assumed importance of the study is suggested by the author team mobilising climate modelling and analysis capabilities at 17 institutions in 9 different countries.

But why is such an early warning system deemed necessary or useful? What power is being imputed to small increments of global temperature to alert future danger?

Smith and colleagues argue that forewarning of temporary excursions of global temperature above a certain threshold—1.5°C is the normative threshold aspired to in the Paris Agreement on Climate Change, even though 2°C is the threshold formally agreed—for periods even a little as a month is relevant for policy-makers. To make such a claim requires an extraordinary degree of abstraction.

Global temperature does not cause anything to happen. It has no material agency. It is an abstract proxy for the aggregated accumulation of heat in the surface boundary layer of the planet. It is far removed from revealing the physical realities of meteorological hazards occurring in particular places. And forecasts of global temperature threshold exceedance are even further removed from actionable early warning information upon which disaster risk management systems can work.

Global temperature offers the ultimate view of the planet—and of meteorological hazard—from nowhere.

I have argued elsewhere about the dangers of climate reductionism, a form of reasoning that lends disproportionate power in political and social discourse to climate model-based descriptions of the future. The adoption of forecasts of global temperature exceedance as an early warning index is a clear case of the related phenomenon of climatism. Similar to explanations of scientism—“the phenomenon whereby authority is implicitly granted to scientific and technical experts to define the meaning, scope and, by extension, [the] solution for public policy concerns”—climatism grants authority to an abstracted global climate, in this case to global temperature, to guide, direct and discipline human actions in the world.

The authors of this new study claim to have developed an operational system with annually updated forecasts of the likelihood of near-term global temperature threshold exceedance. The value of such forecasts is claimed to lie in the general media and public interest they would generate. Issuing such forecasts to the world at large may or may not generate public interest. But they would certainly reinforce the growing ideology of climatism. It is another step toward putting abstract and unsituated descriptions of a globalised climate at the heart of world affairs.

Offering forecasts of global temperature threshold exceedance as an operational proxy for risk and disaster management seems bizarre. Such early warnings would seem to assume that small fluctuations in global temperature contain meaningful and actionable information. But why is it significant to know that the chance of global temperature exceeding 1.5C for two months during the period 2019-2023 is, say, 25% rather than 10%?

Such nuanced differences in the likelihood of a threshold exceedance tell us nothing about the likelihood of real meteorological hazards faced by real people and structures in real places. At the very least the proposed forecasts fail to discriminate between the different causes of global temperature fluctuations—e.g. greenhouse gas accumulation, aerosol loading, ENSO events, solar variability. Each of these causes carry very different implications for the geographical distribution of meteorological hazards, even if global temperature is identical.

Humans are now agents of significant influence in the Earth System and human development trajectories carry a range of profound implications. But offering annual forecasts of near-term global temperature fluctuations as early warnings to (re-)direct these trajectories fails to recognise the situated and differentiated polities, values and visions that shape the world.

GDP has acquired the power to account for the economic health of nations and for the implied well-being of individuals. It has become the hegemonic index which national policies seek to maximise and an index which in turn passes judgement on the performance of governments. In a similar way, the ideology of climatism—aided by the reification of global temperature—narrows actions by the world’s governments to minimise this one index of planetary health.

This new paper by Smith et al. reinforces this reductionist move and discloses the powerful performativity of global temperature in the contemporary world.

Mike Hulme, 24 October 2018

Mike Hulme has been studying climate change for over thirty years and is today one of the most distinctive and recognisable voices speaking internationally about climate change in the academy, in public and in the media. He is currently Professor of Human Geography at the University of Cambridge and Fellow of Pembroke College. Previously, Mike Hulme was professor of climate change in the Science, Society and Sustainability (3S) Group in the School of Environmental Sciences at the University of East Anglia. He is author of Why We Disagree About Climate Change (2009) and Exploring Climate Change Through Science and In Society (2013). Website: http://www.mikehulme.org.

See also his common sense review of the science attributing extreme weather events to human agency. X-Weather is Back! Kerala edition

See Also Climate Reductionism

Climate Change Chumps

Definition “chump”: A foolish or easily deceived person.

Why are so many people taken in by climate alarms? The question is often on my mind, especially when tens of thousands attend UN conferences like Katowice, or when hearing the caterwauling in the media over the climate scare of the week. Last night while watching a football game, my escape from the issue was interrupted by a commercial break that included a flaming earth on the screen for a few seconds. It was an ad for Discovery Channel including the image above.

[Old joke:  I don’t know if they are using subliminal advertising, but yesterday I went and bought a tractor.]

And in a flash I realized how several factors are driving warming suckers into a fearful frenzy.

Firstly, The power of images over words and thinking.
A picture is worth a thousand words. (Sometimes attributed to Chinese)
The Asian attribution is doubtful, but Confucius did say something similar:

Second, We are immersed in imaging technology, entrancing the public. I have no interest in post modern philosophers, but in this sense they are onto something perverse: We are mistaking images for realities.

Third, Pied Pipers are using the media to put us under their spell.
A key point in the fable is the piper’s ability to put a spell on the children, and thereby rob the village of their future.  And he did this to get leverage over the council when they refused to pay for exterminating the rats. Our children have been brainwashed with environmental activism since preschool, and educators have taken Confucius to heart:  The process goes beyond preaching, to videos, posters and projects.

Fourth, Our embrace of mass and social media makes us suckers for fake news, including climate claims.

Note that the majority are not confident to discern fake from real news.  Even worse, today’s “fact checkers” operate out of spin rooms.

Fifth, Social proof is now all that matters.

Climate lemmings rushing over the cliff.

Finally, the drumbeat of climate alarms imprints ever more deeply a false assumption.

It doesn’t matter if any particular climate claim is false or exaggerated, the communications continuously reinforce the underlying myth of the Garden of Eden:  Nature is perfect and eternal so long as humans don’t mess it up.

The reality is more subtle and complex.  Humans are also a force of nature, and with our self-awareness we have the ability and responsibility to add order and purpose to the rest of nature.  Go to Kyoto and watch the landscapers labor for hours to fashion an exquisite Japanese garden, the fruition of collaboration between humans, plants, water and rocks.  Humans can and do improve on nature by taming destructive natural forces to preserve and enhance living structures.

The UN IPCC process is a blind alley, a path to nowhere.  It plays upon fears and guilt feelings.  Worse, it distracts from rational programs of actual environmental stewardship.  I fear it will only get worse in the next 12 years:


Arctic Pacific Flash Freezing in December

BO2018338to349Eleven Days in Pacific Arctic are shown in the above animation.  In the upper center, Chukchi finally froze completely, adding 260k km2 of ice to reach 99.8% of maximum.  (Disregard the blue jagged arc as a sensor artifact.)  Meanwhile, serious freezing began in the two Pacific basins.  Bering to the south of Chukchi went from 57k km2 to 195k, now 43% of maximum.  Okhotsk to the left went from 58k km2 to 223k, now 19% of maximum.

The graph below shows December progress in ice extent recovery.

Arctic2018349
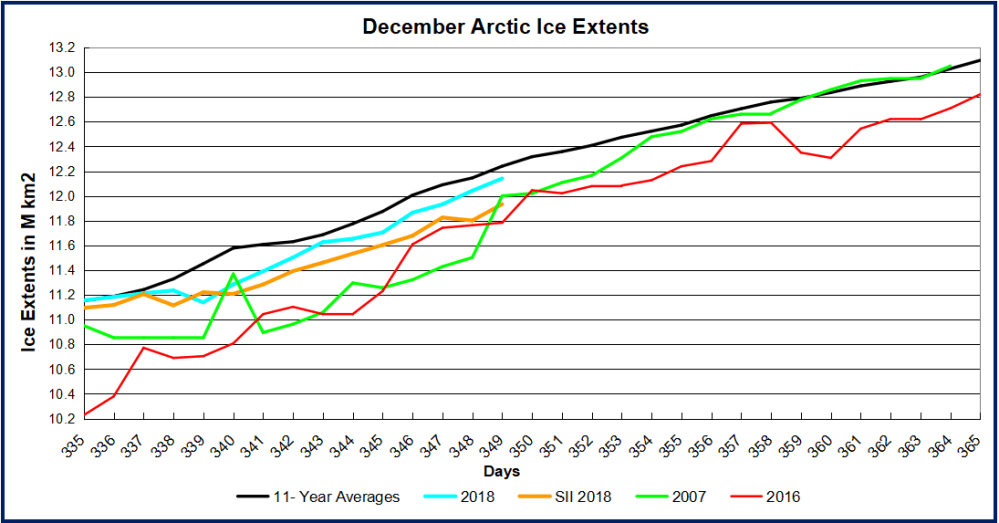
From days 335 to 339, 2018 extents were flat and went below average.  Now freezing has resumed as shown in the animation above and tracking close to average again in the graph.  At day 349 (Dec. 15) MASIE shows 2018 1 day behind average (100k km2),  200k km2 greater than SII 2018,  140k km2 greater than 2007 and 358k km2 more than 2016.


The central Arctic and Eurasian shelf seas are completely frozen, typical for this time of year.  The Pacific was a little slower than usual to start, but is now coming on strong.  The Canadian side froze early and is of course locked in for the winter.  The only remaining deficit of note is Barents Sea which hasn’t added ice in the last two weeks.

cg524a47d218458

Gender Ideology and Science

A fresh report from the front lines comes from (who else) Jordan Peterson: The gender scandal – in Scandinavia and Canada   Excerpts in italics with my bolds.

Men and women are similar. But importantly different. No matter what Sweden’s feminist foreign minister says.

Part One (Scandinavia)

Over the past few weeks, I have been in Oslo, twice; Helsinki, twice; Stockholm, twice; and Copenhagen, once. One of the trips to Stockholm was only for press interviews and television. The other six trips were part of my 12 Rules for Life tour, which has now covered 100 cities. The reason for the dual visits? We arranged relatively smaller venues for the lectures in those Scandinavian towns and they sold out immediately. Scandinavians are interested in what I am saying. They are radically over-represented among those who view my YouTube lectures.

In the last lecture, in Helsinki, it was Finland’s Father’s Day, so I talked about masculine virtue. In Stockholm, I concentrated more on what has come to be known as the “gender paradox.” Here is the paradox in a nutshell: as societies become more gender equal in their social and political policies, men and women become more different in certain aspects, rather than more similar.

Had you asked any group of social scientists — left-wing, centrist, conservative (if you could find them) — 30 years ago “Will egalitarian social policies in wealthy countries produce men and women who are more similar or more different?” the majority would have certainly said, “more similar.” And, to some degree, that has happened. Women have entered the workforce en masse, and are participating at levels approaching or exceeding equality in many of the domains that were male majority prior to the 1960s. But …

And this is a major but. We seem to have reached the point of diminishing, or even reversing returns. Over the last five decades or so, psychologists have aggregated great numbers of descriptions of personality traits, using adjectives, phrases and sentences, throwing virtually every descriptor contained in human language into the mix, in a remarkably atheoretical manner. The method? Describe people every which way imaginable, and then use large samples and powerful statistics to sort out the resulting mess. The results? Something approaching a consensus among psychologists expert in measurement, known as psychometricians (or, less technically, personality psychologists). The latter happens to be my field, in addition to clinical psychology. When you ask thousands of people hundreds of questions (or ask them to rate themselves using descriptive adjectives such as “kind,” “competitive,” “happy,” “anxious,” “creative,” “diligent,” etc.) powerful statistics can identify patterns. People who describe themselves as “kind” tend not to consider themselves “competitive,” for example, but are likely to accept “cooperative” and “caring.” Likewise, creative types might regard themselves as “curious” and “inventive,” while the diligent types are also “dutiful” and “orderly.”

Once a relatively standard model had been agreed upon, and been deemed reliable and valid, then differences, such as those between the sexes, could be investigated. What emerged? First, men and women are more similar than they are different. Even when men and women are most different — in those cultures where they differ most, and along those trait dimensions where they differ most — they are more similar than different. However, the differences that do exist are large enough so that they play an important role in determining or at least affecting important life outcomes, such as occupational choice.

Where are the largest differences? Men are less agreeable (more competitive, harsher, tough-minded, skeptical, unsympathetic, critically-minded, independent, stubborn). This is in keeping with their proclivity, also documented cross-culturally, to manifest higher rates of violence and antisocial or criminal behavior, such that incarceration rates for men vs women approximate 10:1. Women are higher in negative emotion, or neuroticism. They experience more anxiety, emotional pain, frustration, grief, self-conscious doubt and disappointment. This seems to emerge at puberty.

There are other sex differences as well, but they aren’t as large, excepting that of interest: men are comparatively more interested in things and women in people. This is the largest psychological difference between men and women yet identified. And these differences drive occupational choice, particularly at the extremes. Engineers, for example, tend to be those who are not only interested in things, but who are more interested in things than most people, men or women.

It’s very important to remember that many choices are made at the extreme, and not the average. It’s not the average more aggressive/less agreeable male that’s in prison. In fact, if you draw a random man and a random woman from the population, and you bet that the woman is more aggressive/less agreeable, you’d be correct about 40% of the time. But if you walked into a roomful of people everyone of whom had been selected to be the most aggressive person out of a 100, almost every one of them would be male.

So even though men and women are more the same than they are different, the differences can matter.

What happens if you look at sex differences in personality and interest by country? Are the differences bigger in some countries and smaller in others? Would the differences between men and women be larger or smaller in wealthier countries? In more egalitarian countries? The answer: the more egalitarian and wealthier the country, the larger the differences between men and women in temperament and in interest. And the relationship is not small. The most recent study, published in Science (by researchers at Berkeley, hardly a hotbed of conservatism and patriarchy) showed a relationship between a wealth/egalitarian composite measure and sex differences that was larger than that reported in 99% of published social science studies. These are not small-scale studies. Tens of thousands of people have participated in them. And many different groups of scientists have come to the same conclusions, and published those results in very good journals.

Given that differences in temperament and interest help determine occupational choice, and that differences in occupational choice drives variability in such things as income, this indicates that political doctrines that promote equality of opportunity also drive inequality of outcome.

This is a big problem — particularly if the goal of such egalitarian policies was to minimize the differences between men and women. It’s actually a fatal problem for a particular political view. The facts can be denied, but only at the cost of throwing out social science in its entirety and a good bit of biology as well. That is simply not a reasonable solution.

The best explanation, so far, for the fact of the growing differences is that there are two reasons for the differences between men and women: biology and culture. If you minimize the cultural differences (as you do with egalitarian social policies) then you allow the biological differences to manifest themselves fully. I have seen social scientists struggle to offer a cultural explanation, but I haven’t heard any such hypothesis that is the least bit credible, and have been unable to formulate one myself.

There are also those who insist that we just haven’t gone far enough in our egalitarian attempts — that even Scandinavia and The Netherlands, arguably the world’s most egalitarian societies, are still rampantly patriarchal — but that doesn’t explain why the sex differences have grown, rather than shrunk, as those cultures have become demonstrably more equal in social policy.

Those who adopt this viewpoint, despite its apparent logical impossibility, maintain that we must redouble our efforts to socialize little boys and girls in exactly the same manner — rendering all toys gender-neutral, questioning even the idea of gender identity itself — and believe that such maneuvering will finally bring us to the ideal utopia, where every occupation and every strata of authority within every occupation is manned (so to speak) by 50% men and 50% women. Why should we launch large-scale experiments aimed at transforming the socialization of children when we have no idea what the outcome might be? And why should we presume that we know how to eliminate gender identity among young children? Finally, why exactly is it a problem if men and women, freed to make the choices they would make when confronted with egalitarian opportunities, happen to make different choices?

So, this is the Scandinavian conundrum — one that also affects the broader Western world (and the rest of the world, soon enough). Policies that maximize equality of opportunity make equality of outcome increasingly impossible. The doctrine, ever more radically and loudly insisted upon by the politically correct, that sex differences are only socially constructed is wrong. Get it? Wrong.

It’s no wonder that when I came bearing this news the Swedish Foreign Minister (a proud member of the world’s only self-proclaimed feminist government) suggested publicly that I crawl back under my rock, and that one of Sweden’s leading female politicians objected on prime time TV that her daughter could be raised to be anything she wants to be. But facts is facts, I’m afraid, and no amount of neo-Marxist leftist postmodern suggestion that social science is a patriarchal construction is going to make the ugly truth disappear: Men and women are similar. But they are importantly different.

The differences matter, particularly at the extremes, particularly with regard to occupational choice and its concomitants. There are going to be more male criminals, and more male engineers, and more females with diagnoses of depression and anxiety, and more female nurses. And there are going to be differences in economic outcome associated with this variance.

Game over, utopians.

And that’s why the information I shared during my visit to Scandinavia caused a scandal that continues to reverberate.

Part Two (Canada)

Justin Trudeau’s new cabinet awaits the new Prime Minister at Rideau Hall on Wednesday, Nov. 4, 2015. Tony Caldwell/ Postmedia Network

We all remember that our current Prime Minister, the Right Honorable Justin Trudeau, decided early on when he formed his government to make his cabinet 50% women, because “it was 2015.” He got a hall pass for this, no doubt because of his boyish charm and modern mien. But it was a mistake of unforgivable magnitude and here are some of the reasons why:

The job of the federal government is important, necessary and difficult.

• To make important, difficult decisions properly, competence is necessary.

• There is no relationship between sex and competence. Men and women are essentially equal in their intelligence, and they differ very little in conscientiousness (which is the second-best predictor of success, after intelligence). Thus, selection for competence should optimally be sex-blind, if competence is the most important factor.

• The possibility of identifying a competent person increases as the pool of available candidates increases.

• Only 26% of the elected MPs in Trudeau’s government were women.

• By selecting 50% of his cabinet from 26% of the pool of available candidates, Prime Minister Trudeau abdicated his responsibility to rank-order all of his elected officials by competence (which could have been done by blind, multi-person rating of their resumes, including education and accomplishments) and staffing his cabinet from the most qualified person downward.

Given that only 26% of the elected MPs were women, the selection of half the cabinet from this pool means that it is a statistical certainty that the cabinet members chosen were not the most competent available.

It might also be pointed out that such a move is particularly appalling given its source. Let’s assume (which I don’t) that there is patriarchy, and with it, generally undeserved privilege. Let’s even assume (which I don’t) that much of this is accrued unfairly by straight white men, as the identity politics players, such as our Prime Minister, self-righteously and vociferously insist.

Is it truly unreasonable to point out that the absolute poster boy for such privilege is none other than our Prime Minister, Justin Trudeau — a man who dared run for the highest office in the land despite his utter lack of credentials (other than good looks, charm and a certain ability to behave properly in public) merely because his father, Pierre, turned the Trudeau name into the very epitome of status unearned by his sons?

Is it also unreasonable to point out that the women who accepted those positions, granted to them unfairly, in a prejudiced and discriminatory manner, took that as their due, despite the unlikelihood, statistically, of their suitability for the positions in question, and thus betrayed themselves, men and women everywhere striving fairly for advancement, and their country? All in the name of redress for some hypothetical prejudice, a consequence of the patriarchal tyranny, experienced in large measure by vaguely apprehended women of the past and definitely other than themselves.

Appalling. All of it. Appalling.

Jordan B. Peterson is a professor of psychology at the University of Toronto, a clinical psychologist and the author of the multi-million copy bestseller 12 Rules for Life: An Antidote to Chaos. His blog and podcasts can be found at jordanbpeterson.com