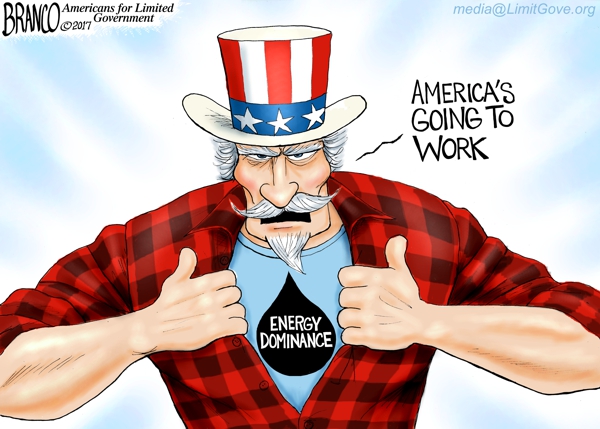
 Last week New York Times published Trump’s ‘Energy Dominance’ Doctrine Is Undermined by Climate Change. (H/T Matthew Kahn) Excerpts below in italics with my bolds
“Climate change disrupts everything, including Trump’s agenda,” said Alice Hill, a research fellow at the conservative Hoover Institution think tank who served as senior director for resilience policy on the National Security Council under President Barack Obama.
When it comes to fossil fuel production, the disruptions are particularly serious. And there’s a fundamental irony at play. Even as emissions from the burning of fossil fuels are warming the planet, the consequences of that warming will make it harder to drill for oil, mine for coal and deliver fuel through pipelines.
Energy systems in the Southeast are particularly vulnerable, the report said, with some 200 power plants and oil refineries exposed to flooding from hurricanes and fiercer storm surges. Scientists estimate, if sea levels rise nationally 3.3 feet (a figure it describes as on the “high end of the very likely range” for what the country could see by 2100), it could expose dozens of power plants currently considered to be in safe zones to risks of 100-year floods. That would jeopardize about 25 gigawatts of operating power capacity, or power for about 18 million homes.
Along the Gulf Coast — home to a significant proportion of the United States oil production and refining industry — energy infrastructure faces a similar and more immediate risk. A sea level rise of less than 1.6 feet could double the number of refineries in Texas and Louisiana vulnerable to flooding by the end of the century.
Yet energy analysts cautioned against expectations that the effects of climate change will cause irreparable harm to the fossil fuel industry or make oil, gas and coal production fundamentally unattractive to investors. Sarah Ladislaw, an energy analyst at the Center for Strategic and International Studies, noted that the oil and gas sector has a long history of managing risks, including figuring out how to operate in politically unstable countries and prodding governments to loosen regulations they find too burdensome.
Climate change will add “headwinds” to fossil fuel companies, make production more costly in some areas and less competitive in others, Ms. Ladislaw said. But, she added, “If you’re waiting for climate impacts to be the end of the oil and gas industry, that’s not going to happen.”
Despite the US now leading the world in fossil fuel production, warmists dream of bringing down the oil majors. The scenario is expressed in all its glory in the legal documents produced in recent years, in support of shareholder proposals meant to financially weaken Exxon, Shell, BP, etc. But Ms. Ladislaw is correct, too many unlikely things have to happen for this dream to come true.
Now let’s unbundle the chain of suppositions that comprise this scenario.
- Supposition 1: A 2C global warming target is internationally agreed.
- Supposition 2: Carbon Restrictions are enacted by governments to comply with the target.
- Supposition 3: Demand for oil and gas products is reduced due to restrictions
- Supposition 4: Oil and gas assets become uneconomic for lack of demand.
- Supposition 5: Company net worth declines by depressed assets and investors lose value.
1.Suppose an International Agreement to limit global warming to 2C.
From the supporting statement to the Exxon shareholder proposal, attorney Sanford Lewis provides these assertions:
Recognizing the severe and pervasive economic and societal risks associated with a warming climate, global governments have agreed that increases in global temperature should be held below 2 degrees Celsius from pre-industrial levels (Cancun Agreement).
Failing to meet the 2 degree goal means, according to scientists, that the world will face massive coastal flooding, increasingly severe weather events, and deepening climate disruption. It will impose billions of dollars in damage on the global economy, and generate an increasing number of climate refugees worldwide.
Climate change and the risks it is generating for companies have become major concerns for investors. These concerns have been magnified by the 21st Session of the Conference of the Parties (COP 21) in Paris, where 195 global governments agreed to restrict greenhouse gas (GHG) emissions to no more than 2 degrees Celsius from pre-industrial levels and submitted plans to begin achieving the necessary GHG emission reductions. In the agreement, signatories also acknowledged the need to strive to keep global warming to 1.5 degrees, recognizing current and projected harms to low lying islands.
Yet a careful reading of UN agreements shows commitment is exaggerated:
David Campbell (here):
Neither 2°C nor any other specific target has ever been agreed at the UN climate change negotiations.
Article 2 of the Paris Agreement in fact provides only that it ‘aims to strengthen the global response to the threat of climate change … including by the holding the increase to well below 2°C’. This is an expression, not of setting a concrete limit, but merely of an aspiration to set such a limit. It is true that Article 2 is expressed in a deplorably equivocatory and convoluted language which fails to convey this vital point, indeed it obscures it. But nevertheless that is what Article 2 means.
Dieter Helm (here):
Nothing of substance has been achieved in the last quarter of a century despite all the efforts and political capital that has been applied. The Paris Agreement follows on from Kyoto. The pledges – in the unlikely event they are met – will not meet the 2C target, shipping and aviation are excluded, and the key developing countries (China and India) are not committed to capping their emission for at least another decade and a half (or longer in India’s case)
None of the pledges is, in any event, legally binding. For this reason, the Paris Agreement can be regarded as the point at which the UN negotiating approach turned effectively away from a top down approach, and instead started to rely on a more country driven and hence bottom up one.
Paul Spedding:
The international community is unlikely to agree any time soon on a global mechanism for putting a price on carbon emissions.

2: Suppose Governments enact restrictions that limit use of fossil fuels.
Despite the wishful thinking in the first supposition, the activists proceed on the basis of aspirations and reporting accountability. Sanford Lewis:
Although the reduction goals are not set forth in an enforceable agreement, the parties put mechanisms in place for transparent reporting by countries and a ratcheting mechanism every five years to create accountability for achieving these goals. U.N. Secretary General Ban Ki-moon summarized the Paris Agreement as follows: “The once Unthinkable [global action on climate change] has become the Unstoppable.”
Now we come to an interesting bait and switch. Since Cancun, IPCC is asserting that global warming is capped at 2C by keeping CO2 concentration below 450 ppm. From Summary for Policymakers (SPM) AR5
Emissions scenarios leading to CO2-equivalent concentrations in 2100 of about 450 ppm or lower are likely to maintain warming below 2°C over the 21st century relative to pre-industrial levels. These scenarios are characterized by 40 to 70% global anthropogenic GHG emissions reductions by 2050 compared to 2010, and emissions levels near zero or below in 2100.
Thus is born the “450 Scenario” by which governments can be focused upon reducing emissions without any reference to temperature measurements, which are troublesome and inconvenient.
Sanford Lewis:
Within the international expert community, “2 degree” is generally used as shorthand for a low carbon scenario under which CO2 concentrations in the earth’s atmosphere are stabilized at a level of 450 parts per million (ppm) or lower, representing approximately an 80% reduction in greenhouse gas emissions from current levels, which according to certain computer simulations would be likely to limit warming to 2 degrees Celsius above pre-industrial levels and is considered by some to reduce the likelihood of significant adverse impacts based on analyses of historical climate variability. Company Letter, page 4.
Clever as it is to substitute a 450 ppm target for 2C, the mathematics are daunting. Joe Romm:
We’re at 30 billion tons of carbon dioxide emissions a year — rising 3.3% per year — and we have to average below 18 billion tons a year for the entire century if we’re going to stabilize at 450 ppm. We need to peak around 2015 to 2020 at the latest, then drop at least 60% by 2050 to 15 billion tons (4 billion tons of carbon), and then go to near zero net carbon emissions by 2100.
Note: In the run up to COP24 in Katowice, IPCC stalwarts increased the ambition to 1.5C of additional warming, which translates to 430 ppm. Presently Mauna Loa reports 407 and rising.
And the presumed climate sensitivity to CO2 is hypothetical and unsupported by observations:

3.Suppose that demand for oil and gas products is reduced by the high costs imposed on such fuels.
Sanford Lewis:
ExxonMobil recognized in its 2014 10-K that “a number of countries have adopted, or are considering adoption of, regulatory frameworks to reduce greenhouse gas emissions,” and that such policies, regulations, and actions could make its “products more expensive, lengthen project implementation timelines and reduce demand for hydrocarbons,” but ExxonMobil has not presented any analysis of how its portfolio performs under a 2 degree scenario.
Moreover, the Company’s current use of a carbon proxy price, which it asserts as its means of calculating climate policy impacts, merely amplifies and reflects its optimistic assessments of national and global climate policies. The Company Letter notes that ExxonMobil is setting an internal price as high as $80 per ton; in contrast, the 2014 Report notes a carbon price of $1000 per ton to achieve the 450 ppm (2 degree scenario) and the Company reportedly stated during the recent Paris climate talks that a 1.5 degree scenario would require a carbon price as high as $2000 per ton within the next hundred years.
Peter Trelenberg, manager of environmental policy and planning at Exxon Mobil reportedly told the Houston Chronicle editorial board: Trimming carbon emissions to the point that average temperatures would rise roughly 1.6 degrees Celsius – enabling the planet to avoid dangerous symptoms of carbon pollution – would bring costs up to $2,000 a ton of CO2. That translates to a $20 a gallon boost to pump prices by the end of this century… .
Even those who think emissions should be capped somehow see through the wishful thinking in these numbers. Dieter Helm:
The combination of the shale revolution and the ending of the commodity super cycle probably point to a period of low prices for sometime to come. This is unfortunate timing for current decarbonisation policies, many of which are predicated on precisely the opposite happening – high and rising prices, rendering current renewables economic. Low oil prices, cheap coal, and falling gas prices, and their impacts on driving down wholesale electricity prices, are the new baseline against which to consider policy interventions.
With existing technologies, it is a matter of political will, and the ability to bring the main polluters on board, as to whether the envelope will be breached. There are good reasons to doubt that any top down agreement will work sufficiently well to achieve it.
The end of fossil fuels is not about to happen anytime soon, and will not be caused by running out of any of them. There is more than enough to fry the planet several times over, and technological progress in the extraction of fossil fuels has recently been at least as fast as for renewables. We live in an age of fossil fuel abundance.
We also live in a world where fossil fuel prices have fallen, and where the common assumption that prices will bounce back, and that the cycle of fossil fuel prices will not only reassert itself but also continue on a rising trend, may be seriously misguided. It is plausible to at least argue that the oil price may never regain its peaks in 1979 and 2008 again.
A world with stable or falling fossil fuel prices turns the policy assumptions of the last decade or so on their heads. Instead of assuming that rising prices would ease the transition to low carbon alternatives, many of the existing technologies will probably need permanent subsidies. Once the full system costs are incorporated, current generation wind (especially offshore) and current generation solar may be out of the market except in special locations for the foreseeable future. In any event, neither can do much to address the sheer scale of global emissions.

Primary Energy Demand Projection
4.Suppose oil and gas reserves are stranded for lack of demand.
Sanford Lewis:
Achievement of even a 2 degree goal requires net zero global emissions to be attained by 2100. Achieving net zero emissions this century means that the vast majority of fossil fuel reserves cannot be burned. As noted by Mark Carney, the President of the Bank of England, the carbon budget associated with meeting the 2 degree goal will “render the vast majority of reserves ‘stranded’ – oil, gas, and coal that will be literally unburnable without expensive carbon capture technology, which itself alters fossil fuel economics.”
A concern expressed by some of our stakeholders is whether such a “low carbon scenario” could impact ExxonMobil’s reserves and operations – i.e., whether this would result in unburnable proved reserves of oil and natural gas.
Decisions to abandon reserves are not as simple or have the effects as desired by activists.
Financial Post (here):
The 450 Scenario is not the IEA’s central scenario. At this point, government policies to limit GHG emissions are not stringent enough to stimulate this level of change. However, for discussion purposes let’s use the IEA’s 450 Scenario to examine the question of stranded assets in crude oil investing. Would some oil reserves be “stranded” under the IEA’s scenario of demand reversal?
A considerable amount of new oil projects must be developed to offset the almost 80 per cent loss in legacy production by 2040. This continued need for new oil projects for the next few decades and beyond means that the majority of the value of oil reserves on the books of public companies must be realized, and will not be “stranded”.
While most of these reserves will be developed, could any portion be stranded in this scenario? The answer is surely “yes.” In any industry a subset of the inventory that is comprised of inferior products will be susceptible to being marginalized when there is declining demand for goods. In a 450 ppm world, inferior products in the oil business will be defined by higher cost and higher carbon intensity.

5.Suppose shareholders fear declining company net worth.
Now we come to the underlying rationale for this initiative.
Paul Spedding:
Commodity markets have repeatedly proved vulnerable to expectations that prices will fall. Given the political pressure to mitigate the impact of climate change, smart investors will be watching closely for indications of policies that will lead to a drop in demand and the possibility that their assets will become financially stranded.
Equity markets are famously irrational, and if energy company shareholders can be spooked into selling off, a death spiral can be instigated. So far though, investors are smarter than they are given credit.
Bloomberg:
Fossil-fuel divestment has been a popular issue in recent years among college students, who have protested at campuses around the country. Yet even with the movement spreading to more than 1,000 campuses, only a few dozen schools have placed some restrictions on their commitments to the energy sector. Cornell University, Massachusetts Institute of Technology and Harvard University are among the largest endowments to reject demands to divest.
Stanford Board of Trustees even said:
As trustees, we are convinced that the global community must develop effective alternatives to fossil fuels at sufficient scale, so that fossil fuels will not continue to be extracted and used at the present rate. Stanford is deeply engaged in finding alternatives through its research. However, despite the progress being made, at the present moment oil and gas remain integral components of the global economy, essential to the daily lives of billions of people in both developed and emerging economies. Moreover, some oil and gas companies are themselves working to advance alternative energy sources and develop other solutions to climate change. The complexity of this picture does not allow us to conclude that the conditions for divestment outlined in the Statement on Investment Responsibility have been met.
Update: Universities are not the exception in finding the alarmist case unconvincing, according to a survey:
Almost half of the world’s top 500 investors are failing to act on climate change — an increase of 6 percent from 236 in 2014, according to a report Monday by the Asset Owners Disclosure Project, which surveys global companies on their climate change risk and management.
The Abu Dhabi Investment Authority, Japan Post Insurance Co Ltd., Kuwait Investment Authority and China’s SAFE Investment Company, are the four biggest funds that scored zero in the survey. The 246 “laggards” identified as not acting hold $14 trillion in assets, the report said.
Summary
Alarmists have failed to achieve their goals through political persuasion and elections. So they are turning to legal and financial tactics. Their wishful thinking appears as an improbable chain of events built upon a Paris agreement without substance.
Last word to David Campbell:
International policy has so far been based on the premise that mitigation is the wisest course, but it is time for those committed to environmental intervention to abandon the idea of mitigation in favour of adaptation to climate change’s effects.
For more on adapting vs. mitigating, see Adapting Works, Mitigating Fails

Balancing on a set of suppositions.

_a06c9___Gallery.jpg)

 Then we have the “doubled CO2” (t1) scenario, where the ERL has been pushed higher up into cooler air layers closer to the tropopause:
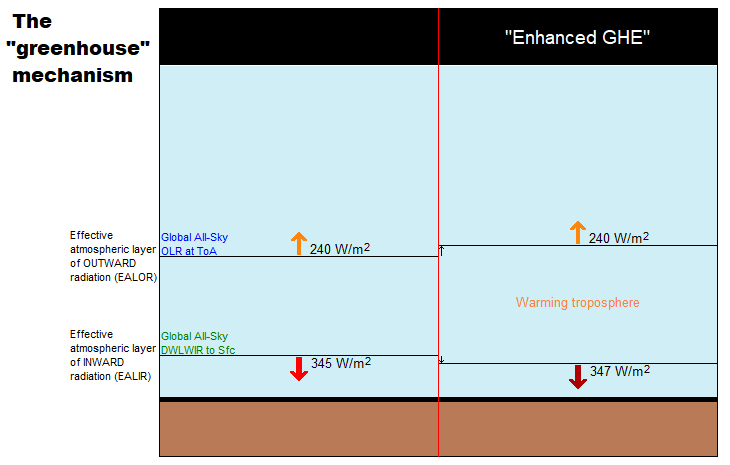

 Figure 5.
 Figure 10.


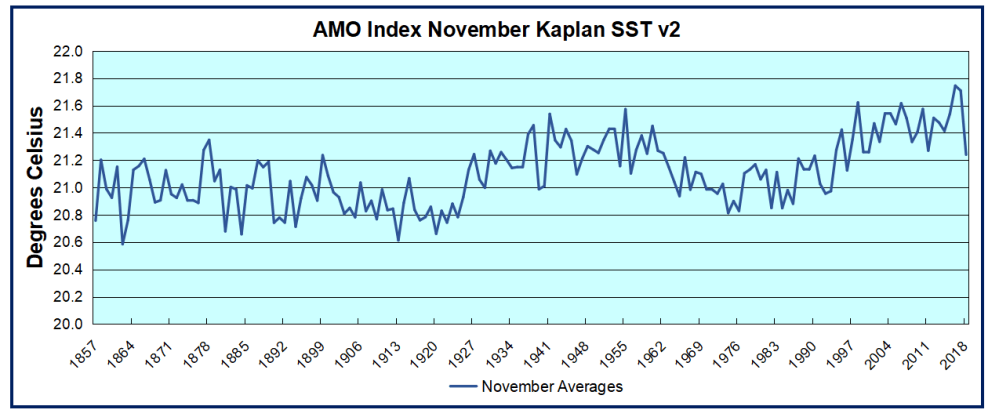 The AMO Index is from from Kaplan SST v2, the unaltered and not detrended dataset. By definition, the data are monthly average SSTs interpolated to a 5×5 grid over the North Atlantic basically 0 to 70N. The graph shows warming began after 1993 up to 1998, with a series of matching years since. November 2016 set a record at 21.75C, but note the plunge down to 21.24C for November 2018, the coldest since 1996. Because McCarthy refers to hints of cooling to come in the N. Atlantic, let’s take a closer look at some AMO years in the last 2 decades.
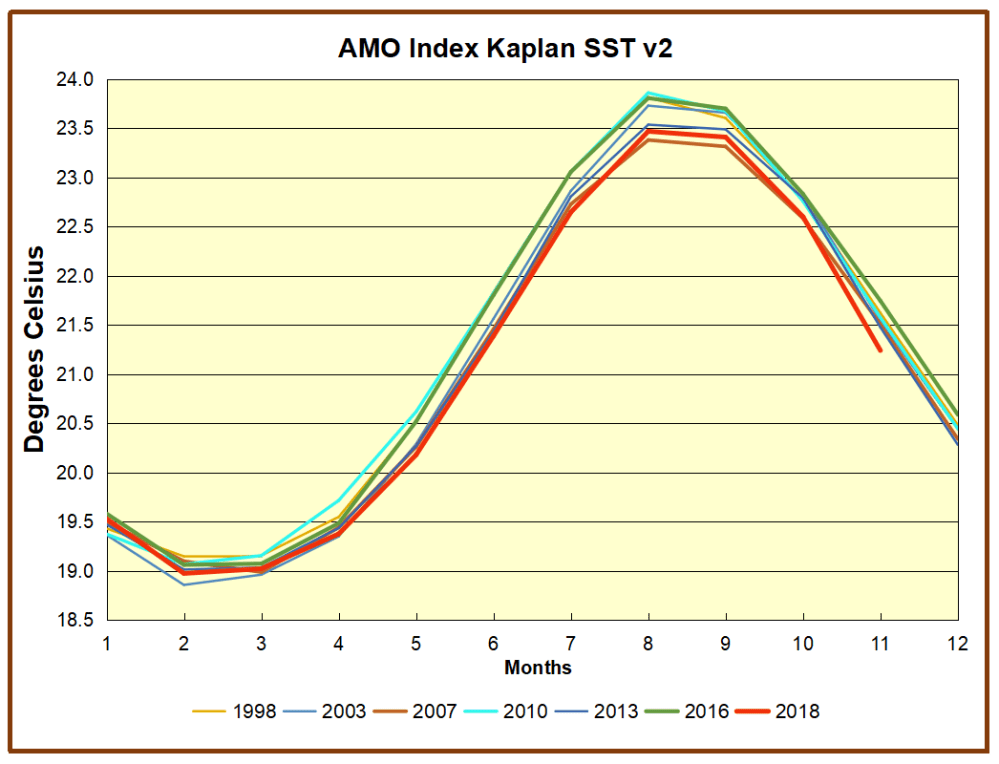


 Seventeen Days in Hudson Bay are shown in the above animation. In the lower center, Hudson Bay pushed its ice extent up to 1.24M km2, 98% of maximum. Just to the northeast, Hudson Strait and Ungava Bay are completely frozen over, with Baffin Bay reaching down. At the top left you can see Chukchi Sea growing ice toward Bering Strait.
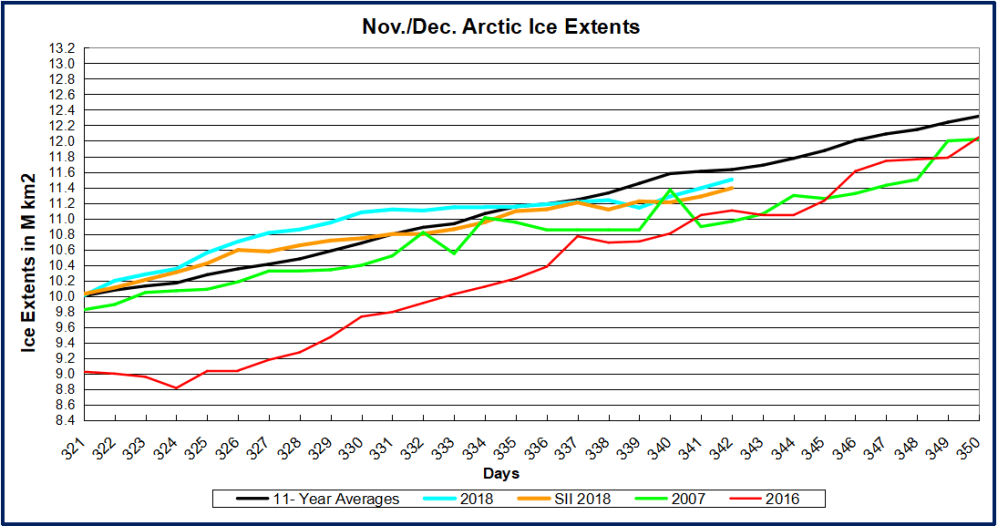 From days 330 to 339, 2018 extents were flat and went below average. Now freezing has resumed as shown in the animation above and nearing average again in the graph. At day 342 (Dec. 8) 2018 is 540k km2 greater than 2007 and 400k km2 more than 2016.


 The Greek word for “one tone” is monotonia, which is the root for both monotone and the closely-related word monotonous, which means “dull and tedious.” Monotone is a droning, unchanging tone. A continuous sound, especially someone’s voice, that doesn’t rise and fall in pitch, is a monotone. Nothing can put you to sleep quite as effectively as a teacher talking in a monotone.