Chicxulub asteroid Apocalypse? Not so fast. August update
The Daily Mail would have you believe Apocalyptic asteroid that wiped out the dinosaurs 66 million years ago triggered 100,000 years of global warming
Chicxulub asteroid triggered a global temperature rise of 5°C (9°F).
This notion has been around for years, but dredged up now to promote fears of CO2 and global warming. And maybe it’s because of a new Jurassic Park movie coming this summer. But it doesn’t take much looking around to discover experts who have a sober, reasonable view of the situation.
Princeton expert Gerta Keller, Professor of Geosciences at Princeton, has studied this issue since the 1990s and tells all at her website CHICXULUB: THE IMPACT CONTROVERSY Excerpts below with my bolds.
Update August 17, 2018
This is a repost as background for a fresh article in the Atlantic The Nastiest Feud in Science H/T Warren Meyer. As noted, the parallels with global warming/climate change are notable.

Introduction to The Impact Controversy
In the 1980s as the impact-kill hypothesis of Alvarez and others gained popular and scientific acclaim and the mass extinction controversy took an increasingly rancorous turn in scientific and personal attacks fewer and fewer dared to voice critique. Two scientists stand out: Dewey McLean (VPI) and Chuck Officer (Dartmouth University). Dewey proposed as early as 1978 that Deccan volcanism was the likely cause for the KTB mass extinction, Officer also proposed a likely volcanic cause. Both were vilified and ostracized by the increasingly vocal group of impact hypothesis supporters. By the middle of the 1980s Vincent Courtillot (Physique de Globe du Paris) also advocated Deccan volcanism, though not as primary cause but rather as supplementary to the meteorite impact. Since 2008 Courtillot has strongly advocated Deccan volcanism as the primary cause for the KTB mass extinction.

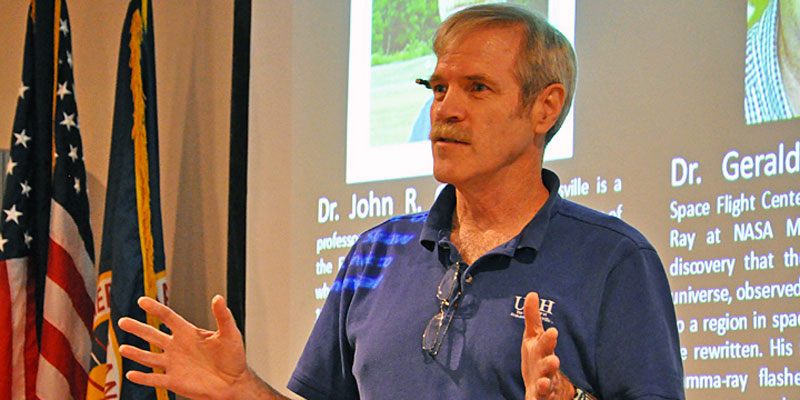
(Overview from Tim Clarely, Ph.D. questioning the asteroid) In secular literature and movies, the most popular explanation for the dinosaurs’ extinction is an asteroid impact. The Chicxulub crater in Mexico is often referred to as the “smoking gun” for this idea. But do the data support an asteroid impact at Chicxulub?
The Chicxulub crater isn’t visible on the surface because it is covered by younger, relatively undeformed sediments. It was identified from a nearly circular gravity anomaly along the northwestern edge of the Yucatán Peninsula (Figure 1). There’s disagreement on the crater’s exact size, but its diameter is approximately 110 miles—large enough for a six-mile-wide asteroid or meteorite to have caused it.
Although some of the expected criteria for identifying a meteorite impact are present at the Chicxulub site—such as high-pressure and deformed minerals—not enough of these materials have been found to justify a large impact. And even these minerals can be caused by other circumstances, including rapid crystallization4 and volcanic activity.
The biggest problem is what is missing. Iridium, a chemical element more abundant in meteorites than on Earth, is a primary marker of an impact event. A few traces were identified in the cores of two drilled wells, but no significant amounts have been found in any of the ejecta material across the Chicxulub site. The presence of an iridium-rich layer is often used to identify the K-Pg (Cretaceous-Paleogene) boundary, yet ironically there is virtually no iridium in the ejecta material at the very site claimed to be the “smoking gun”!
In addition, secular models suggest melt-rich layers resulting from the impact should have exceeded a mile or two in thickness beneath the central portion of the Chicxulub crater. However, the oil wells and cores drilled at the site don’t support this. The thickest melt-rich layers encountered in the wells were between 330 and 990 feet—nowhere near the expected thicknesses of 5,000 to 10,000 feet—and several of the melt-rich layers were much thinner than 300 feet or were nonexistent.
Finally, the latest research even indicates that the tsunami waves claimed to have been generated by the impact across the Gulf of Mexico seem unlikely.
Summary from Geller
The Cretaceous-Tertiary boundary (KTB) mass extinction is primarily known for the demise of the dinosaurs, the Chicxulub impact, and the frequently rancorous thirty years-old controversy over the cause of this mass extinction. Since 1980 the impact hypothesis has steadily gained support, which culminated in 1990 with the discovery of the Chicxulub crater on Yucatan as the KTB impact site and “smoking gun” that proved this hypothesis. In a perverse twist of fate, this discovery also began the decline of this hypothesis, because for the first time it could be tested directly based on the impact crater and impact ejecta in sediments throughout the Caribbean, Central America and North America.
Two decades of multidisciplinary studies amassed a database with a sum total that overwhelmingly reveals the Chicxulub impact predates the KTB mass extinction. It’s been a wild and frequently acrimonious ride through the landscape of science and personalities. The highlights of this controversy, the discovery of facts inconsistent with the impact hypothesis, the denial of evidence, misconceptions, and misinterpretations are recounted here. (Full paper in Keller, 2011, SEPM 100, 2011).
Chicxulub Likely Happened ~100,000 years Before the KTB Extinction
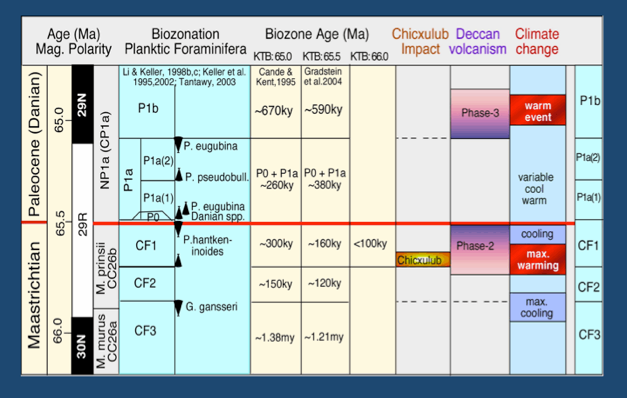
Figure 42. Planktic foraminiferal biostratigraphy, biozone ages calculated based on time scales where the KTB is placed at 65Ma, 65.5Ma and 66Ma, and the relative age positions of the Chicxulub impact, Deccan volcanism phases 2 and 3 and climate change, including the maximum cooling and maximum warming (greenhouse warming) and the Dan-2 warm event relative to Deccan volcanism.
Most studies surrounding the Chicxulub impact crater have concentrated on the narrow interval of the sandstone complex or so-called impact-tsunami. Keller et al. (2002, 2003) placed that interval in zone CF1 based on planktic foraminiferal biostratigraphy and specifically the range of the index species Plummerita hantkeninoides that spans the topmost Maastrichtian. Zone CF1. The age of CF1 was estimated to span the last 300ky of the Maastrichtian based on the old time scale of Cande and Kent (1995) that places the KTB at 65Ma. The newer time scale (Gradstein et al., 2004) places the KTB at 65.5Ma, which reduces zone CF1 to 160ky.
By early 2000 our team embarked on an intensive search for impact spherules below the sandstone complex throughout NE Mexico. Numerous outcrops were discovered with impact spherule layers in planktic foraminiferal zone CF1 below the sandstone complex and we suggested that the Chicxulub impact predates the KTB by about 300ky (Fig. 42; Keller et al., 2002, 2003, 2004, 2005, 2007, 2009; Schulte et al., 2003, 2006).
Time scales change with improved dating techniques. Gradstein et al (2004) proposed to place the KTB at 65.5 Ma, (Abramovich et al., 2010). This time scale is now undergoing further revision (Renne et al., 2013) placing the KTB at 66 Ma, which reduces zone CF to less than 100ky. By this time scale, the age of the Chicxulub impact predates the KTB by less than 100ky based on impact spherule layers in the lower part zone CF1. See Fig. 42 for illustration.
Unfortunately, this wide interest rarely resulted in integrated interdisciplinary studies or joint discussions to search for common solutions to conflicting results. Increasingly, in a perverse twist of science new results became to be judged by how well they supported the impact hypothesis, rather than how well they tested it. An unhealthy US versus THEM culture developed where those who dared to question the impact hypothesis, regardless of the solidity of the empirical data, were derided, dismissed as poor scientists, blocked from publication and getting grant funding, or simply ignored. Under this assault, more and more scientists dropped out leaving a nearly unopposed ruling majority claiming victory for the impact hypothesis. In this adverse high-stress environment just a small group of scientists doggedly pursued evidence to test the impact hypothesis.
No debate has been more contentious during the past thirty years, or has more captured the imagination of scientists and public alike, than the hypothesis that an extraterrestrial bolide impact was the sole cause for the KTB mass extinction (Alvarez et al., l980). How did this hypothesis evolve so quickly into a virtually unassailable “truth” where questioning could be dismissed by phrases such as “everybody knows that an impact caused the mass extinction”, “only old fashioned Darwinian paleontologists can’t accept that the mass extinction was instantaneous”, “paleontologists are just bad scientists, more like stamp collectors”, and “it must be true because how could so many scientists be so wrong for so long.” Such phrases are reminiscent of the beliefs that the Earth is flat, that the world was created 6000 years ago, that Noah’s flood explains all geological features, and the vilification of Alfred Wegner for proposing that continents moved over time.

Update Published at National Geographic February 2018 By Shannon Hall Volcanoes, Then an Asteroid, Wiped Out the Dinosaur
What killed the dinosaurs? Few questions in science have been more mysterious—and more contentious. Today, most textbooks and teachers tell us that nonavian dinosaurs, along with three-fourths of all species on Earth, disappeared when a massive asteroid hit the planet near the Yucatán Peninsula some 66 million years ago.
But a new study published in the journal Geology shows that an episode of intense volcanism in present-day India wiped out several species before that impact occurred.
The result adds to arguments that eruptions plus the asteroid caused a one-two punch. The volcanism provided the first strike, weakening the climate so much that a meteor—the more deafening blow—was able to spell disaster for Tyrannosaurs rex and its late Cretaceous kin.
A hotter climate certainly helped send the nonavian dinosaurs to their early grave, says Paul Renne, a geochronologist at the University of California, Berkeley, who was not involved in the study. That’s because the uptick in temperature was immediately followed by a cold snap—a drastic change that likely set the stage for planet-wide disaster.
Imagine that some life managed to adapt to those warmer conditions by moving closer toward the poles, Renne says. “If you follow that with a major cooling event, it’s more difficult to adapt, especially if it’s really rapid,” he says.
In this scenario, volcanism likely sent the world into chaos, driving many extinctions alone and increasing temperatures so drastically that most of Earth’s remaining species couldn’t protect themselves from that second punch when the asteroid hit.
“The dinosaurs were extremely unlucky,” Wignall says.
But it will be hard to convince Sean Gulick, a geophysicist at the University of Texas at Austin, who co-led recent efforts to drill into the heart of the impact crater in Mexico. He points toward several studies that have suggested that ecosystems remained largely intact until the time of the impact.
Additionally, a forthcoming paper might make an even stronger case that the impact drove the extinction alone, notes Jay Melosh, a geophysicist at Purdue University who has worked on early results from the drilling project. It looks as though the divisive debate will continue with nearly as much ferocity as the events that rocked our world 66 million years ago.
Summary:
So if the Chicxulub asteroid didn’t kill the dinosaurs, what did? Paleontologists have advanced all manner of other theories over the years, including the appearance of land bridges that allowed different species to migrate to different continents, bringing with them diseases to which native species hadn’t developed immunity. Keller and Addate do not see any reason to stray so far from the prevailing model. Some kind of atmospheric haze might indeed have blocked the sun, making the planet too cold for the dinosaurs — it just didn’t have to have come from an asteroid. Rather, they say, the source might have been massive volcanoes, like the ones that blew in the Deccan Traps in what is now India at just the right point in history.
For the dinosaurs that perished 65 million years ago, extinction was extinction and the precise cause was immaterial. But for the bipedal mammals who were allowed to rise once the big lizards were finally gone, it is a matter of enduring fascination.
This science seems as settled as climate change/global warming, and with many of the same shenanigans.
Footnote:


 Now this is interesting. This week another children’s climate lawsuit has been dismissed, this time in Seattle Washington, hotbed of climatists as rabid as California. According to AP, Judge Michael Scott gave away his personal bias by telling the plaintiffs not to be discouraged by his ruling granting the motion to dismiss from defendant Governor Inslee. Methinks that leftward justices in the lower courts are realizing they can no longer make policy from the bench and expect higher courts to let it pass. With Gorsuch sitting on the highest court, and Kavanaugh soon to be added, liberal grandstanding opinions may become much rarer.
 The best context for understanding decadal temperature changes comes from the world’s sea surface temperatures (SST), for several reasons:


 A divergence of 2018 surplus ice kept the July extents above average most of the month, resulting in an higher month overall. Now in August extents have slipped below average. That was to be expected since much of the surplus ice was in Hudson and Baffin bays, places that go to open water by September. The animation above shows in the last two weeks, Hudson and Baffin opened up, having lost 90% of their ice, though still above average. Note that the Canadian Archipelago in the center is still plugged with ice in several places.


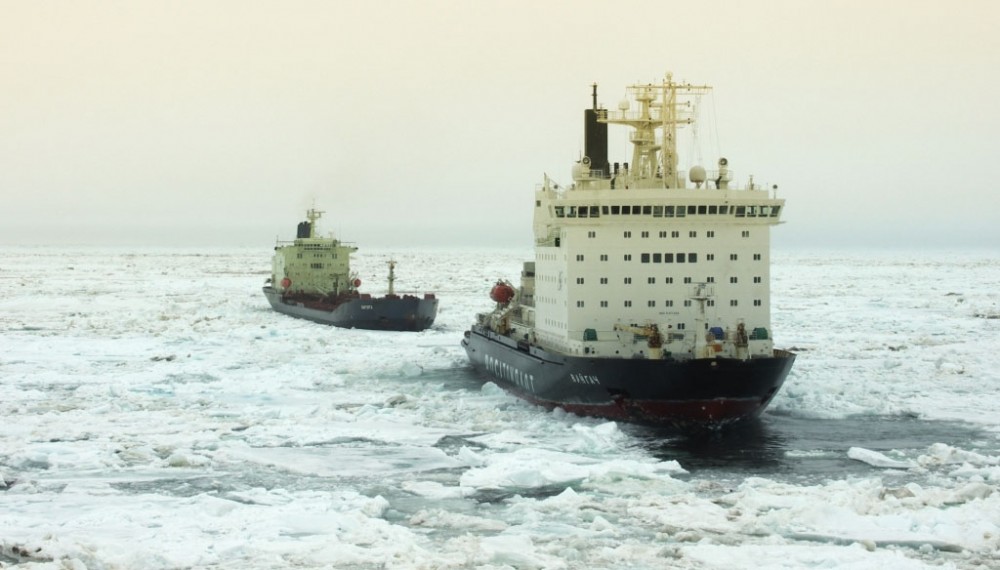


 The AMO Index is from from Kaplan SST v2, the unaltered and untrended dataset. By definition, the data are monthly average SSTs interpolated to a 5×5 grid over the North Atlantic basically 0 to 70N. The graph shows warming began after 1992 up to 1998, with a series of matching years since. Because McCarthy refers to hints of cooling to come in the N. Atlantic, let’s take a closer look at some AMO years in the last 2 decades.


