Greenland Viking Science in Depth


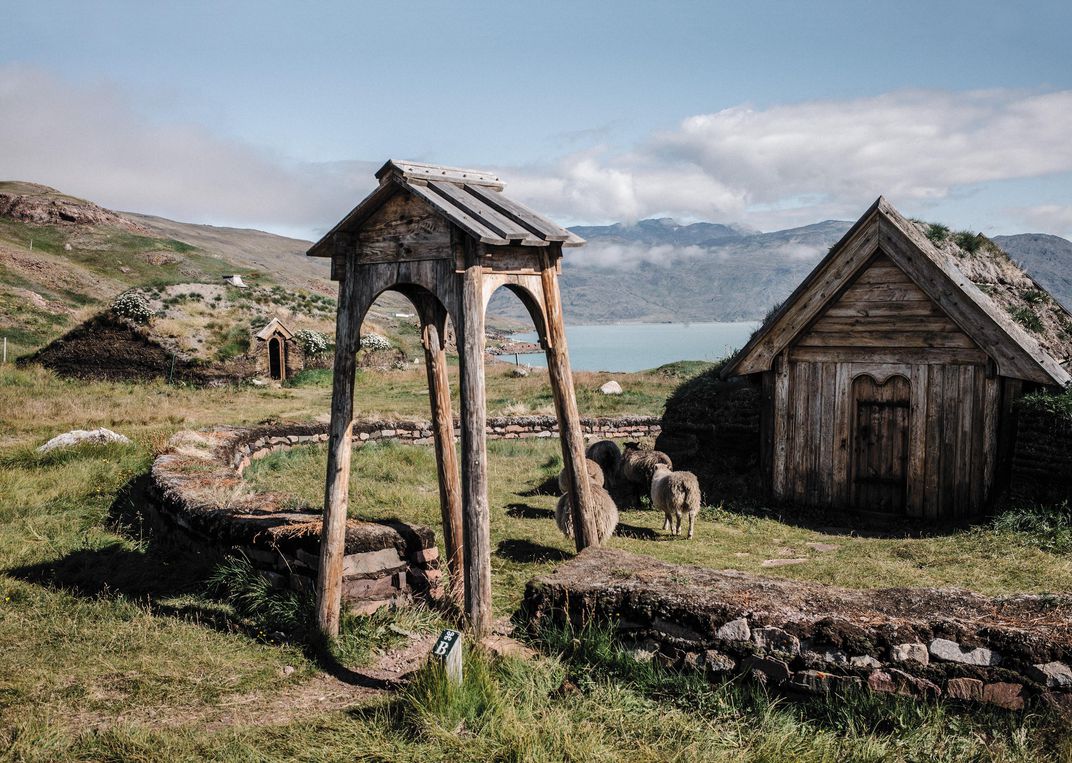
Eric the Red slept here: Qassiarsuk features replicas of a Viking church and longhouse. (Ciril Jazbec)

Update August 9 2018

With an article just published in South China Morning Post and reblogged in GWPF,  I am reposting this more in depth discussion of the Greenland Vikings.  It was originally published in 2017 with information and graphics drawn from a fine essay in the Smithsonian Magazine.

It is refreshing to come across scientists researching a question without the corrupting need to scare the public or to confirm some personal, professional or moral fear of the future. In this case I refer to a wonderful Smithsonian article on the question: Why Did Greenland’s Vikings Vanish? Newly discovered evidence is upending our understanding of how early settlers made a life on the island — and why they suddenly disappeared.

Some excerpts below give the flavor of this persistent effort by researchers unrewarded by the availability of huge grants that now flow to the once-lowly climatologists.  The whole article is fascinating to anyone with curiosity.

The Mystery of Greenland Vikings

But the documents are most remarkable—and baffling—for what they don’t contain: any hint of hardship or imminent catastrophe for the Viking settlers in Greenland, who’d been living at the very edge of the known world ever since a renegade Icelander named Erik the Red arrived in a fleet of 14 longships in 985. For those letters were the last anyone ever heard from the Norse Greenlanders.

They vanished from history.

Europeans didn’t return to Greenland until the early 18th century. When they did, they found the ruins of the Viking settlements but no trace of the inhabitants. The fate of Greenland’s Vikings—who never numbered more than 2,500—has intrigued and confounded generations of archaeologists.

Those tough seafaring warriors came to one of the world’s most formidable environments and made it their home. And they didn’t just get by: They built manor houses and hundreds of farms; they imported stained glass; they raised sheep, goats and cattle; they traded furs, walrus-tusk ivory, live polar bears and other exotic arctic goods with Europe. “These guys were really out on the frontier,” says Andrew Dugmore, a geographer at the University of Edinburgh. “They’re not just there for a few years. They’re there for generations—for centuries.”

So what happened to them?

The Conventional Wisdom

Thomas McGovern used to think he knew. An archaeologist at Hunter College of the City University of New York, McGovern has spent more than 40 years piecing together the history of the Norse settlements in Greenland. With his heavy white beard and thick build, he could pass for a Viking chieftain, albeit a bespectacled one. Over Skype, here’s how he summarized what had until recently been the consensus view, which he helped establish: “Dumb Norsemen go into the north outside the range of their economy, mess up the environment and then they all die when it gets cold.”

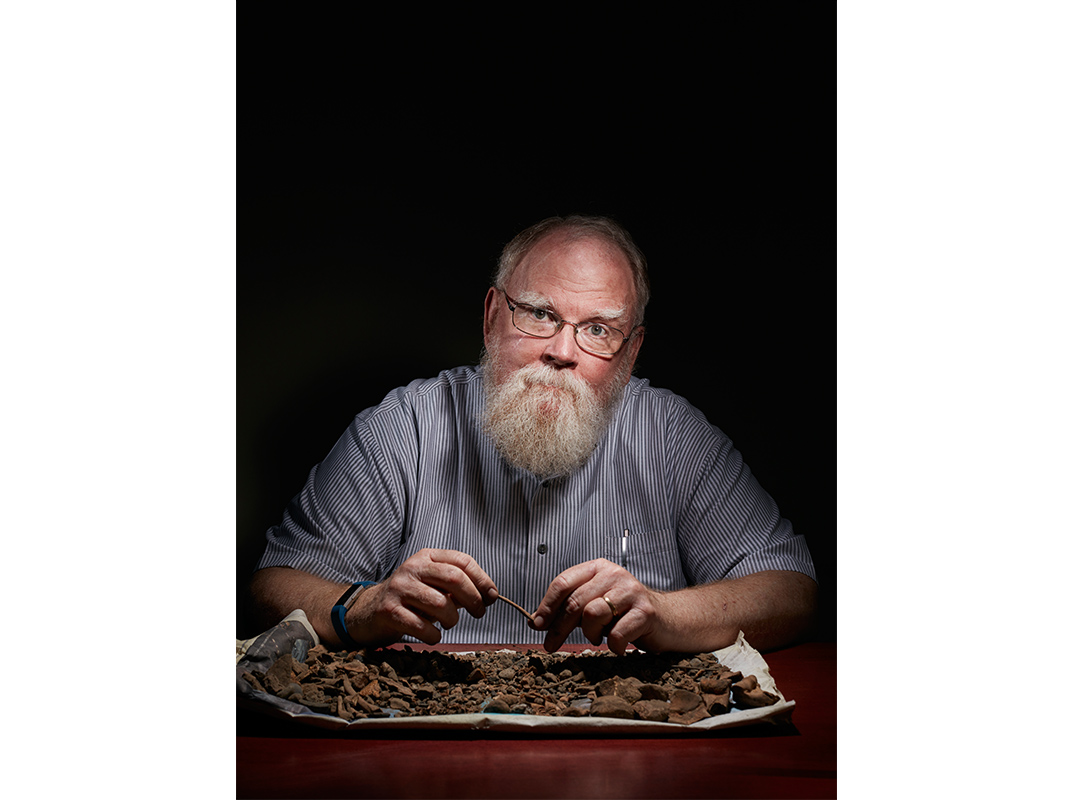
Thomas McGovern (with Viking-era animal bones); The Greenlanders’ end was “grim.” (Reed Young)

Accordingly, the Vikings were not just dumb, they also had dumb luck: They discovered Greenland during a time known as the Medieval Warm Period, which lasted from about 900 to 1300. Sea ice decreased during those centuries, so sailing from Scandinavia to Greenland became less hazardous. Longer growing seasons made it feasible to graze cattle, sheep and goats in the meadows along sheltered fjords on Greenland’s southwest coast. In short, the Vikings simply transplanted their medieval European lifestyle to an uninhabited new land, theirs for the taking.

But eventually, the conventional narrative continues, they had problems. Overgrazing led to soil erosion. A lack of wood—Greenland has very few trees, mostly scrubby birch and willow in the southernmost fjords—prevented them from building new ships or repairing old ones. But the greatest challenge—and the coup de grâce—came when the climate began to cool, triggered by an event on the far side of the world.

In 1257, a volcano on the Indonesian island of Lombok erupted. Geologists rank it as the most powerful eruption of the last 7,000 years. Climate scientists have found its ashy signature in ice cores drilled in Antarctica and in Greenland’s vast ice sheet, which covers some 80 percent of the country. Sulfur ejected from the volcano into the stratosphere reflected solar energy back into space, cooling Earth’s climate. “It had a global impact,” McGovern says. “Europeans had a long period of famine”—like Scotland’s infamous “seven ill years” in the 1690s, but worse. “The onset was somewhere just after 1300 and continued into the 1320s, 1340s. It was pretty grim. A lot of people starving to death.”

Amid that calamity, so the story goes, Greenland’s Vikings—numbering 5,000 at their peak—never gave up their old ways. They failed to learn from the Inuit, who arrived in northern Greenland a century or two after the Vikings landed in the south. They kept their livestock, and when their animals starved, so did they. The more flexible Inuit, with a culture focused on hunting marine mammals, thrived.

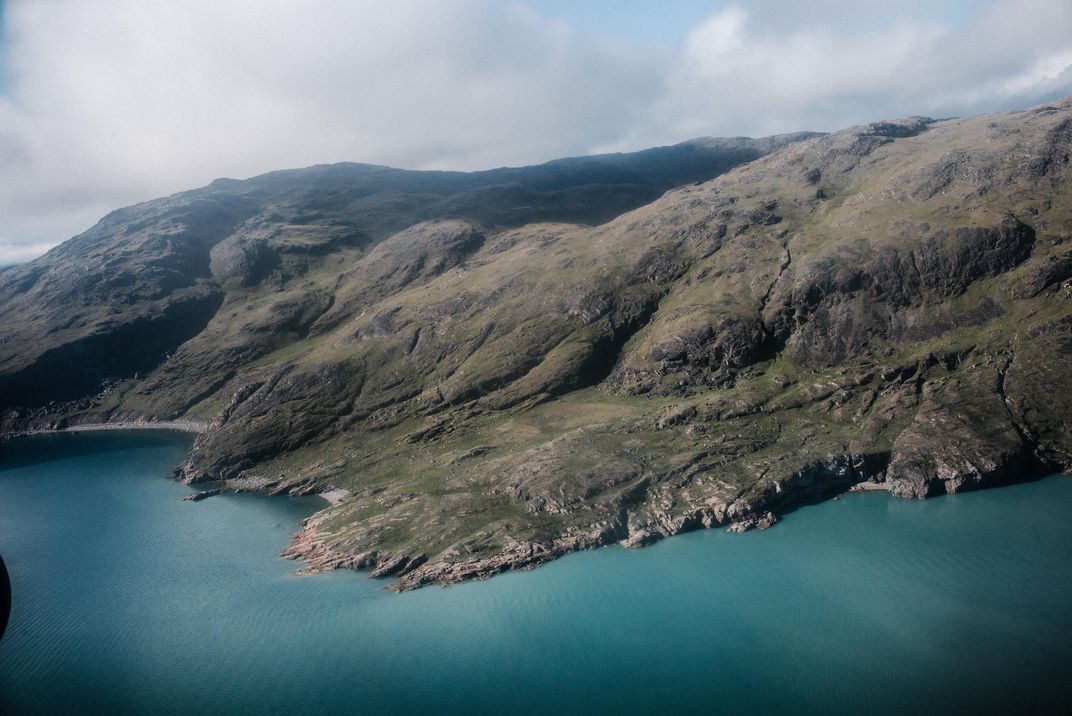
An aerial photograph of southern Greenland. (Ciril Jazbec)

New Evidence Overturns Past Conceptions

But over the last decade a radically different picture of Viking life in Greenland has started to emerge from the remains of the old settlements, and it has received scant coverage outside of academia. “It’s a good thing they can’t make you give your PhD back once you’ve got it,” McGovern jokes. He and the small community of scholars who study the Norse experience in Greenland no longer believe that the Vikings were ever so numerous, or heedlessly despoiled their new home, or failed to adapt when confronted with challenges that threatened them with annihilation.

“It’s a very different story from my dissertation,” says McGovern. “It’s scarier. You can do a lot of things right—you can be highly adaptive; you can be very flexible; you can be resilient—and you go extinct anyway.” And according to other archaeologists, the plot thickens even more: It may be that Greenland’s Vikings didn’t vanish, at least not all of them.

A New Understanding How Vikings Lived on Greenland


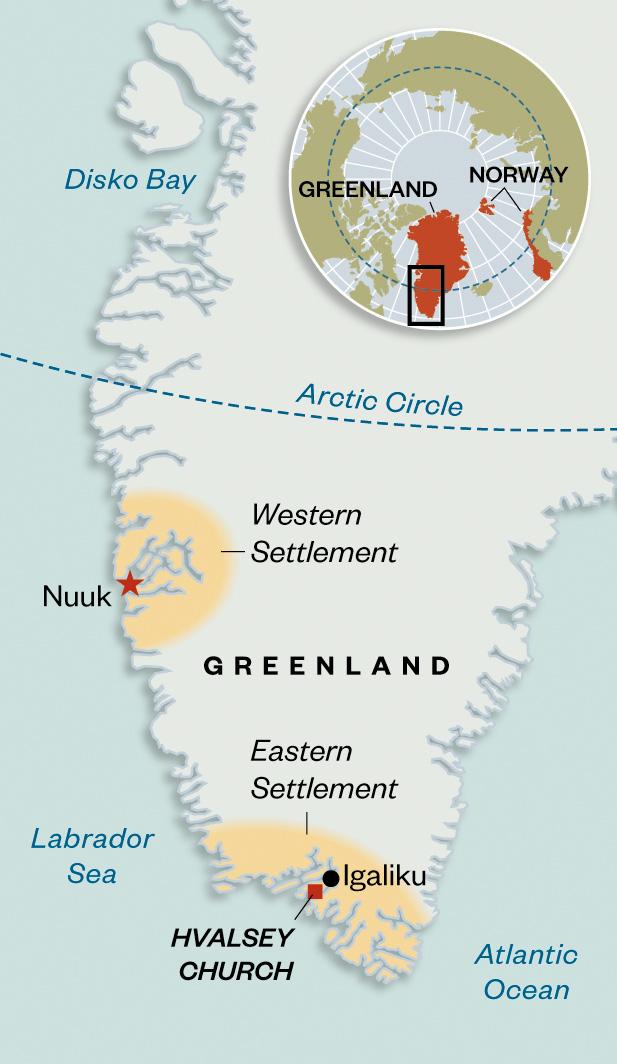
The Vikings established two outposts in Greenland: one along the fjords of the southwest coast, known historically as the Eastern Settlement, where Gardar is located, and a smaller colony about 240 miles north, called the Western Settlement. Nearly every summer for the last several years, Konrad Smiarowski has returned to various sites in the Eastern Settlement to understand how the Vikings managed to live here for so many centuries, and what happened to them in the end.

“Probably about 50 percent of all bones at this site will be seal bones,” Smiarowski says as we stand by the drainage ditch in a light rain. He speaks from experience: Seal bones have been abundant at every site he has studied, and his findings have been pivotal in reassessing how the Norse adapted to life in Greenland. The ubiquity of seal bones is evidence that the Norse began hunting the animals “from the very beginning,” Smiarowski says. “We see harp and hooded seal bones from the earliest layers at all sites.”

A seal-based diet would have been a drastic shift from beef-and-dairy-centric Scandinavian fare. But a study of human skeletal remains from both the Eastern and Western settlements showed that the Vikings quickly adopted a new diet. Over time, the food we eat leaves a chemical stamp on our bones—marine-based diets mark us with different ratios of certain chemical elements than terrestrial foods do. Five years ago, researchers based in Scandinavia and Scotland analyzed the skeletons of 118 individuals from the earliest periods of settlement to the latest. The results perfectly complement Smiarow­ski’s fieldwork: Over time, people ate an increasingly marine diet, he says.

Judging from the bones Smiarowski has uncovered, most of the seafood consisted of seals—few fish bones have been found. Yet it appears the Norse were careful: They limited their hunting of the local harbor seal, Phoca vitulina, a species that raises its young on beaches, making it easy prey. (The harbor seal is critically endangered in Greenland today due to overhunting.) “They could have wiped them out, and they didn’t,” Smiarowski says. Instead, they pursued the more abundant—and more difficult to catch—harp seal, Phoca groenlandica, which migrates up the west coast of Greenland every spring on the way from Canada. Those hunts, he says, must have been well-organized communal affairs, with the meat distributed to the entire settlement—seal bones have been found at homestead sites even far inland. The regular arrival of the seals in the spring, just when the Vikings’ winter stores of cheese and meat were running low, would have been keenly anticipated.

The Vikings Were Players in the Ivory Trade

The Norse harnessed their organizational energy for an even more important task: annual walrus hunts. Smiarowski, McGovern and other archaeologists now suspect that the Vikings first traveled to Greenland not in search of new land to farm—a motive mentioned in some of the old sagas—but to acquire walrus-tusk ivory, one of medieval Europe’s most valuable trade items. Who, they ask, would risk crossing hundreds of miles of arctic seas just to farm in conditions far worse than those at home? As a low-bulk, high-value item, ivory would have been an irresistible lure for seafaring traders.

After hunting walruses to extinction in Iceland, the Norse must have sought them out in Greenland. They found large herds in Disko Bay, about 600 miles north of the Eastern Settlement and 300 miles north of the Western Settlement. “The sagas would have us believe that it was Erik the Red who went out and explored [Greenland],” says Jette Arneborg, a senior researcher at the National Museum of Denmark, who, like McGovern, has studied the Norse settlements for decades. “But the initiative might have been from elite farmers in Iceland who wanted to keep up the ivory trade—it might have been in an attempt to continue this trade that they went farther west.”

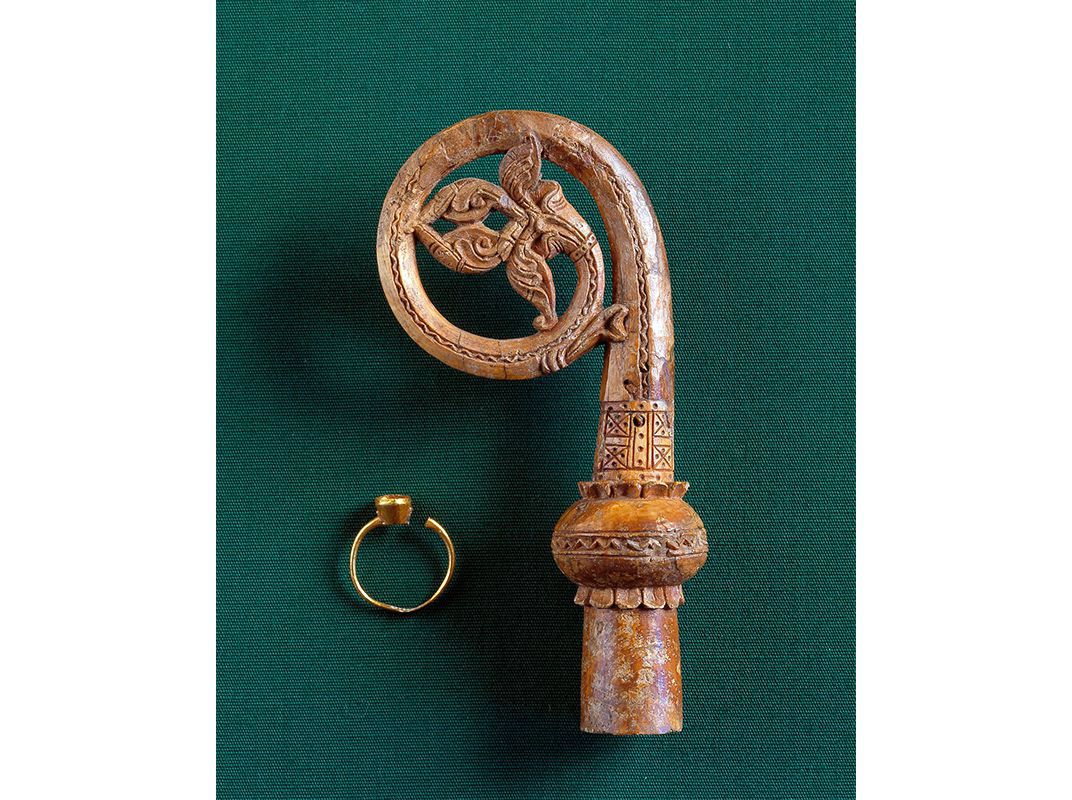
A bishop’s ring and top of his crosier from the Gardar ruins. (Ciril Jazbec)

How profitable was the ivory trade? Every six years, the Norse in Greenland and Iceland paid a tithe to the Norwegian king. A document from 1327, recording the shipment of a single boatload of tusks to Bergen, Norway, shows that that boatload, with tusks from 260 walruses, was worth more than all the woolen cloth sent to the king by nearly 4,000 Icelandic farms for one six-year period.

Archaeologists once assumed that the Norse in Greenland were primarily farmers who did some hunting on the side. Now it seems clear that the reverse was true. They were ivory hunters first and foremost, their farms only a means to an end. Why else would ivory fragments be so prevalent among the excavated sites? And why else would the Vikings send so many able-bodied men on hunting expeditions to the far north at the height of the farming season? “There was a huge potential for ivory export,” says Smiarowski, “and they set up farms to support that.” Ivory drew them to Greenland, ivory kept them there, and their attachment to that toothy trove may be what eventually doomed them.

A New Theory Why Viking Greenland Settlements Failed

For all their intrepidness, though, the Norse were far from self-sufficient, and imported grains, iron, wine and other essentials. Ivory was their currency. “Norse society in Greenland couldn’t survive without trade with Europe,” says Arneborg, “and that’s from day one.”

Then, in the 13th century, after three centuries, their world changed profoundly. First, the climate cooled because of the volcanic eruption in Indonesia. Sea ice increased, and so did ocean storms—ice cores from that period contain more salt from oceanic winds that blew over the ice sheet. Second, the market for walrus ivory collapsed, partly because Portugal and other countries started to open trade routes into sub-Saharan Africa, which brought elephant ivory to the European market. “The fashion for ivory began to wane,” says Dugmore, “and there was also the competition with elephant ivory, which was much better quality.” And finally, the Black Death devastated Europe. There is no evidence that the plague ever reached Greenland, but half the population of Norway—which was Greenland’s lifeline to the civilized world—perished.

The Norse probably could have survived any one of those calamities separately. After all, they remained in Greenland for at least a century after the climate changed, so the onset of colder conditions alone wasn’t enough to undo them. Moreover, they were still building new churches—like the one at Hvalsey—in the 14th century. But all three blows must have left them reeling. With nothing to exchange for European goods—and with fewer Europeans left—their way of life would have been impossible to maintain. The Greenland Vikings were essentially victims of globalization and a pandemic.

Summary

So there is a climate angle to the story of Greenland Vikings. Unlike climate alarmists, these scientists looked deeper and found a more complicated truth. Of course, even this explanation is provisional, because we are talking about science, after all.

OLYMPUS DIGITAL CAMERA

Culture War Frontlines Report


Background Context: The struggle between left and right (Progressive vs. Libertarian) world views has been heating up ever since events like the Brexit vote and elections of non-progressive leaders like Trump. An excerpt below describes how the culture war plays out in the current context. (H/T Ace of Spades)

Short version: The right attempts political persuasion. The left, on the other hand, attempts social persuasion — basically seizing the commanding heights of culture-making institutions and then deciding that espousing some political claims (being pro-gay-marriage) increase social status and that espousing other political claims (being against gay marriage) decrease social status and, indeed, make one a social pariah, fit for ostracism, mass mockery, and internal exile.

The left’s method works much better than the right’s. It always has and it always will. Because most people don’t care about politics all that much — but nearly everyone (except for the crankiest of contrarians, including some of the current assembled company) cares about their social status.

Having higher social status gets you invites to the Cocktail Party Circuit, which is a real thing, defined broadly (and metaphorically) enough. It makes you datable, it makes you “clubbable,” as the old term went.

It can get you promoted at work, particularly if the sort of job you do is a bit vague as far as definite, tangible outputs and thus advancement depends more on how upper management feels about you.

While the left wing continues winning arguments by not even having arguments at all, instead simply demonizing those who espouse any contrary position, the #SmartSet (citation required) of the establishment right continues believing, apparently earnestly and definitely ridiculously, that if they just out argue their political competitors, they’ll change minds.

They won’t. Or not enough to actually matter. Because most people don’t really care enough about these issues to really engage with them on an intellectual level; they just want to know what to claim to believe so that other people won’t think they’re weird, and deem them unfriendable, undatable, and poor candidates for promotion inside The Corporation. More at Feel Good Climatism

Youtube Applies Warning Labels to Selected Videos

This has been building up as the social media companies (progressive and post-modern to the core) became disturbed that through their platforms people were accessing content and opinions objectionable to the media overseers.  A previous post discussed a form of systemic discrimination against “conservative” viewpoints Suppressing Climate

Now Youtube is taking an additional step by putting quotes from Wikipedia (reliably Progressive) on videos that might confuse snowflakes. From Daily Mail YouTube will now place Wikipedia entries about global warming below videos ‘refuting evidence of global warming’  Excerpts below with my bolds.

Youtube is fighting back against climate change deniers by implementing a fact-checking box below user-uploaded videos on the controversial topic.

The system will surface information from Wikipedia or Britannica Encyclopedia to display factual information in bitesize chunks below videos on climate change.

YouTube already implemented the feature for videos on a slew of other contentious topics, including the MMR vaccination, the moon landing and UFOs.

However, this is the first time the platform has targeted climate change deniers.

The feature is the latest step from the Google-owned video platform in its battle to reduce the spread of misinformation and conspiracy theories on the service.

Users who upload their content to YouTube cannot stop the service displaying blurbs of factual information below their content.

So, on matters of opinion one person’s fact is another’s misinformation, but these media overlords are not burdened with uncertainty:  They know the truth because they have “social proof”.  And as the cigarette pack shows, first there are warnings, then the object is banned from public spaces.

Signals of Progressive Desperation?

Another culture war correspondent has a different view, seeing these events as expressions not of strength but of vulnerability. Caitlin Flanagan writes in the Atlantic Why the Left Is So Afraid of Jordan Peterson
The Canadian psychology professor’s stardom is evidence that leftism is on the decline—and deeply vulnerable. Excerpts in italics with my bolds. She speaks below about her sons’ journey.

The boys graduated from high school and went off to colleges where they were exposed to the kind of policed discourse that dominates American campuses. They did not make waves; they did not confront the students who were raging about cultural appropriation and violent speech; in fact, they forged close friendships with many of them. They studied and wrote essays and—in their dorm rooms, on the bus to away games, while they were working out—began listening to more and more podcasts and lectures by this man, Jordan Peterson.

The young men voted for Hillary, they called home in shock when Trump won, they talked about flipping the House, and they followed Peterson to other podcasts—to Sam Harris and Dave Rubin and Joe Rogan. What they were getting from these lectures and discussions, often lengthy and often on arcane subjects, was perhaps the only sustained argument against identity politics they had heard in their lives.

That might seem like a small thing, but it’s not. With identity politics off the table, it was possible to talk about all kinds of things—religion, philosophy, history, myth—in a different way. They could have a direct experience with ideas, not one mediated by ideology. All of these young people, without quite realizing it, were joining a huge group of American college students who were pursuing a parallel curriculum, right under the noses of the people who were delivering their official educations.

Because all of this was happening silently, called down from satellites and poured in through earbuds—and not on campus free-speech zones where it could be monitored, shouted down, and reported to the appropriate authorities—the left was late in realizing what an enormous problem it was becoming for it. It was like the 1960s, when kids were getting radicalized before their parents realized they’d quit glee club. And it was not just college students. Not by a long shot.

The alarms sounded when Peterson published what quickly became a massive bestseller, 12 Rules for Life, because books are something that the left recognizes as drivers of culture. The book became the occasion for vicious profiles and editorials, but it was difficult to attack the work on ideological grounds, because it was an apolitical self-help book that was at once more literary and more helpful than most, and that was moreover a commercial success. All of this frustrated the critics. It’s just common sense! they would say, in one arch way or another, and that in itself was telling: Why were they so angry about common sense?

The critics knew the book was a bestseller, but they couldn’t really grasp its reach because people like them weren’t reading it, and because it did not originally appear on The New York Times’s list, as it was first published in Canada. However, it is often the bestselling nonfiction book on Amazon, and—perhaps more important—its audiobook has been a massive seller. As with Peterson’s podcasts and videos, the audience is made up of people who are busy with their lives—folding laundry, driving commercial trucks on long hauls, sitting in traffic from cubicle to home, exercising. This book was putting words to deeply held feelings that many of them had not been able to express before.

But the producers did their part, and Peterson did not go to their studios to sit among the lifestyle celebrities and talk for a few minutes about the psychological benefits of simple interventions in one’s daily life. This should have stopped progress, except Peterson was by then engaged in something that can only be compared to a conventional book tour if conventional book tours routinely put authors in front of live audiences well in excess of 2,500 people, in addition to the untold millions more listening to podcasts and watching videos. (Videos on Peterson’s YouTube channel have been viewed, overall, tens of millions of times.) It seemed that the book did not need the anointing oils of the Today show.

The left has an obvious and pressing need to unperson him; what he and the other members of the so-called “intellectual dark web” are offering is kryptonite to identity politics. There is an eagerness to attach reputation-destroying ideas to him, such as that he is a supporter of something called “enforced monogamy,” an anthropological concept referring to the social pressures that exist in certain cultures that serve to encourage marriage. He mentioned the term during a wide-ranging interview with a New York Times reporter, which led to the endlessly repeated falsehood that he believes that the government should be in the business of arranging marriages. There is also the inaccurate belief that he refuses to refer to transgender people by the gendered pronoun conforming to their identity. What he refuses to do is to abide by any laws that could require compelled speech.

It is because the left, while it currently seems ascendant in our houses of culture and art, has in fact entered its decadent late phase, and it is deeply vulnerable. The left is afraid not of Peterson, but of the ideas he promotes, which are completely inconsistent with identity politics of any kind. When the poetry editors of The Nation virtuously publish an amateurish but super-woke poem, only to discover that the poem stumbled across several trip wires of political correctness; when these editors (one of them a full professor in the Harvard English department) then jointly write a letter oozing bathos and career anxiety and begging forgiveness from their critics; when the poet himself publishes a statement of his own—a missive falling somewhere between an apology, a Hail Mary pass, and a suicide note; and when all of this is accepted in the houses of the holy as one of the regrettable but minor incidents that take place along the path toward greater justice, something is dying.

In the midst of this death rattle has come a group of thinkers, Peterson foremost among them, offering an alternative means of understanding the world to a very large group of people who have been starved for one. His audience is huge and ever more diverse, but a significant number of his fans are white men. The automatic assumption of the left is that this is therefore a red-pilled army, but the opposite is true. The alt-right venerates identity politics just as fervently as the left, as the title of a recent essay reproduced on the alt-right website Counter-Currents reveals: “Jordan Peterson’s Rejection of Identity Politics Allows White Ethnocide.”

If you think that a backlash to the kind of philosophy that resulted in The Nation’s poetry implosion; the Times’ hire; and Obama’s distress call isn’t at least partly responsible for the election of Donald Trump, you’re dreaming. And if you think the only kind of people who would reject such madness are Republicans, you are similarly deluded. All across the country, there are people as repelled by the current White House as they are by the countless and increasingly baroque expressions of identity politics that dominate so much of the culture. These are people who aren’t looking for an ideology; they are looking for ideas. And many of them are getting much better at discerning the good from the bad. The Democratic Party reviles them at its peril; the Republican Party takes them for granted in folly.

Perhaps, then, the most dangerous piece of “common sense” in Peterson’s new book comes at the very beginning, when he imparts the essential piece of wisdom for anyone interested in fighting a powerful, existing order. “Stand up straight,” begins Rule No. 1, “with your shoulders back.”

Climatist Revolutionaries


Obama and other Western political leaders have been saying that Climate Change is the biggest threat to modern society. I am coming around to agree, but not in the way they are thinking. I mean there is fresh evidence that we can defeat radical Islam, but radical climatism is already eroding the foundations of our modern societies.  I refer to climate alarm and activism, which has come to dominate the environmental movement and impose an agenda for social re-engineering.  At the end of this post is my understanding of their revolutionary game plan, but first a new report on the strategy and current events in the campaign.

A fresh confirmation of my insights from two years ago regarding the motives and tactics of the radical anti-fossil fuel movement is provided in The Conversation article All the battles being waged against fossil fuel infrastructure are following a single strategy Excerpts in italics with my bolds

Keep it in the ground

The overarching aim is to prevent as much new fossil fuel infrastructure as possible from being built and shutting down as many operations as possible. It’s all part of a “keep it in the ground” strategy with “it” referencing fossil fuels.

This wide-ranging attempt to block oil, gas and coal infrastructure emerged after the American political system tried and failed to deal with climate change.

Many of this movement’s rank-and-file members reached two main conclusions regarding this failure. Real climate action, they decided, would require a broad-based, grassroots social movement. And the oil, gas and coal industries’ influence over the nation’s political system, through financial donations to politicians and other activities, was to blame for the lack of climate action in the U.S.

As one movement strategist at a prominent climate advocacy organization told me, a large number of climate activists at that point became determined to bring about what they called the managed decline of the fossil fuel industries.

They are trying to expedite the demise of the oil, gas and coal businesses through a death-by-a-thousand-cuts approach that includes several strategies. One is getting investors, including university endowments and public sector pension funds, to stop investing in fossil fuel stocks and other assets. When I researched this divestment movement with journalism professor Jill Hopke, we found that activists were trying to chip away at the moral legitimacy of the oil, gas and coal industries. Another is fighting new fossil fuel infrastructure through civil disobedience and litigation.

celts-storm-exxon

Climate Activists storm the bastion of Exxon Mobil, here seen without their shareholder disguises.

The Trump effect
The keep it in the ground movement has gained a new sense of urgency during the Trump administration.

Because of this new political climate, activists have concentrated harder than ever on local actions, such as fighting pipelines and other infrastructure projects, wherever they believe they can make a difference during the Trump years. This stands in contrast to their strategy of only a few years ago that focused at least to some degree on influencing national policies.

The Climatist Game Plan

Mission: Deindustrialize Civilization

Goal: Drive industrial corporations into Bankruptcy

Strategy: Cut off the Supply of Cheap, Reliable Energy

Tactics:

  • Raise the price of fossil fuels
  • Force the power grid to use expensive, unreliable renewables
  • Demonize Nuclear energy
  • Spread fear of extraction technologies such as fracking
  • Increase regulatory costs on energy production
  • Scare investors away from carbon energy companies
  • Stop pipelines because they are too safe and efficient
  • Force all companies to account for carbon usage and risk

Progress:

  • UK steel plants closing their doors.
  • UK coal production scheduled to cease this year.
  • US coal giant Peabody close to shutting down.
  • Smaller US oil companies going bankrupt in record numbers.
  • Etc.

Collateral Damage:

  • 27,000 extra deaths in UK from energy poverty.
  • Resource companies in Canada cut 17,000 jobs in a single month.
  • Ontario green energy policy results in highest NA electricity rates and largest debt among the world’s sub-sovereign borrowers.
  • EU farmers now growing more biofuels instead of food crops.
  • Etc.

Summary:

Radical climatism is playing the endgame while others are sleeping, or discussing the holes in the science. Truly, the debate is over (not ever having happened) now that all nations have signed up to the Paris COP doctrine. Political leaders are willing, even enthusiastic dupes, while climatist tactics erode the foundations of industrial society.  Deaths and unemployment are unavoidable, but then the planet already has too many people anyway.

ISIS is an immediate threat, but there is a deeper and present danger already doing damage to the underpinnings of Life As We Know It. It is the belief in Climate Change and the activists executing their game plan.  Make no mistake: they are well-funded, well-organized and mean business.  And the recent behavior of valve-turners, acting illegally to shut off supplies of fossil fuel energy, shows they are willing to go very far to impose their will upon the rest of us.

See Also:  Upping the Stakes for Ecoterrorists

636364932821107959-170724-03-iubprotest-bp


Summer “Hothouse” Silliness

This summer’s heat waves are having an unfortunate side effect. Some scientists who should know better are shouting wild claims as though their heads were exploding.  Paleoclimatologists use terms like “Hothouse” Earth and “Icehouse” Earth referring to our planet’s climate shifts over many eons.  One good old-fashioned hot summer is not a transition, or even an harbinger of an “Hothouse” world.  More importantly, the distribution of temperatures in a warmer world is not the hell on earth depicted by these folks who have lost their bearings.

A powerful post by Clive Best describes how earth’s surface temperatures change by means of changing meridional heat transfers. See Meridional Warming.

The key point for me was seeing how the best geological knowledge proves beyond the shadow of a doubt how the earth’s climate profile shifts over time, as presented in the diagram above.  It comes from esteemed paleoclimatologist Christopher Scotese.  His compete evidence and analysis can be reviewed in his article Some thoughts on Global Climate Change: The Transition from Icehouse to Hothouse (here).

In that essay Scotese shows where we are presently in this cycle between icehouse and hothouse.

As of 2015 earth is showing a GMT of 14.4C, compared to pre-industrial GMT of 13.8C.  According to the best geological evidence from millions of years of earth’s history, that puts us leaving the category “Severe Icehouse,” and nearing “Icehouse.”  So, thankfully we are warming up, albeit very slowly.

Moreover, and this is Clive Best’s point, progress toward a warming world means flattening the profile at the higher latitudes, especially the Arctic.  Equatorial locations remain at 23C throughout the millennia, while the gradient decreases in a warmer world.

A previous related post explained what is wrong with averaging temperature anomalies.  See Temperature Misunderstandings

Conclusion:

We have many, many centuries to go before the earth can warm up to the “Greenhouse” profile, let alone get to “Hothouse.”  Regional and local climates at higher latitudes will see slightly warming temperatures and smaller differences from equatorial climates.  These are facts based on solid geological evidence, not opinions or estimates from computer models.

It is still a very cold world, but we are moving in the right direction.  Stay the course.

Meanwhile, keep firing away Clive.

damaged-ship3


Fighting Plasticphobia


Despite the welcome presence of plastic items in our lives, there is mounting plasticphobia driven by the usual suspects: Multi Million Dollar enterprises like Greenpeace, Sierra Club, Natural Resources Defense Council, etc. The media and websites stoke fears and concerns about traces of chemicals used in making plastic products. The basic facts need reminding in this overheated climate of fear, so this post exposes widely observed poppycock about plastics with facts to put things in perspective.

Definition: pop·py·cock ˈpäpēˌkäk/informal noun meaning nonsense.
Synonyms: nonsense, rubbish, claptrap, balderdash, blather, moonshine, garbage; Origin: mid 19th century: from Dutch dialect pappekak, from pap ‘soft’ + kak ‘dung.’

Below are some points to consider in favor of plastics.  Examples below frequently mention plastic bags, bottles, and food containers, all subject to demonizing reports from activists.

Plastics are functional.

It feels like we have always had plastic. It is so widespread in our lives that it’s hard to imagine a time without it. But in reality, plastic products were only introduced in the 1950s. That was a time when the Earth’s population was 2.5 billion people and the global annual production of plastic was 1.5 million tonnes. Now, nearly 70 years later, plastic production exceeds 300 million tonnes a year and the world population is on its way to 8 billion. If this trend continues, another 33 billion tonnes of plastic will have accumulated around the planet by 2050.

Versatile plastics inspire innovations that help make life better, healthier and safer every day. Plastics are used to make bicycle helmets, child safety seats and airbags in automobiles. They’re in the cell phones, televisions, computers and other electronic equipment that makes modern life possible. They’re in the roofs, walls, flooring and insulation that make homes and buildings energy efficient. And plastics in packaging help keep foods safe and fresh.

Example: Conventional plastic shopping bags are not just a convenience, but a necessity. Plastic shopping bags are multi-use/multi-purpose bags with a shorter life. They are used not just as carry bags for groceries, but are essential – reused to help manage household and pet waste.

They are not just a convenience to carry groceries, but a necessity playing an important role to facilitate impulse purchases and for the management of household and pet waste; and in Toronto, organics collection. They have very high alternate use rate in Ontario of 59.1% (Ontario MOE (data).

A move to reusable bags will not eliminate the need for shorter-life bags. Householders will have to supplement their use of reusable bags with a paper or kitchen catcher type bags for household and pet waste. In Ireland, the virtual elimination of plastic bags because of a high bag tax, led to a 77% increase in the purchase of kitchen catchers which contain up to 76% more plastic than conventional plastic bags and a 21% increase in plastics consumed. The fact they are a necessity is reinforced by Decima Research which shows that 76% of Canadians would purchase kitchen catchers if plastic shopping bags are not available at retail check outs.

Beyond bags, manufacture of goods such as automobiles increasingly use plastics to reduce weight and fuel consumption, as well as meet requirements for recycling.

Plastics are Cheap.
Alternatives consume much more energy. Plastics are made mostly of petroleum refining by-products.

Paper bags generate 50 times more water pollutants, and 70% more emissions than plastic bags.
Plastic bags generate 80% less solid waste than paper bags.
Plastic bags use 40% less energy as compared to paper bags.
Even paper bags manufactured from recycled fiber utilized more fossil fuels than plastic bags.

On top of all this, if plastic bag bans like California’s end up causing people to use more paper bags — instead of bringing their reusable ones to the store — it’ll certainly end up being worse for the environment. Research shows that making a paper bag consumes about four times more energy than a plastic bag, and produces about four times more waste if it’s not recycled.

These numbers can vary based on agricultural techniques, shipping methods, and other factors, but when you compare plastic bags with food, it’s not even close. Yet for whatever reason, we associate plastic bags — but not food production — with environmental degradation. If we care about climate change, cutting down on food waste would be many, many times more beneficial than worrying about plastic bags.

Plastics are Durable.
Plastics are highly inert, do not easily degrade or decompose. Without sunlight, they can last for centuries.

Almost all bags are reusable; even the conventional plastic shopping bag has a reuse rate of between 40-60% in Canada.

Conventional plastic shopping bags are highly recyclable in Canada because there is a strong recycling network across the country. Recycling rates are quite high in most provinces.

Plastics are Abused.
Because plastic items are useful, cheap and durable, people leave them around as litter.
Plastics should be recycled or buried in landfill.

In a properly engineered landfill, nothing is meant to degrade. No bag – reusable or conventional plastic shopping bag – will decompose in landfill. which actually helps the environment by not producing greenhouse gases like methane.

This myth is based on a common misunderstanding of the purpose of landfills and how they work. Modern landfills are engineered to entomb waste and prevent decomposition, which creates harmful greenhouse gases like methane and carbon dioxide.

Plastics are Benign.
Plastics are not toxic, nor do they release greenhouse gases.

In Canada, plastic shopping bags are primarily made from a by-product of natural gas production, ethane.

Polyethylene bags are made out of ethane, a component of natural gas. Ethane is extracted to lower the BTU value of the gas in order to meet pipeline and gas utility specifications and so that the natural gas doesn’t burn too hot when used as fuel in our homes or businesses. The ethane is converted, and its BTU value is “frozen” into a solid form (polyethylene) using a catalytic process to make a plastic shopping bag.

There have been claims that chemicals in plastics can leach into food or drink and cause cancer. In particular, there have been rumours about chemicals called Bisphenol A (BPA) and dioxins. Hoax emails have spread warnings about dioxins being released when plastic containers are reused heated or frozen. These are credited to Johns Hopkins University in America, but the university denies any involvement.

Some studies have shown that small amounts of chemicals from plastic containers can end up in the food or drinks that are kept inside them. But the levels of these are very low.

Studies may also look at the effect of these chemicals on human cells. But they will often expose them to much higher levels than people are exposed to in real life. These levels are also much higher than the limits which are allowed in plastic by law. There is no evidence to show using plastic containers actually causes cancer in humans.

The European Food Safety Authority did a full scientific review of BPA in 2015 and decided there was no health risk to people of any age (including unborn children) at current BPA exposure levels. They are due to update this in 2018.

In the UK there is very strict regulation about plastics and other materials that are used for food or drink. These limits are well below the level which could cause harm in humans.

“Generally speaking, any food that you buy in a plastic container with directions to put it in the microwave has been tested and approved for safe use,” says George Pauli, associate director of Science and Policy at the US FDA’s Center for Food and Safety and Applied Nutrition.

Elizabeth Whelan, of the American Council on Science and Health, a consumer-education group in New York think that the case against BPA and phthalates has more in common with those against cyclamates and Alar than with the one against lead. “The fears are irrational,” she said. “People fear what they can’t see and don’t understand. Some environmental activists emotionally manipulate parents, making them feel that the ones they love the most, their children, are in danger.” Whelan argues that the public should focus on proven health issues, such as the dangers of cigarettes and obesity and the need for bicycle helmets and other protective equipment. As for chemicals in plastics, Whelan says, “What the country needs is a national psychiatrist.”

Plastics are A Scapegoat.
Rather than using plastics responsibly, some advocate banning them.

The type of bag you use makes less importance than what you put into it. When it comes to both climate change and trash production, eliminating plastic bags is a symbolic move, not a substantial one. Encouraging people to cut down on food waste, on the other hand, would actually mean something.

Litter audit data from major Canadian municipalities shows that plastic shopping bags are less than 1% of litter. The City of Toronto 2012 Litter Audit shows that plastic shopping bags were 0.8% of the entire litter stream.

Focus on the less than 1% of plastic bag litter does not address the other 99% of litter. Litter is a people problem, not a litter problem. Even if you removed all plastic shopping bag litter, 99 % of the litter would still be a problem.

Believe it or not, plastic bags are one of the most energy efficient things to manufacture. According to statistics, less than .05% of a barrel crude oil is used for the manufacturing of plastic bags in the US. On the other hand, 93% to 95% of each barrel is used for heating purposes and fuel.

In fact, most of the plastic bags used in the US are made from natural gas, 85% of them to be exact. And although plastic bags are made from natural gas and crude oil, the overall amount of fossil fuels they consume during their lifetime are significantly lesser than paper bags and compostable plastic.

So, banning or taxing plastic bags will really do nothing to curb America’s oil consumption. After all, it hardly uses a fraction!

Resources:  

https://news.grida.no/debunking-a-few-myths-about-marine-litter

http://www.allaboutbags.ca/myths.html

https://science.howstuffworks.com/environmental/green-science/paper-plastic1.htm

Top 7 Myths about Plastic Bags

https://www.plasticstoday.com/extrusion-pipe-profile/fear-plastics-and-what-do-about-it/13536413858942

https://www.cancerresearchuk.org/about-cancer/causes-of-cancer/cancer-controversies/plastic-bottles-and-food-containers

https://www.newyorker.com/magazine/2010/05/31/the-plastic-panic

https://www.webmd.com/food-recipes/features/mixing-plastic-food-urban-legend#3

Ocean Air Temps Tepid in July

Presently sea surface temperatures (SST) are the best available indicator of heat content gained or lost from earth’s climate system.  Enthalpy is the thermodynamic term for total heat content in a system, and humidity differences in air parcels affect enthalpy.  Measuring water temperature directly avoids distorted impressions from air measurements.  In addition, ocean covers 71% of the planet surface and thus dominates surface temperature estimates.  Eventually we will likely have reliable means of recording water temperatures at depth.

Recently, Dr. Ole Humlum reported from his research that air temperatures lag 2-3 months behind changes in SST.  He also observed that changes in CO2 atmospheric concentrations lag behind SST by 11-12 months.  This latter point is addressed in a previous post Who to Blame for Rising CO2?

The July update to HadSST3 will appear later this month, but in the meantime we can look at lower troposphere temperatures (TLT) from UAHv6 which are already posted for July. The temperature record is derived from microwave sounding units (MSU) on board satellites like the one pictured above.

The UAH dataset includes temperature results for air above the oceans, and thus should be most comparable to the SSTs. There is the additional feature that ocean air temps avoid Urban Heat Islands (UHI).  The graph below shows monthly anomalies for ocean temps since January 2015.

UAH Oceans 201807The anomalies are holding close to the same levels as 2015. In July, both the Tropics and SH rose, while NH rose very slightly, resulting in a small increase in the Global average of air over oceans. Taking a longer view, we can look at the record since 1995, that year being an ENSO neutral year and thus a reasonable starting point for considering the past two decades.  On that basis we can see the plateau in ocean temps is persisting. Since last October all oceans have cooled, with offsetting bumps up and down.

UAHv6 TLT 
Monthly Ocean
Anomalies
Average Since 1995 Ocean 7/2018
Global 0.13 0.21
NH 0.16 0.3
SH 0.11 0.15
Tropics 0.13 0.29

As of July 2018, global ocean temps are slightly higher than June and the average since 1995.  NH remains virtually the same,  while both SH and Tropics rose making the global temp warmer.  Global, NH and SH are matching July temps in 2015, while the Tropics are the lowest July since 2013.

The details of UAH ocean temps are provided below.  The monthly data make for a noisy picture, but seasonal fluxes between January and July are important.

Open image in new tab to enlarge.

The greater volatility of the Tropics is evident, leading the oceans through three major El Nino events during this period.  Note also the flat period between 7/1999 and 7/2009.  The 2010 El Nino was erased by La Nina in 2011 and 2012.  Then the record shows a fairly steady rise peaking in 2016, with strong support from warmer NH anomalies, before returning to the 22-year average.

Summary

TLTs include mixing above the oceans and probably some influence from nearby more volatile land temps.  They started the recent cooling later than SSTs from HadSST3, but are now showing the same pattern.  It seems obvious that despite the three El Ninos, their warming has not persisted, and without them it would probably have cooled since 1995.  Of course, the future has not yet been written.


Duped into War on Plastic

Step aside Polar Bear, It’s Turtle Time!

Everyday now, everywhere in the media someone else is lamenting the presence of plastics and proposing ways to end straws and other plastic items.  Terence Corcoran in Financial Post explains how we got here:  How green activists manipulated us into a pointless war on plastic  Excerpts in italics with my bolds.

The disruptive Internet mass-persuasion machine controlled by the major corporate tech giants, capable of twisting and manipulating the world’s population into believing concocted stories and fake news, is at it again, this time spooking billions of people into panic over plastic. Except…hold on: Those aren’t big greedy corporations and meddling foreign governments flooding the blue planet with alarming statistics of microplastics in our water and gross videos of turtles with straws stuck up their noses and dead birds with bellies stuffed with plastic waste.

As Earth Day/Week 2018 came to a close, the greatest professional twisters and hypers known to modern mass communications — green activists and their political and mainstream media enablers — had succeeded in creating a global political wing-flap over all things plastic.

That turtle video, viewed by millions and no doubt many more through Earth Day, is a classic of the genre, along with clubbed baby seals and starving polar bears. Filmed in 2015 near waters off the coast of Guanacaste, Costa Rica, the video was uploaded as news by the Washington Post in 2017 and reworked last week by the CBC into its series on the curse of plastics: “ ‘We need to rethink the entire plastics industry’: Why banning plastic straws isn’t enough.”

New York Governor Andrew Cuomo introduced a bill to ban single-use plastic shopping bags. In Ottawa, Prime Minister Justin Trudeau wants the G7 leaders to sign on to a “zero plastics waste charter” while British Prime Minister Theresa May promised to ban plastic straws.

No need for a secret data breach, a Russian bot or a covert algorithm to transform a million personal psychological profiles into malleable wads of catatonic dough. All it takes is a couple of viral videos, churning green activists and a willing mass media. “Hello, is this CBC News? I have a video here of a plastic straw being extracted from the nose of sea turtle. Interested?”

One turtle video is worth 50-million Facebook data breaches, no matter how unlikely the chances are that more than one turtle has faced the plastic-straw problem. If the object in the unfortunate turtle’s nasal passage was a plastic straw (was it analyzed?), it would have likely come from one of the thousands of tourists who visit Costa Rica to watch hundreds of plastics-free healthy turtles storm the country’s beaches for their annual egg-hatching ritual.

That the turtles are not in fact threatened by plastic straws would be no surprise. It is also hard to see how banning straws in pubs in London and fast-food joints in Winnipeg would save turtles in the Caribbean or the Pacific Ocean.

Creating such environmental scares is the work of professional green activists. A group called Blue Ocean Network has been flogging the turtle video for three years, using a propaganda technique recently duplicated by polar-bear activists. Overall, the plastic chemical scare follows a familiar pattern. Canadians will remember Rick Smith, the former executive director of Environmental Defense Canada and co-author of a 2009 book, Slow Death by Rubber Duck. In the book, Smith warned of how the toxic chemistry of everyday life was ruining our health, reducing sperm counts and threatening mothers and all of humanity. The jacket cover of Slow Death included a blurb from Sophie Gregoire-Trudeau, who expressed alarm about all the chemicals “absorbed into our bodies every day.”

To mark Earth Day 2018, orchestrated as part of a global anti-plastics movement, Smith was back at his old schtick with an op-ed in The Globe and Mail in which he warns “We must kill plastics to save ourselves.” Smith, now head of the left-wing Broadbent Institute in Ottawa, reminded readers that since his Slow Death book, a new problem has emerged, “tiny plastic particles (that) are permeating every human on earth.” He cites a study that claimed “83 per cent of tap water in seven countries was found to contain plastic micro-fibres.”

You would think Smith would have learned by now that such data is meaningless. Back in 2009, Smith issued a similar statistical warning. “A stunning 93 per cent of Americans tested have measurable amounts of BPA in their bodies.” BPA (bisphenol A) is a chemical used in plastics that Smith claimed produced major human-health problems.

Turns out it wasn’t true. The latest — and exhaustive — science research on BPA, published in February by the U.S. National Toxicology Program, concluded that “BPA produces minimal effects that were indistinguishable from background.” Based on this comprehensive research, the U.S. Food and Drug Administration said current uses of BPA “continue to be safe for consumers.”

Might the same be true for barely-measurable amounts of micro-plastics found today in bottled water and throughout the global ecosystem? That looks possible. A new meta-analysis of the effects of exposure to microplastics on fish and aquatic invertebrates suggests there may be nothing to worry about. Dan Barrios-O’Neill, an Irish researcher who looked at the study, tweeted last week that “There are of course many good reasons to want to curb plastic use. My reading of the evidence — to date — is that negative ecological effects might not be one of them.”

Instead of responding to turtle videos and images of plastic and other garbage swirling in ocean waters with silly bans and high talk of zero plastic waste, it might be more useful to zero in on the real sources of the floating waste: governments that allow it to be dumped in the oceans in the first place.

Update: August 4, 2018

Claim: There is a “sea of plastic” the size of Texas in the North Pacific Gyre north of Hawaii

First question: have you ever seen an aerial or satellite photograph of the “sea of plastic”? Probably not, because it doesn’t really exist. But it makes a good word- picture and after all plastic is full of deadly poisons and is killing seabirds and marine mammals by the thousands.

This is also fake news and gives rise to calls for bans on plastic and other drastic measures. Silly people are banning plastic straws as if they were a dire threat to the environment. The fact is a piece of plastic floating in the ocean is no more toxic than a piece of wood. Wood has been entering the sea in vast quantities for millions of years. And in the same way that floating woody debris provides habitat for barnacles, seaweeds, crabs, and many other species of marine life, so does floating plastic. That’s why seabirds and fish eat the bits of plastic, to get the food that is growing on them. While it is true that some individual birds and animals are harmed by plastic debris, discarded fishnets in particular, this is far outweighed by the additional food supply it provides. Plastic is not poison or pollution, it is litter.

Patrick Moore, PhD

Footnote:  Dare I say it?  (I know you are thinking it.): “They are grasping at straws, with no end in sight.”


Halting Failed Auto Fuel Standards

There are deeper reasons why US auto fuel efficiency standards are and should be rolled back.  They were instituted in denial of regulatory experience and science.  First, a parallel from physics.

In the sub-atomic domain of quantum mechanics, Werner Heisenberg, a German physicist, determined that our observations have an effect on the behavior of quanta (quantum particles).

The Heisenberg uncertainty principle states that it is impossible to know simultaneously the exact position and momentum of a particle. That is, the more exactly the position is determined, the less known the momentum, and vice versa. This principle is not a statement about the limits of technology, but a fundamental limit on what can be known about a particle at any given moment. This uncertainty arises because the act of measuring affects the object being measured. The only way to measure the position of something is using light, but, on the sub-atomic scale, the interaction of the light with the object inevitably changes the object’s position and its direction of travel.

Now skip to the world of governance and the effects of regulation. A similar finding shows that the act of regulating produces reactive behavior and unintended consequences contrary to the desired outcomes.

US Fuel Economy (CAFE) Standards Have Backfired

An article at Financial Times explains about Energy Regulations Unintended Consequences  Excerpts below with my bolds.

Goodhart’s Law holds that “any observed statistical regularity will tend to collapse once pressure is placed upon it for control purposes”. Originally coined by the economist Charles Goodhart as a critique of the use of money supply measures to guide monetary policy, it has been adopted as a useful concept in many other fields. The general principle is that when any measure is used as a target for policy, it becomes unreliable. It is an observable phenomenon in healthcare, in financial regulation and, it seems, in energy efficiency standards.

When governments set efficiency regulations such as the US Corporate Average Fuel Economy standards for vehicles, they are often what is called “attribute-based”, meaning that the rules take other characteristics into consideration when determining compliance. The Cafe standards, for example, vary according to the “footprint” of the vehicle: the area enclosed by its wheels. In Japan, fuel economy standards are weight-based. Like all regulations, fuel economy standards create incentives to game the system, and where attributes are important, that can mean finding ways to exploit the variations in requirements. There have long been suspicions that the footprint-based Cafe standards would encourage manufacturers to make larger cars for the US market, but a paper this week from Koichiro Ito of the University of Chicago and James Sallee of the University of California Berkeley provided the strongest evidence yet that those fears are likely to be justified.

Mr Ito and Mr Sallee looked at Japan’s experience with weight-based fuel economy standards, which changed in 2009, and concluded that “the Japanese car market has experienced a notable increase in weight in response to attribute-based regulation”. In the US, the Cafe standards create a similar pressure, but expressed in terms of size rather than weight. Mr Ito suggested that in Ford’s decision to end almost all car production in North America to focus on SUVs and trucks, “policy plays a substantial role”. It is not just that manufacturers are focusing on larger models; specific models are also getting bigger. Ford’s move, Mr Ito wrote, should be seen as an “alarm bell” warning of the flaws in the Cafe system. He suggests an alternative framework with a uniform standard and tradeable credits, as a more effective and lower-cost option. With the Trump administration now reviewing fuel economy and emissions standards, and facing challenges from California and many other states, the vehicle manufacturers appear to be in a state of confusion. An elegant idea for preserving plans for improving fuel economy while reducing the cost of compliance could be very welcome.

The paper is The Economics of Attribute-Based Regulation: Theory and Evidence from Fuel-Economy Standards Koichiro Ito, James M. Sallee NBER Working Paper No. 20500.  The authors explain:

An attribute-based regulation is a regulation that aims to change one characteristic of a product related to the externality (the “targeted characteristic”), but which takes some other characteristic (the “secondary attribute”) into consideration when determining compliance. For example, Corporate Average Fuel Economy (CAFE) standards in the United States recently adopted attribute-basing. Figure 1 shows that the new policy mandates a fuel-economy target that is a downward-sloping function of vehicle “footprint”—the square area trapped by a rectangle drawn to connect the vehicle’s tires.  Under this schedule, firms that make larger vehicles are allowed to have lower fuel economy. This has the potential benefit of harmonizing marginal costs of regulatory compliance across firms, but it also creates a distortionary incentive for automakers to manipulate vehicle footprint.

Attribute-basing is used in a variety of important economic policies. Fuel-economy regulations are attribute-based in China, Europe, Japan and the United States, which are the world’s four largest car markets. Energy efficiency standards for appliances, which allow larger products to consume more energy, are attribute-based all over the world. Regulations such as the Clean Air Act, the Family Medical Leave Act, and the Affordable Care Act are attribute-based because they exempt some firms based on size. In all of these examples, attribute-basing is designed to provide a weaker regulation for products or firms that will find compliance more difficult.

Summary from Heritage Foundation study Fuel Economy Standards Are a Costly Mistake Excerpt with my bolds.

The CAFE standards are not only an extremely inefficient way to reduce carbon dioxide emission but will also have a variety of unintended consequences.

For example, the post-2010 standards apply lower mileage requirements to vehicles with larger footprints. Thus, Whitefoot and Skerlos argued that there is an incentive to increase the size of vehicles.

Data from the first few years under the new standard confirm that the average footprint, weight, and horsepower of cars and trucks have indeed all increased since 2008, even as carbon emissions fell, reflecting the distorted incentives.

Manufacturers have found work-arounds to thwart the intent of the regulations. For example, the standards raised the price of large cars, such as station wagons, relative to light trucks. As a result, automakers created a new type of light truck—the sport utility vehicle (SUV)—which was covered by the lower standard and had low gas mileage but met consumers’ needs. Other automakers have simply chosen to miss the thresholds and pay fines on a sliding scale.

Another well-known flaw in CAFE standards is the “rebound effect.” When consumers are forced to buy more fuel-efficient vehicles, the cost per mile falls (since their cars use less gas) and they drive more. This offsets part of the fuel economy gain and adds congestion and road repair costs. Similarly, the rising price of new vehicles causes consumers to delay upgrades, leaving older vehicles on the road longer.

In addition, the higher purchase price of cars under a stricter CAFE standard is likely to force millions of households out of the new-car market altogether. Many households face credit constraints when borrowing money to purchase a car. David Wagner, Paulina Nusinovich, and Esteban Plaza-Jennings used Bureau of Labor Statistics data and typical finance industry debt-service-to-income ratios and estimated that 3.1 million to 14.9 million households would not have enough credit to purchase a new car under the 2025 CAFE standards.[34] This impact would fall disproportionately on poorer households and force the use of older cars with higher maintenance costs and with fuel economy that is generally lower than that of new cars.

CAFE standards may also have redistributed corporate profits to foreign automakers and away from Ford, General Motors (GM), and Chrysler (the Big Three), because foreign-headquartered firms tend to specialize in vehicles that are favored under the new standards.[35] 

Conclusion

CAFE standards are costly, inefficient, and ineffective regulations. They severely limit consumers’ ability to make their own choices concerning safety, comfort, affordability, and efficiency. Originally based on the belief that consumers undervalued fuel economy, the standards have morphed into climate control mandates. Under any justification, regulation gives the desires of government regulators precedence over those of the Americans who actually pay for the cars. Since the regulators undervalue the well-being of American consumers, the policy outcomes are predictably harmful.


Deaths from Heat Waves to Increase 2000%: “It Will Be Awful”

This story is from Sputnik and is presented with a straight face: It Will Be Awful:’ Global Warming Could Soon Increase Heat Wave Deaths 2,000% Excerpts below in italics with my bolds and some references for context.

Deaths Classified as “Heat-Related” in the United States, 1979–2014. Source: EPA

The number of deaths from heat waves could increase by up to 2,000 percent in some areas of the world by 2080, according to a new study released Tuesday by researchers at Monash University in Melbourne, Australia.

“Future heat waves in particular will be more frequent, more intense and will last much longer,” Yuming Guo, the study’s lead researcher, said in a Tuesday statement to Reuters. “If we cannot find a way to mitigate the climate change (reduce the heat wave days) and help people adapt to heat waves, there will be a big increase of heat wave-related deaths in the future.”

The researchers developed a model to predict the number of deaths caused by heatwaves in 412 communities in 20 countries on four continents between 2031 and 2080.

The study predicted mortality caused by heat waves under different scenarios that take into account levels of greenhouse gas emissions, population density and adaptation strategies.

“We estimated heat wave-mortality associations through a two-stage time series design,” the report, which was published in PLOS Medicine, stated.

“Current and future daily mean temperature series were projected under four scenarios of greenhouse gas emissions from 1971 — 2099… We projected excess mortality in relation to heat waves in the future under each scenario of greenhouse gas emissions, with two assumptions for adaptation (no adaptation and hypothetical adaptation) and three scenarios of population change (high variant, median variant and low variant).”

The findings stated that the increase in mortality caused by heat waves is expected to be highest near the equator. Countries in that area are projected see a 2,000 percent increase in heat wave-related fatalities from 2031 to 2080, compared to the 1971 to 2020 span.

India sees sharp fall in heat wave deaths  CNN June 25, 2018

“If people cannot adapt to future climate change, heat wave-related excess mortality is expected to increase the most in tropical and subtropical countries/regions, while European countries and the United States will have smaller increases. The more serious the greenhouse gas emissions, the higher the heat wave-related excess mortality in the future,” concluded the study.

Even if people do adapt to future climate change, heat wave-related deaths would still increase in the future under the high-variant population and serious greenhouse gas emissions situations. The projected increase in mortality is much smaller, however, than in the no-adaptation cases.

Heat-related mortality trends under recent climate warming in Spain: A 36-year observational study

• We analysed daily mortality records from 47 major cities in Spain.
• There has been a general and sustained decline in the vulnerability of the population since 1980.
• Despite the observed warming, the decline of the vulnerability has generally contributed to a progressive reduction in the number of deaths attributed to heat since 1980.

Fred Magdoff, professor emeritus of plant and soil science at the University of Vermont and co-author of “What Every Environmentalist Needs to Know About Capitalism” and “Creating an Ecological Society: Toward a Revolutionary Transformation,” told Sputnik Wednesday that the increase in heat waves will not only affect poorer countries that are close to the equator, but also countries like Japan.
(Note: Magdoff is not related to Bernie Madoff, who made off with 65 billion US$ by bilking investors.)

“Although the poor countries will have more problems with this, it also affects the north — Japan hit an all time high of 106 degrees F, and there are heat waves in Europe and the US. Clearly those in the wealthier countries are able to deal with this better, either through home air conditioning or access to ‘cooling stations,'” Magdoff told Sputnik.

The carbon dioxide level in the atmosphere is currently about 410 ppm (it was around 320 in the 1950s), and in a relatively few decades it will reach 450, assuming current trends persist. After that, global warming may actually increase faster. Thus, I am not too surprised about the prediction for 2080 — not a pretty picture indeed. It will be awful,” Magdoff added.

According to the study, adaptation strategies to reduce greenhouse gas emissions are necessary, including opening cooling centers and painting rooftops white to reflect sunlight.

Footnote:  A previous post celebrated the fact that heat wave hysteria was muted this year.  Obviously, that didn’t last very long.

“World to burn up; Women, minorities and the poor to be hardest hit.”

July Arctic Ice Surprise

Arctic ice July07to18

Early in July, a divergence of 2018 surplus ice resembled a hockey stick temporarily.  Though the blade later drooped downward, ice extent remained above average throughout July.  The graph above shows 2018  300k km2 above the 11 year average for July (2007 to 2017 inclusive).  Only 2015 and 2008 had a higher July monthly average extent.  Note that SII (NOAA’s Sea Ice Index) was lower by 436k km2 in 2018, and SII 11 yr. average is lower by 264k km2.

Arctic day 212

The surprise:  This is the first 2018 month above the average.  Indeed March 2018 (annual maximum) was almost 500k km2 lower than March 11 yr. average.  But reduced rates of melting in May, June and July have resulted in more ice extent than most other recent Julys.  At end of July, 2018, 2017 and 11 yr. average are close together, with SII 600k lower and 2007 with 824k km2 less ice.

The table below shows ice extents by regions comparing 2018 with 11-year average (2007 to 2017 inclusive) and 2017.

Region 2018212 Day 212 
Average
2018-Ave. 2007212 2018-2007
 (0) Northern_Hemisphere 7169781 7084113 85668 6344860 824921
 (1) Beaufort_Sea 898821 774345 124476 760576 138246
 (2) Chukchi_Sea 540543 544864 -4320 382350 158193
 (3) East_Siberian_Sea 952130 770306 181824 445385 506745
 (4) Laptev_Sea 338486 448988 -110502 314382 24103
 (5) Kara_Sea 112802 188689 -75888 239232 -126430
 (6) Barents_Sea 525 34556 -34031 23703 -23177
 (7) Greenland_Sea 213399 309333 -95934 324737 -111338
 (8) Baffin_Bay_Gulf_of_St._Lawrence 252017 146604 105413 94179 157838
 (9) Canadian_Archipelago 549236 565183 -15947 510063 39173
 (10) Hudson_Bay 253116 147477 105639 93655 159462
 (11) Central_Arctic 3057671 3151943 -94272 3154837 -97166

2018 is 86k km2 above average (1.2%). Laptev, Kara, Greenland Sea and Central Arctic are down.  Offsetting surpluses are in Beaufort and East Siberian seas, as well as Hudson and Baffin Bays.  Since the two bays will melt out soon, the eventual annual minimum remains to be seen.

Postscript:

Interesting commentary from Dr. Judah Cohen at his July 30, 2018 Arctic Oscillation and Polar Vortex Analysis and Forecasts Excerpts in italics with my bolds.

In the rest of the Impacts section I want to discuss what I wrote in the June 4th blog as it seems to be very relevant for this summer and especially the European summer version of western North America’s winter ridiculously resilient ridge. In the blog I described how a diminishing cryosphere (snow and ice) might be contributing to more persistent and amplified waves in the atmosphere a physical mechanism different from what I typically describe in winter. This mechanism may just be the best explanation of what occurred this summer over Europe. Though probably the precondition of the soil or its desiccation is probably another important contributor to the heat and dry conditions over Northern Europe this summer:

“Over the past several blog posts I have been discussing blocking and ridging over northern Europe with a split Jet Stream across Europe with the polar branch way to the north across northern Scandinavia and a second subtropical branch across the Mediterranean. In between the two Jet Streams has been a sort of no-man’s land with weak zonal winds in the mid-troposphere across much of Central and Northern Europe. This has resulted in a warm spring so far and for the months of April and May, Europe has seen possibly the largest positive temperature departures from normal for the entire Northern Hemisphere (NH).

A warm spring is different than a hot summer and had this atmospheric circulation occurred in July and August instead of April and May it would have created greater news headlines, straining resources and resulting a likely spike in mortality. Europe has been experiencing more frequent hot summers over the past couple of decades with possibly the most infamous being 2003 but even as recently as last summer, when extreme heat accompanied by forest fires were common across Southern Europe. The atmospheric circulation across Europe this spring with blocking and a split Jet Stream is consistent with an idea that Arctic change is resulting in more frequent occurrences of extreme summer weather including flooding, drought and heat waves. This is admittedly not my expertise but I thought it could be interesting to give a brief discussion given the weather pattern across Europe this past spring, which could be laying the groundwork for an overall hot upcoming summer.

In winter the loss of sea ice has contributed to accelerated warming across the Arctic Ocean referred to as Arctic amplification. This is hypothesized by some including me to influence mid-latitude weather either by weakening the zonal Jet Stream or by favoring large scale anomalous atmospheric waves that project onto the climatological waves forced by the geography of the NH. Amplification of the climatological waves leads to a breakdown of the polar vortex followed by increases in severe winter weather across the NH. This is a topic that write about often in my blog posts in the winter months.

Other scientists have postulated something somewhat analogous but also different for the warm season. During the warm boreal months it is much harder for the Arctic Ocean to warm rapidly relative to normal because even with increased ice melt, the ocean remains colder than the overlying atmosphere so energy is transferred from the atmosphere to the ocean rather than vice versa as in winter. Therefore we have not observed in the Arctic Ocean basin the extreme warm events in summer as we do in winter. Instead the rapid disappearance of snow cover in the spring and early summer has allowed the land masses that ring the Arctic Ocean to heat up much more quickly today than they used to two or three decades ago. So the accelerated Arctic warming in summer is not observed over the Ocean but rather across the adjacent land masses of Eurasia and North America.

The accelerated warming to the north can still cause a slackening of the zonal Jet Stream as the south to north temperature gradient weakens. Instead of one Jet Stream across the mid-latitudes, the Jet Stream splits into two pieces one to the north and a second to the south. The northerly Jet forms along and just north of the land regions that are experiencing the most accelerated warming that ring the Arctic approximately along the 70°N latitude, as a the strong warming along the north slope of the continents with a still relatively cold Arctic ocean maintains a strong temperature gradient and a Jet Stream. The southerly Jet Stream forms where the normal south to north temperature gradient resumes across the southern mid-latitudes or in a band between 30-45°N latitude. In between the two Jet Streams the winds are very weak. It turns out this atmospheric configuration with a Jet Stream to the north, a Jet Stream to the south and very weak winds in between is ideal for trapping waves that are persistent in one location and can even amplify. This is referred to as quasi-resonant amplification (QRA). When QRA occurs, atmospheric waves become trapped and persist for much longer periods than normal. This in turns leads to an increased probability of extreme weather whether it be floods, drought or heat waves. The split Jet Stream, the persistent atmospheric waves and extreme weather have all been observed to be increasing over the past two decades. Some early papers on the subject are Petoukhov et al. 2013 and Coumou et al. 2014. The weather models are predicting this latest example of QRA over Europe to dissipate over the coming two weeks but a recurrence of QRA over Europe or a different region this summer is not only of meteorological interest but of societal importance.”

Footnote on MASIE Data Sources:

MASIE reports are based on data primarily from NIC’s Interactive Multisensor Snow and Ice Mapping System (IMS). From the documentation, the multiple sources feeding IMS are:

Platform(s) AQUA, DMSP, DMSP 5D-3/F17, GOES-10, GOES-11, GOES-13, GOES-9, METEOSAT, MSG, MTSAT-1R, MTSAT-2, NOAA-14, NOAA-15, NOAA-16, NOAA-17, NOAA-18, NOAA-N, RADARSAT-2, SUOMI-NPP, TERRA

Sensor(s): AMSU-A, ATMS, AVHRR, GOES I-M IMAGER, MODIS, MTSAT 1R Imager, MTSAT 2 Imager, MVIRI, SAR, SEVIRI, SSM/I, SSMIS, VIIRS

Summary: IMS Daily Northern Hemisphere Snow and Ice Analysis

The National Oceanic and Atmospheric Administration / National Environmental Satellite, Data, and Information Service (NOAA/NESDIS) has an extensive history of monitoring snow and ice coverage.Accurate monitoring of global snow/ice cover is a key component in the study of climate and global change as well as daily weather forecasting.

The Polar and Geostationary Operational Environmental Satellite programs (POES/GOES) operated by NESDIS provide invaluable visible and infrared spectral data in support of these efforts. Clear-sky imagery from both the POES and the GOES sensors show snow/ice boundaries very well; however, the visible and infrared techniques may suffer from persistent cloud cover near the snowline, making observations difficult (Ramsay, 1995). The microwave products (DMSP and AMSR-E) are unobstructed by clouds and thus can be used as another observational platform in most regions. Synthetic Aperture Radar (SAR) imagery also provides all-weather, near daily capacities to discriminate sea and lake ice. With several other derived snow/ice products of varying accuracy, such as those from NCEP and the NWS NOHRSC, it is highly desirable for analysts to be able to interactively compare and contrast the products so that a more accurate composite map can be produced.

The Satellite Analysis Branch (SAB) of NESDIS first began generating Northern Hemisphere Weekly Snow and Ice Cover analysis charts derived from the visible satellite imagery in November, 1966. The spatial and temporal resolutions of the analysis (190 km and 7 days, respectively) remained unchanged for the product’s 33-year lifespan.

As a result of increasing customer needs and expectations, it was decided that an efficient, interactive workstation application should be constructed which would enable SAB to produce snow/ice analyses at a higher resolution and on a daily basis (~25 km / 1024 x 1024 grid and once per day) using a consolidated array of new as well as existing satellite and surface imagery products. The Daily Northern Hemisphere Snow and Ice Cover chart has been produced since February, 1997 by SAB meteorologists on the IMS.

Another large resolution improvement began in early 2004, when improved technology allowed the SAB to begin creation of a daily ~4 km (6144×6144) grid. At this time, both the ~4 km and ~24 km products are available from NSIDC with a slight delay. Near real-time gridded data is available in ASCII format by request.

In March 2008, the product was migrated from SAB to the National Ice Center (NIC) of NESDIS. The production system and methodology was preserved during the migration. Improved access to DMSP, SAR, and modeled data sources is expected as a short-term from the migration, with longer term plans of twice daily production, GRIB2 output format, a Southern Hemisphere analysis, and an expanded suite of integrated snow and ice variable on horizon. Source:  Interactive Multisensor Snow and Ice Mapping System (IMS)