This message from the Eagles goes out to all those social justice warriors on campus.
Jordan Peterson: “So the first thing that you might want to know about Postmodernism is that it doesn’t have a shred of gratitude — and there’s something pathologically wrong with a person that doesn’t have any gratitude, especially when they live in what so far is the best of all possible worlds. So if you’re not grateful, you’re driven by resentment, and resentment is the worst emotion that you can possibly experience, apart from arrogance. Arrogance, resentment, and deceit. There is an evil triad for you.”
Previous posts addressed the claim that fossil fuels are driving global warming. This post updates that analysis with the latest (2017) numbers from BP Statistics and compares World Fossil Fuel Consumption (WFFC) with three estimates of Global Mean Temperature (GMT). More on both these variables below.
The reporting categories are:
Oil
Natural Gas
Coal
Nuclear
Hydro
Renewables (other than hydro)
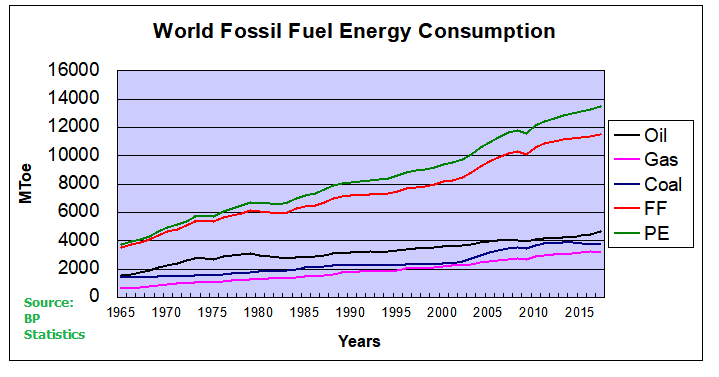
This analysis combines the first three, Oil, Gas, and Coal for total fossil fuel consumption world wide. The chart below shows the patterns for WFFC compared to world consumption of Primary Energy from 1965 through 2017.
The graph shows that Primary Energy consumption has grown continuously for 5 decades. Over that period oil, gas and coal (sometimes termed “Thermal”) averaged 89% of PE consumed, ranging from 94% in 1965 to 85% in 2017. MToe is millions of tons of oil equivalents.
Global Mean Temperatures
Everyone acknowledges that GMT is a fiction since temperature is an intrinsic property of objects, and varies dramatically over time and over the surface of the earth. No place on earth determines “average” temperature for the globe. Yet for the purpose of detecting change in temperature, major climate data sets estimate GMT and report anomalies from it.
UAH record consists of satellite era global temperature estimates for the lower troposphere, a layer of air from 0 to 4km above the surface. HadSST estimates sea surface temperatures from oceans covering 71% of the planet. HADCRUT combines HadSST estimates with records from land stations whose elevations range up to 6km above sea level.
Both GISS LOTI (land and ocean) and HADCRUT4 (land and ocean) use 14.0 Celsius as the climate normal, so I will add that number back into the anomalies. This is done not claiming any validity other than to achieve a reasonable measure of magnitude regarding the observed fluctuations.
No doubt global sea surface temperatures are typically higher than 14C, more like 17 or 18C, and of course warmer in the tropics and colder at higher latitudes. Likewise, the lapse rate in the atmosphere means that air temperatures both from satellites and elevated land stations will range colder than 14C. Still, that climate normal is a generally accepted indicator of GMT.
Correlations of GMT and WFFC
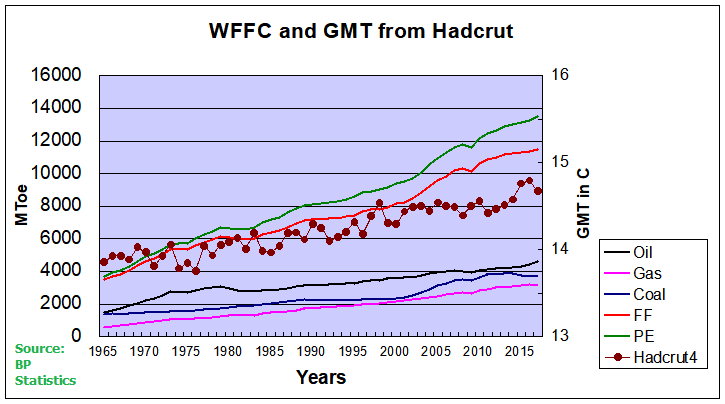
The next graph compares WFFC to GMT estimates over the five decades from 1965 to 2017 from HADCRUT4, which includes HadSST3.
Over the last five decades the increase in fossil fuel consumption is dramatic and monotonic, steadily increasing by 227% from 3.5B to 11.5B oil equivalent tons. Meanwhile the GMT record from Hadcrut shows multiple ups and downs with an accumulated rise of 0.9C over 52 years, 6% of the starting value.
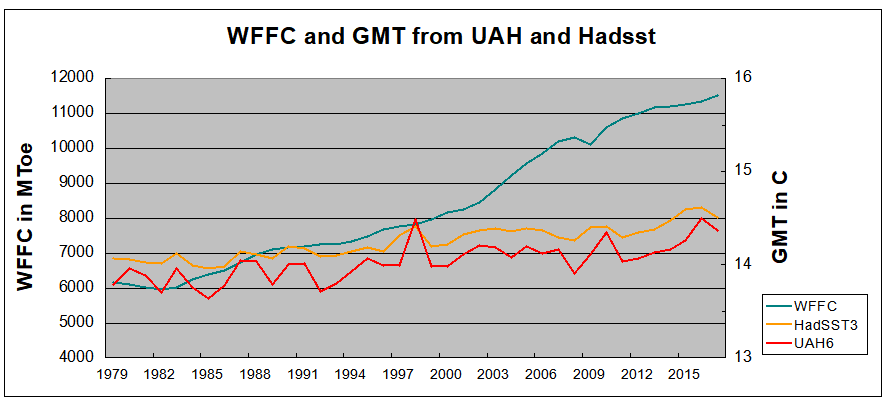
The second graph compares to GMT estimates from UAH6, and HadSST3 for the satellite era from 1979 to 2017, a period of 38 years.
In the satellite era WFFC has increased at a compounded rate of nearly 2% per year, for a total increase of 87% since 1979. At the same time, SST warming amounted to 0.44C, or 3.1% of the starting value. UAH warming was 0.58C, or 4.2% up from 1979. The temperature compounded rate of change is 0.1% per year, an order of magnitude less. Even more obvious is the 1998 El Nino peak and flat GMT since.
Summary
The climate alarmist/activist claim is straight forward: Burning fossil fuels makes measured temperatures warmer. The Paris Accord further asserts that by reducing human use of fossil fuels, further warming can be prevented. Those claims do not bear up under scrutiny.
It is enough for simple minds to see that two time series are both rising and to think that one must be causing the other. But both scientific and legal methods assert causation only when the two variables are both strongly and consistently aligned. The above shows a weak and inconsistent linkage between WFFC and GMT.
Going further back in history shows even weaker correlation between fossil fuels consumption and global temperature estimates:
Figure 5.1. Comparative dynamics of the World Fuel Consumption (WFC) and Global Surface Air Temperature Anomaly (ΔT), 1861-2000. The thin dashed line represents annual ΔT, the bold line—its 13-year smoothing, and the line constructed from rectangles—WFC (in millions of tons of nominal fuel) (Klyashtorin and Lyubushin, 2003). Source: Frolov et al. 2009
In legal terms, as long as there is another equally or more likely explanation for the set of facts, the claimed causation is unproven. The more likely explanation is that global temperatures vary due to oceanic and solar cycles. The proof is clearly and thoroughly set forward in the post Quantifying Natural Climate Change.
The NFU has warned farmers they face rises in climate change taxes unless they register for a discount scheme before the 31 July deadline.
The Climate Change Levy (CCL) is a tax charged on gas, electricity, LPG, coal and coke used by UK businesses.
In April 2019, CCL rates levied on energy bills will increase by about 3% for electricity and 7% for gas for any businesses that do not register for a discounted rate under an NFU scheme.
Under the CCL scheme, eligible businesses can receive a discount in return for meeting energy-efficiency or carbon-saving targets. Achieving these targets will enable the business to receive a discount until March 2023, the NFU says.
The NFU CCL scheme gives up to 93% levy reductions on electricity and 78% on gas to qualifying businesses in the pig, poultry and protected horticulture sectors. It is therefore imperative to sign up to the scheme before the deadline of 31 July, the union warns.
Example of annual CCL savings for poultry farm using 350,000 kWh of import electricity and 45,000 litres of LPG
The story comes from Bloomberg, where they regard the event as lamentable: Ontario Scraps Carbon-Reduction Plan as It Expands Elsewhere. Excerpts below with my bolds.
Ontario will scrap the province’s cap-and-trade program and pull out of the carbon-trading market with Quebec and California even as pollution pricing expands in other regions of the world.
Ontario’s Progressive Conservatives will follow through on a campaign promise to withdraw from the environmental program that required companies to buy credits to offset pollution blamed for global warming. Premier-designate Doug Ford also said he will challenge Prime Minister Justin Trudeau’s authority to make local governments put a price on greenhouse-gas emissions.
The move comes as carbon-pricing programs are expanding in the U.S. even as President Donald Trump seeks to ease restrictions on coal companies. Europe already has a large regional cap-and-trade system while China, the world’s biggest polluter, has committed to a national pollution program that could open by 2020.
Ontario’s election results were largely priced into California’s carbon market. Despite Friday’s announcement, emitters in Ontario remain obligated to manage their carbon pollution until the province formally withdraws from the system, said John Battaglia, head of carbon markets at BGC Environmental Brokerage Services LP.
“The market is stable here,” Battaglia said in an interview. “We expect a bit of short-term volatility, but long term, the show will go on.” (Comment: It is all about the show, isn’t it?)
Ontario’s PCs will be sworn in June 29 after defeating the Liberals in an election earlier this month. Ending what Ford called a job-killing carbon tax was one of his major commitments during the campaign. Ontario will also quit the Western Climate Initiative, Ford said Friday from Toronto.
Trudeau Plan
“Eliminating the carbon tax and cap-and-trade is the right thing to do and is a key component in our plan to bring your gas prices down by 10 cents per liter,” Ford said in a statement.
But the move may not spare Ontario from a carbon price. Trudeau’s government is bringing in carbon pricing rules to cover all provinces and a “backstop” for local governments that don’t come up with their own plans this year.
“Ontario is going to still have an obligation under the federal architecture and the cost of meeting that obligation could be higher,” said Dallas Burtraw, a senior fellow at Resources for the Future. “The costs of the cap-and-trade program are small on retail gasoline rates.”
Another wheel comes off the Ontario Green Energy bus.
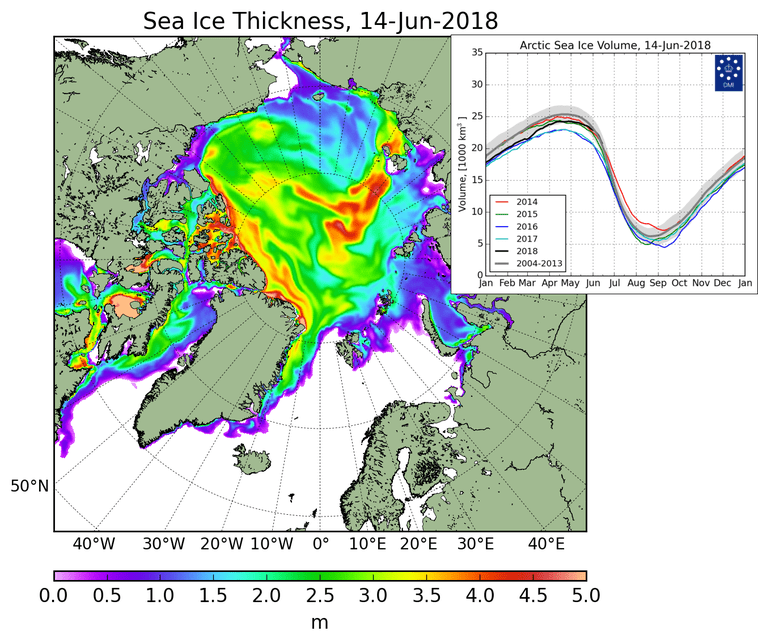
In June, ice extents are declining as usual, except for the early melting in Bering and Okhotsk Seas. The image above from DMI shows widespread thick ice across the Arctic core, likely to melt more slowly. The graph above shows how much volume was added since March 2018, bringing it close to 2014, a particularly icy year.
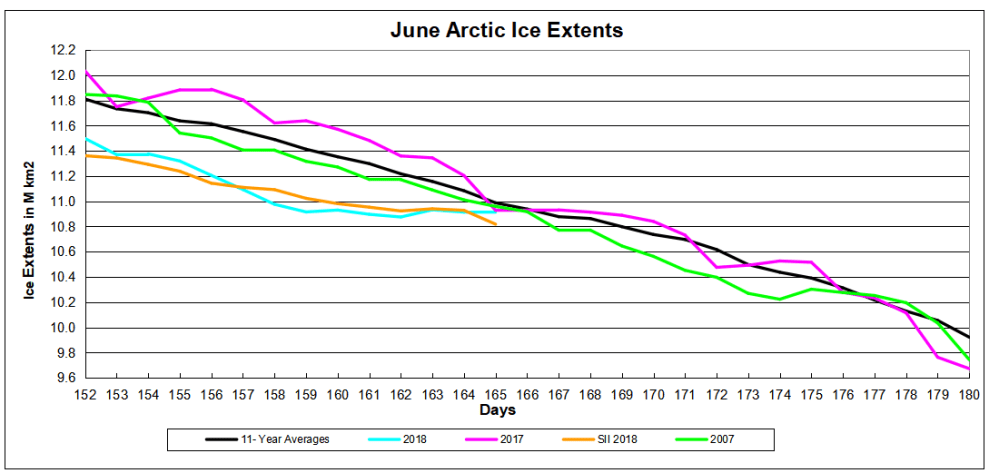
The graph below shows how the Arctic extent from MASIE has faired the first two weeks of June up to yesterday, compared to the 11 year average and to some years of interest.
Note that 2018 is now matching the 11-year average, as well as 2017 and 2007. SII 2018 is tracking MASIE 2018 closely.
The table shows regional ice extents compared to average and 2007.
Region
2018165
Day 165
Average
2018-Ave.
2007165
2018-2007
(0) Northern_Hemisphere
10915601
10987296
-71695
10959202
-43601
(1) Beaufort_Sea
1029988
964246
65742
952869
77119
(2) Chukchi_Sea
756185
803037
-46852
770182
-13997
(3) East_Siberian_Sea
1067948
1051979
15968
1040890
27058
(4) Laptev_Sea
722052
786204
-64152
755629
-33577
(5) Kara_Sea
870277
716595
153682
770755
99522
(6) Barents_Sea
201802
222598
-20796
264253
-62451
(7) Greenland_Sea
444260
578046
-133786
574726
-130465
(8) Baffin_Bay_Gulf_of_St._Lawrence
763976
741257
22719
778469
-14493
(9) Canadian_Archipelago
808464
798083
10381
781578
26886
(10) Hudson_Bay
1063014
1014784
48230
997061
65953
(11) Central_Arctic
3165771
3224235
-58464
3224700
-58929
(12) Bering_Sea
8803
42373
-33570
15285
-6482
(13) Baltic_Sea
0
7
-7
0
0
(14) Sea_of_Okhotsk
11757
42495
-30738
31131
-19373
Note that Bering and Okhotsk account for the 2018 deficit to average. Chukchi, Laptev and Greenland Seas are down somewhat, but offset by surpluses in Kara Sea, Beaufort Sea and Hudson Bay. The differences from 2007 are similar.
The Pacific basins of Bering and Okhotsk are the first to lose ice, and it will be interesting to see how the core Arctic Seas holds up this summer. Chukchi is down, perhaps influenced by the early melting in Bering, but is offset by surpluses in Beaufort and East Siberian.
Special snow goggles for protection in polar landscapes.
Someone triggered Antarctica for this week’s media alarm blitz.
Antarctic ice loss increases to 200 billion tonnes a year– Climate Action
Antarctica is now melting three times faster than ever before– Euronews
Antarctica is shedding ice at an accelerating rate– Digital Journal
Al Gore Sounds the Alarm on 0.3 inches of Sea Level Rise from Ice Sheets– Daily Caller
Antarctica is losing an insane amount of ice. Nothing about this is good. – Fox News Looks like it’s time yet again to play Climate Whack-A-Mole. That means stepping back to get some perspective on the reports and the interpretations applied by those invested in alarmism.
Antarctic Basics
The Antarctic Ice Sheet extends almost 14 million square kilometers (5.4 million square miles), roughly the area of the contiguous United States and Mexico combined. The Antarctic Ice Sheet contains 30 million cubic kilometers (7.2 million cubic miles) of ice. (Source: NSIDC: Quick Facts Ice Sheets)
The Antarctic Ice Sheet covers an area larger than the U.S. and Mexico combined. This photo shows Mt. Erebus rising above the ice-covered continent. Credit: Ted Scambos & Rob Bauer, NSIDC
The study of ice sheet mass balance underwent two major advances, one during the early 1990s, and again early in the 2000s. At the beginning of the 1990s, scientists were unsure of the sign (positive or negative) of the mass balance of Greenland or Antarctica, and knew only that it could not be changing rapidly relative to the size of the ice sheet.
Advances in glacier ice flow mapping using repeat satellite images, and later using interferometric synthetic aperture radar SAR methods, facilitated the mass budget approach, although this still requires an estimate of snow input and a cross-section of the glacier as it flows out from the continent and becomes floating ice. Satellite radar altimetry mapping and change detection, developed in the early to mid-1990s allowed the research community to finally extract reliable quantitative information regarding the overall growth or reduction of the volume of the ice sheets.
By 2002, publications were able to report that both large ice sheets were losing mass (Rignot and Thomas 2002). Then in 2003 the launch of two new satellites, ICESat and GRACE, led to vast improvements in one of the methods for mass balance determination, volume change, and introduced the ability to conduct gravimetric measurements of ice sheet mass over time. The gravimetric method helped to resolve remaining questions about how and where the ice sheets were losing mass. With this third method, and with continued evolution of mass budget and geodetic methods it was shown that the ice sheets were in fact losing mass at an accelerating rate by the end of the 2000s (Veliconga 2009, Rignot et al. 2011b).
A new 2015 NASA study says that an increase in Antarctic snow accumulation that began 10,000 years ago is currently adding enough ice to the continent to outweigh the increased losses from its thinning glaciers.
The research challenges the conclusions of other studies, including the Intergovernmental Panel on Climate Change’s (IPCC) 2013 report, which says that Antarctica is overall losing land ice.
According to the new analysis of satellite data, the Antarctic ice sheet showed a net gain of 112 billion tons of ice a year from 1992 to 2001. That net gain slowed to 82 billion tons of ice per year between 2003 and 2008.
“We’re essentially in agreement with other studies that show an increase in ice discharge in the Antarctic Peninsula and the Thwaites and Pine Island region of West Antarctica,” said Jay Zwally, a glaciologist with NASA Goddard Space Flight Center in Greenbelt, Maryland, and lead author of the study, which was published on Oct. 30 in the Journal of Glaciology. “Our main disagreement is for East Antarctica and the interior of West Antarctica – there, we see an ice gain that exceeds the losses in the other areas.” Zwally added that his team “measured small height changes over large areas, as well as the large changes observed over smaller areas.”
Scientists calculate how much the ice sheet is growing or shrinking from the changes in surface height that are measured by the satellite altimeters. In locations where the amount of new snowfall accumulating on an ice sheet is not equal to the ice flow downward and outward to the ocean, the surface height changes and the ice-sheet mass grows or shrinks.
Snow covering Antarctic peninsula.
Keeping Things in Perspective
Such reports often include scary graphs like this one and the reader is usually provided no frame of reference or context to interpret the image. First, the chart is showing cumulative loss of mass arising from an average rate of 100 Gt lost per year since 2002. Many years had gains, including 2002, and the cumulative loss went below zero only in 2006. Also, various methods of measuring and analyzing give different results, as indicated by the earlier section.
Most important is understanding the fluxes in proportion to the Antarctic Ice Sheet. Let’s do the math. Above it was stated Antarctica contains ~30 million cubic kilometers of ice volume. One km3 of water is 1 billion cubic meters and weighs 1 billion tonnes, or 1 gigatonne. So Antarctica has about 30,000,000 gigatonnes of ice. Since ice is slightly less dense than water, the total should be adjusted by 0.92 for an estimate of 27.6 M Gts of ice comprising the Antarctic Ice Sheet.
So in the recent decade, an average year went from 27,600,100 Gt to 27,600,000, according to one analysis. Other studies range from losing 200 Gt/yr to gaining 100 Gt/yr.
Even if Antarctica lost 200 Gt/yr. for the next 1000 years, it would only approach 1% of the ice sheet.
If like Al Gore you are concerned about sea level rise, that calculation starts with the ocean area estimated to be 3.618 x 10^8 km2 (361,800,000 km2). To raise that area 1 mm requires 3.618×10^2 km3 or 361.8 km3 water (1 km3 water=1 Gt.) So 200 Gt./yr is about 0.55mm/yr or 6 mm a decade, or 6 cm/century.
By all means let’s pay attention to things changing in our world, but let’s also notice the scale of the reality and not make mountains out of molehills.
Let’s also respect the scientists who study glaciers and their subtle movements over time (“glacial pace”). Below is an amazing video showing the challenges and the beauty of working on Greenland Glacier.
Hydraulic fracturing (AKA “fracking”) is in the news every day, and often in a disparaging way, despite the great benefits bestowed on nations applying the process, especially the US.
On a recent river cruise I found myself at a table with a couple from California, and the woman began spouting about the dangers and horribleness of fracking. My civility censor was suppressed by the wine I’d consumed, and I interrupted to say she was talking Bullshit. She halted, then asked her husband, a retired geologist, to comment, and he stated that fracking is a risky business. The geologist husband did not present any evidence for his view, IMO he was only speaking to support his spouse. I said I respected his opinion but still disagreed. The next day I apologized for my rudeness but said I still think she has been misled. We shared a congenial dinner later on, but avoided the subject.
The experience revealed I had been unprepared to engage on the details of the fracking issue. So this post is to summarize some research to assemble persuasive facts and resources to counter the fear mongering on this subject.
Originated at treehugger.com.
1.Obama’s EPA Found Fracking Has Not Contaminated Drinking Water
First, let me provide a bit of background on hydraulic fracturing. I find that most people who are against fracking don’t actually know what it is. The EPA report goes out of its way to blur the lines as well by lumping it all into “activities in the hydraulic fracturing water cycle.” By doing this, if a guy driving a truck filled with fracking chemicals has a wreck, it’s a “fracking issue.” So let’s define some terms.
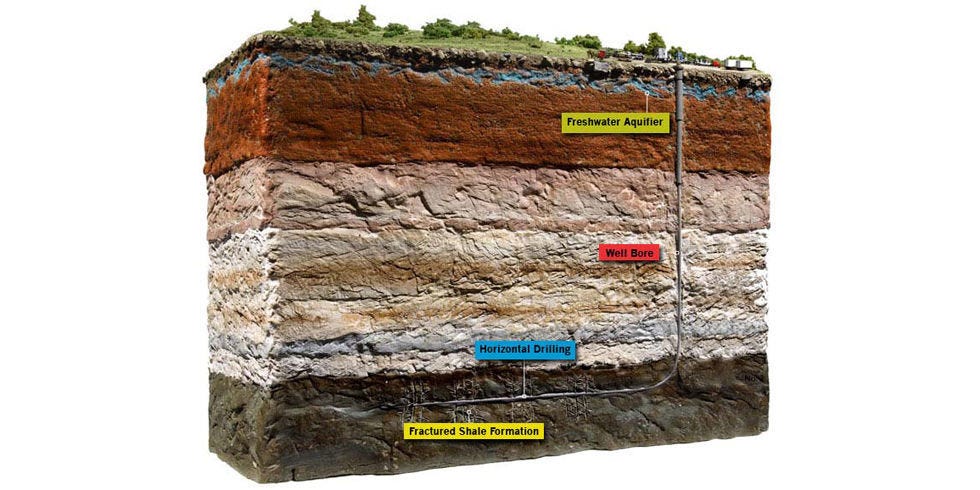
Hydraulic fracturing has been around since the late 1940s, and has now been used in the U.S. more than a million times to increase production from oil and gas wells. Fracking involves pumping water, chemicals and a proppant down an oil or gas well under high pressure to break open channels (fractures) in the reservoir rock trapping the deposit. Oil and gas do not travel easily through these some formations, which is why they need to be fractured. The proppant is a granular material (usually sand) designed to hold those channels open, allowing the oil (or natural gas) to flow to the well bore. While fracking has been around for decades, two developments in recent years are responsible for thrusting the technique into the public eye. The first is the fairly recent development in which fracking was combined with horizontal drilling, another common technique used in the oil and gas industry.
Like fracking, horizontal drilling was invented decades ago, and has been widely used in the oil and gas industry since the 1980s. As its name implies, horizontal drilling involves drilling down to an oil or gas deposit and then turning the drill horizontal to the formation to access a greater fraction of the deposit.
The marriage of these two techniques of hydraulic fracturing and horizontal drilling enabled the shale oil and gas boom in the U.S.
But the second development is what primarily thrust the technique(s) into the public spotlight. Some of the shale oil and gas formations are in areas that had never experienced significant fossil fuel development. Many locals resented this intrusion into their lives, and anti-fracking sentiments fed into a great deal of misinformation around the technique.
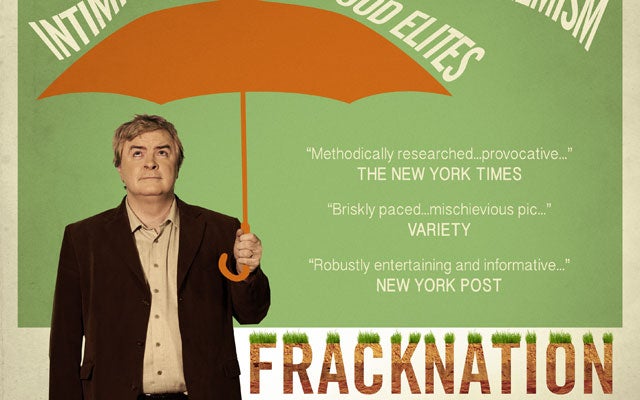
The movie Gasland is a perfect example. Director Josh Fox, whose family farm lies atop the Marcellus Shale in Pennsylvania, relied on misinformation and appeals to emotion instead of scientific data. Nevertheless, it was embraced by anti-fracking activists, and many who had never heard of fracking became convinced the technique was regularly polluting water supplies.
The concern among anti-fracking activists was that the fractures that allowed oil and gas to reach the well bore could also allow oil, gas, and chemicals to seep into the water supplies. But the reason this is a remote possibility is that a mile or more of rock will separate an oil and gas formation that is being fractured and an underground water resource. The fractures themselves extend for a few hundred feet, thus unsurprisingly there has never been a proven case where chemicals migrated from a fracked zone into water supplies.
That hasn’t stopped some from claiming that fracking has contaminated water supplies. However, those cases have always been a result of some activity peripheral to fracking. For example, if a well is improperly cemented it can leak. That in fact has happened, leading to the charge that “fracking contaminated the water.” There is an important distinction, however, and that is that this is not a result of the fracking process. A well may leak regardless of whether it was fracked. But activists (and now the EPA) seem bent on blurring the lines to the greatest extent possible by lumping lots of peripheral activities into the “fracking process.”
In 2010, Congress asked the EPA to investigate the safety of fracking. In 2015, the EPA issued a draft report. The bombshell statement from that report was that there was no evidence that fracking had “led to widespread, systemic impacts on drinking water resources in the United States.” This report was cheered by the fossil fuel industry, but caused a backlash with environmentalists, and spawned many counterclaims that the “fracking process” had led to contaminated water.
In December 2016 the EPA released its final report on the topic: Hydraulic Fracturing for Oil and Gas: Impacts from the Hydraulic Fracturing Water Cycle on Drinking Water Resources in the United States. Environmentalists were quick to note that the EPA had deleted its previous claim of no evidence of widespread water contamination, and were now reporting that “hydraulic fracturing activities can impact drinking water resources under some circumstances.” This story from The New York Times, for instance, was pretty typical of the reporting on the issue: Reversing Course, E.P.A. Says Fracking Can Contaminate Drinking Water.
But did the EPA actually reverse course? No. They gave examples where fracking could contaminate water. For instance they state that “Injection of hydraulic fracturing fluids directly into groundwater resources” can cause contamination. Yeah, no joke. Likewise, filling your car with gasoline can contaminate drinking water, because if you spill the gasoline all over the ground, it can get into the drinking water.
The EPA’s final report on hydraulic fracturing wasn’t that much different from the draft report. As in the previous report, the EPA noted that activities related to — but not exclusive to — fracking, have contaminated water supplies. Chemical spills happen all the time, but if the chemicals in question are for fracking, it becomes a “fracking issue.” Note that if the chemicals in question are to be used for fighting fires, we don’t say “firefighting contaminates water.” We should properly identify and address the actual problem, which in this instance would be the cause of the chemical spill.
Ultimately, the final report deleted a phrase from the draft report that there was no evidence of widespread impact on water supplies, and selectively used hypotheticals to show how fracking “could” contaminate water supplies. This is the Obama Administration laying down one more speed bump for the oil and gas industry while it still can.
A new Environment America “report” uses a couple old anti-fracking tactics — exploitation of children and blatant misinformation from activist studies — to try to stoke fears and rally support for its extremist call to ban fracking nationwide.
The ominously-titled “Dangerous and Close: Fracking Puts the Nation’s Most Vulnerable People at Risk” finds there are nearly 2,000 child care facilities, better than 1,300 schools, nearly 250 nursing care providers and more than 100 hospitals within a one-mile radius of fracked wells in the nine states examined, stating:
“Given the scale and severity of fracking’s impacts, fracking should be prohibited wherever possible and existing wells should be shut down beginning with those near institutions that serve our most vulnerable populations.”
Here are the report’s most egregious claims, followed by the facts.
Environment America Claim: “Fracking creates a range of threats to our health, including creating toxic air pollution that can reduce lung function even among healthy people, trigger asthma attacks, and has been linked to premature death. Children and the elderly are especially vulnerable to fracking’s health risks.”
A pumpjack works in the Bakken shale of North Dakota.
REALITY: There is actually ample evidence that fracking is improving overall air quality and health by reducing major pollutants such as fine particulate matter, sulfur dioxide and nitrogen dioxide. Furthermore, all three studies EA singles out as “evidence” close proximity to fracking sites can lead to the myriad of adverse health effects have been thoroughly debunked.
EA even cites an Earthworks study that claims “A series of 2012 measurements by officials of the Texas Commission on Environmental Quality (TCEQ) found VOCs levels so high at one fracking location that the officials themselves were forced to stop taking measurements and leave the site because it was too dangerous for them to remain.”
EA fails to mention TCEQ responded to Earthworks’ report by saying the agency has collected “several millions of data points for volatile organic compounds” in the Barnett Shale and Eagle Ford Shale and “Overall, the monitoring data provide evidence that shale play activity does not significantly impact air quality or pose a threat to human health.”
EA also conveniently ignores that the West Virginia Department of Environmental Protection (DEP) and the Colorado Department of Public Health (CDPH) have conducted air monitoring near well sites as well and found no credible risk to public health.
Environment America Claim: “Currently, oil and gas companies are exempt from key provisions in the Safe Drinking Water Act, the Clean Air Act, the Clean Water Act, and the Resource Conservation and Recovery Act.”
REALITY: The notion that the oil and natural gas industry is under-regulated is absolutely absurd narrative activists such as EA continue to push. Oil and gas production activities are subject to eight federal laws: including all relevant provisions of the Safe Drinking Water Act (SDWA); Clean Water Act (CWA); Clean Air Act (CAA); Resources Conservation and Recovery Act (RCRA); Comprehensive Environmental Response, Compensation, and Liability Act (CERCLA); the EPCRA; Toxic Substances Control Act (TSCA); and Federal Insecticide, Fungicide and Rodenticide Act (FIFRA). Additionally, the oil and gas production sector is also heavily regulated at the state level.
A drilling rig works in the Eagle Ford shale, South Texas region.
Environment America Claim: “Exposure to low levels of many of the chemicals used in or generated by oil and gas extraction activities can contribute to a variety of health effects, including asthma, cancer, birth defects, damage to the reproductive system and impaired brain development. For example, children’s long-term exposure to low levels of benzene, generally classified as a carcinogen, also harms respiratory health.”
REALITY: It is essential to understand that toxicity is completely dependent on dose level and exposure. The mere presence of benzene, for example, does not mean that it is present in toxic levels, as the numerous studies air monitoring studies referred to earlier illustrate. EA insinuates that even low-level benzene exposure is harmful. But benzene is actually present in countless everyday products such as shampoo, tooth paste, paint, PVC pipes and countless plastic products.
Environment America Claim: “Fracking targets the oil and gas trapped in shale formations… Sometimes that means wells are drilled in rural areas, such as portions of Colorado or North Dakota, and sometimes that wells are in densely populated areas, such as Los Angeles…”
REALITY: There are no fracking or unconventional oil production operations in the city of Los Angeles — none. EA attempts to justify this claim by employing the common activist tactic of expanding the definition of fracking to encompass all oil and gas related activity:
“Throughout this report, we refer to “fracking” as including all of the activities needed to bring a well into production using high-volume hydraulic fracturing. This includes drilling the well, operating that well, processing the gas or oil produced from that well, and delivering the gas or oil to market. The oil and gas industry often uses a more restrictive definition of “fracking” that includes only the actual moment in the extraction process when rock is fractured – a definition that obscures the broad changes to environmental, health and community conditions that result from the use of high-volume hydraulic fracturing in oil and gas extraction.”
Fracking is not used as a completion technique at any of the urban drill sites in the city. All of the facilities recover oil through traditional water flood operations. The report’s attempt to shoehorn fracking and unconventional production into its report proves that it is not engaged in an honest attempt to inform the public.
Environment America Claim: “Because of the health hazard created by radon, Pennsylvania has a long record of radon measurements in homes. An analysis of those radon measurements by researchers at Johns Hopkins School of Public Health found that radon levels have increased in counties with extensive fracking since 2004, and also found elevated radon levels on the first floor of houses located within 12.5 miles of a fracked well.”
REALITY: The Johns Hopkins study EA is referring to actually found the highest concentrations of radon were in areas with no shale development and direct sampling found radon not linked to fracking. As is the case with so many of the studies EA uses as evidence, the authors merely speculated fracking was the cause.
Environment America Claim: “Oil and gas production at fracked wells releases volatile organic compounds and nitrogen oxides that contribute to the formation of smog.”
REALITY: Oil and gas production is not a major contributor to ground-level ozone.
As EID has emphasized before, publicly available information demonstrates oil and gas production is not the significant contributor to ozone levels. Vehicle exhaust adds far more non-methane volatile organic compounds (NMVOCs) and nitrogen oxides (NOx) — both precursors to ground-level ozone — to the atmosphere than oil and gas production, as data from the EPA’s 2016 Greenhouse Gas Inventory clearly demonstrates.
Not only do oil and gas activities account for just six percent of total NOx emissions, which play more of a role in ground-level formation than VOCs, another recent NOAA report found that “The increased use of natural gas has…led to emissions reductions of NOx (40%) and SO2 (44%).”
Environment America Claim: “Contaminants can reach water supplies through faulty well construction, through surface spills, through improper wastewater disposal, or potentially through migration from the shale layer itself.”
REALITY: The EPA’s landmark five-year study confirmed, “hydraulic fracturing activities have not led to widespread, systemic impacts to drinking water resources,” and at least 15 other studies say the fracking process, specifically, have not contaminated groundwater.
Conclusion
EA’s claims in this report — aimed at generating headlines — are quite profound.
“Schools and day care centers should be safe places for kids to play and learn,” said Rachel Richardson, director of Environment America’s Stop Drilling program and co-author of the report. “Unfortunately our research shows far too many kids may be exposed to dirty air and toxic chemicals from fracking right next door.”
The problem is EA’s “research” merely found that there are some schools, nursing homes and hospitals near oil and natural gas development. It made no effort to collect its own data to support their claim that this is leading to adverse health effects.
Instead, it relied on long-debunked studies and tired fear tactics. Maybe that’s why the report’s hyperbolic claim that it “serves as a reminder of the unacceptable dangers of fracking, its potential to harm, and the need to bring this risky form of drilling to an end” was virtually ignored by the media.
3. Extensive research Study Found No link between groundwater pollution and fracking.
(Source: National Science Foundation and Duke University study summarized by Jeffrey Folks for American Thinker The science is settled, fracking is safe.)
Among the 130 wells studied, the researchers found only a subset of cases, including seven in Pennsylvania and one in Texas, in which faulty well construction or cementing was to blame for the seepage of gases into groundwater. According to Professor Avner Bengosh of Duke University, “[t]hese results appear to rule out the migration of methane up into drinking water aquifers from depth because of horizontal drilling or hydraulic fracturing.” That is to say, in the rare cases where it occurs, gases are entering the water supply from outside the borehead as a result of faulty well construction or poor cementing, both of which are manageable problems.
While the new report answers the most important question, proving beyond doubt that fracking itself does not cause gas to seep into the water supply, it does not address several other important questions. One of these is the frequency of contamination of water supplies by naturally occurring petroleum, methane, and other gases.
Natural pollution of this kind would seem to be extremely common, and in fact this natural process has been known for millennia. At sites where petroleum seeped to the surface, as in the vicinity of the 19th-century Drake oil field in Pennsylvania, Native Americans had made use of the oily substance as a lubricant for hundreds if not thousands of years. That oil, flowing naturally to the surface, was “contaminating” nearby streams and groundwater.
What humans add to natural emisions as a result of drilling is so minor as to be of little consequence. If some future study confirmed this fact, it would help to counter the myth that oil and gas drilling is polluting an otherwise pure land and sea environment. The reality is that wherever shale and other carbon-rich formations occur, natural leakage of petroleum and/or methane is inevitable. Oil and gas are naturally occurring features that are constantly interacting with the environment and entering the water supply through natural processes. As is so often the case, the idea that there once existed an environment free of all that modern intellectuals might consider unpleasant is simply a fantasy.
The NSF/Duke report is crucial to the debate over the safety of hydraulic fracturing. The oil and gas industry has already achieved a near perfect safety record, given the handful of failed wells in proportion to more than one million that have been fracked. The industry needs to continue working to achieve certainty that wells do not fail. It also needs to do a better job of communicating its intention to do so to a skeptical public.
Members of Congress, gas companies, news organization, drilling opponents: They’ve all made bold claims about hydraulic fracturing (fracking) and the U.S. supply of underground natural gas. We take on 10 controversial quotes about natural gas and set the record straight.
WE ARE THE SAUDI ARABIA OF NATURAL GAS.” SEN. JOHN KERRY, D-MASS., MAY 2010
Less than a decade ago, industry analysts and government officials fretted that the United States was in danger of running out of gas. No more. Over the past several years, vast caches of natural gas trapped in deeply buried rock have been made accessible by advances in two key technologies: horizontal drilling, which allows vertical wells to turn and snake more than a mile sideways through the earth, and hydraulic fracturing, or fracking. Developed more than 60 years ago, fracking involves pumping millions of gallons of chemically treated water into deep shale formations at pressures of 9000 pounds per square inch or more. This fluid cracks the shale or widens existing cracks, freeing hydrocarbons to flow toward the well.
These advances have led to an eightfold increase in shale gas production over the past decade. According to the Energy Information Administration, shale gas will account for nearly half of the natural gas produced in the U.S. by 2035. But the bonanza is not without controversy, and nowhere, perhaps, has the dispute over fracking grown more heated than in the vicinity of the Marcellus Shale. According to Terry Engelder, a professor of geosciences at Penn State, the vast formation sprawling primarily beneath West Virginia, Pennsylvania and New York could produce an estimated 493 trillion cubic feet of gas over its 50- to 100-year life span. That’s nowhere close to Saudi Arabia’s total energy reserves, but it is enough to power every natural gas—burning device in the country for more than 20 years. The debate over the Marcellus Shale will shape national energy policy—including how fully, and at what cost, we exploit this vast resource.
HYDRAULIC FRACTURING SQUANDERS OUR PRECIOUS WATER RESOURCES.” Green Party of Pennsylvania, April 2011
There is no question that hydraulic fracturing uses a lot of water: It can take up to 7 million gallons to frack a single well, and at least 30 percent of that water is lost forever, after being trapped deep in the shale. And while there is some evidence that fracking has contributed to the depletion of water supplies in drought-stricken Texas, a study by Carnegie Mellon University indicates the Marcellus region has plenty of water and, in most cases, an adequate system to regulate its usage. The amount of water required to drill all 2916 of the Marcellus wells permitted in Pennsylvania in the first 11 months of 2010 would equal the amount of drinking water used by just one city, Pittsburgh, during the same period, says environmental engineering professor Jeanne VanBriesen, the study’s lead author. Plus, she notes, water withdrawals of this new industry are taking the place of water once used by industries, like steel manufacturing, that the state has lost. Hydrogeologist David Yoxtheimer of Penn State’s Marcellus Center for Outreach and Research gives the withdrawals more context: Of the 9.5 billion gallons of water used daily in Pennsylvania, natural gas development consumes 1.9 million gallons a day (mgd); livestock use 62 mgd; mining, 96 mgd; and industry, 770 mgd.
“NATURAL GAS IS CLEANER, CHEAPER, DOMESTIC, AND IT’S VIABLE NOW.” OILMAN TURNED NATURAL-GAS CHEERLEADER T. BOONE PICKENS, SEPTEMBER 2009
Burning natural gas is cleaner than oil or gasoline, and it emits half as much carbon dioxide, less than one-third the nitrogen oxides, and 1 percent as much sulfur oxides as coal combustion. But not all shale gas makes it to the fuel tank or power plant. The methane that escapes during the drilling process, and later as the fuel is shipped via pipelines, is a significant greenhouse gas. At least one scientist, Robert Howarth at Cornell University, has calculated that methane losses could be as high as 8 percent. Industry officials concede that they could be losing anywhere between 1 and 3 percent. Some of those leaks can be prevented by aggressively sealing condensers, pipelines and wellheads. But there’s another upstream factor to consider: Drilling is an energy-intensive business. It relies on diesel engines and generators running around the clock to power rigs, and heavy trucks making hundreds of trips to drill sites before a well is completed. Those in the industry say there’s a solution at hand to lower emissions—using natural gas itself to power the process. So far, however, few companies have done that.
“[THERE’S] NEVER BEEN ONE CASE—DOCUMENTED CASE—OF GROUNDWATER CONTAMINATION IN THE HISTORY OF THE THOUSANDS AND THOUSANDS OF HYDRAULIC FRACTURING [WELLS]” SEN. JAMES INHOFE, R-OKLA., APRIL 2011
The senator is incorrect. In the past two years alone, a series of surface spills, including two blowouts at wells operated by Chesapeake Energy and EOG Resources and a spill of 8000 gallons of fracking fluid at a site in Dimock, Pa., have contaminated groundwater in the Marcellus Shale region. But the idea stressed by fracking critics that deep-injected fluids will migrate into groundwater is mostly false. Basic geology prevents such contamination from starting below ground. A fracture caused by the drilling process would have to extend through the several thousand feet of rock that separate deep shale gas deposits from freshwater aquifers. According to geologist Gary Lash of the State University of New York at Fredonia, the intervening layers of rock have distinct mechanical properties that would prevent the fissures from expanding a mile or more toward the surface. It would be like stacking a dozen bricks on top of each other, he says, and expecting a crack in the bottom brick to extend all the way to the top one. What’s more, the fracking fluid itself, thickened with additives, is too dense to ascend upward through such a channel. EPA officials are closely watching one place for evidence otherwise: tiny Pavillion, Wyo., a remote town of 160 where high levels of chemicals linked to fracking have been found in groundwater supplies. Pavillion’s aquifer sits several hundred feet above the gas cache, far closer than aquifers atop other gas fields. If the investigation documents the first case of fracking fluid seeping into groundwater directly from gas wells, drillers may be forced to abandon shallow deposits—which wouldn’t affect Marcellus wells.
“THE GAS ERA IS COMING, AND THE LANDSCAPE NORTH AND WEST OF [NEW YORK CITY] WILL INEVITABLY BE TRANSFORMED AS A RESULT. WHEN THE VALVES START OPENING NEXT YEAR, A LOT OF POOR FARM FOLK MAY BECOME TEXAS RICH. AND A LOT OF OTHER PEOPLE—ESPECIALLY THE ECOSENSITIVE NEW YORK CITY CROWD THAT HAS SETTLED AMONG THEM—WILL BE APOPLECTIC AS THEIR PRISTINE WEEKEND SANCTUARY IS CONVERTED INTO AN INDUSTRIAL ZONE, CRISSCROSSED WITH DRILL PADS, PIPELINES, AND ACCESS ROADS.” New York magazine, Sept. 21, 2008
Much of the political opposition to fracking has focused on the Catskill region, headwaters of the Delaware River and the source of most of New York City’s drinking water. But the expected boom never happened—there’s not enough gas in the watershed to make drilling worthwhile. “No one has to get excited about contaminated New York City drinking water,” Penn State’s Engelder told the Times Herald-Record of Middletown, N.Y., in April. The shale is so close to the surface that it’s not concentrated in large enough quantities to make recovering it economically feasible. But just to the west, natural gas development is dramatically changing the landscape. Drilling rigs are running around the clock in western Pennsylvania. Though buoyed by the economic windfall, residents fear that regulators can’t keep up with the pace of development. “It’s going to be hard to freeze-frame and say, ‘Let’s slow down,’?” Sen. Robert P. Casey Jr., D-Pa., said last fall. “That makes it more difficult for folks like us, who say we want to create the jobs and opportunity in the new industry, but we don’t want to do it at the expense of water quality and quality of life.”
“NATURAL GAS IS AFFORDABLE, ABUNDANT AND AMERICAN. IT COSTS ONE-THIRD LESS TO FILL UP WITH NATURAL GAS THAN TRADITIONAL GASOLINE.” REP. JOHN LARSON, D-CONN., CO-SPONSOR OF H.R. 1380, A MEASURE THAT WOULD PROVIDE TAX INCENTIVES FOR THE DEVELOPMENT AND PURCHASE OF NATURAL GAS VEHICLES, MARCH 2011
That may be true. Plus, there’s another incentive: Vehicles powered by liquefied natural gas, propane or compressed natural gas run cleaner than cars with either gasoline or diesel in the tank. According to the Department of Energy, if the transportation sector switched to natural gas, it would cut the nation’s carbon-monoxide emissions by at least 90 percent, carbon-dioxide emissions by 25 and nitrogen-oxide emissions by up to 60. But it’s not realistic: Nationwide, there are only about 3500 service stations (out of 120,000) that offer natural gas—based automotive fuel, and it would cost billions of dollars and take years to develop sufficient infrastructure to make that fuel competitive with gasoline or diesel. And only Honda makes a car that can run on natural gas. That doesn’t mean natural gas has no role in meeting the nation’s short-term transportation needs. In fact, buses in several cities now rely on it, getting around the lack of widespread refueling opportunities by returning to a central terminal for a fill-up. The same could be done for local truck fleets. But perhaps the biggest contribution natural gas could make to America’s transportation picture would be more indirect—as a fuel for electric-generation plants that will power the increasingly popular plug-in hybrid vehicles.
“DO NOT DRINK THIS WATER” HANDWRITTEN SIGN IN THE DOCUMENTARY GASLAND, 2010
It’s an iconic image, captured in the 2010 Academy Award—nominated documentary GasLand. A Colorado man holds a flame to his kitchen faucet and turns on the water. The pipes rattle and hiss, and suddenly a ball of fire erupts. It appears a damning indictment of the gas drilling nearby. But Colorado officials determined the gas wells weren’t to blame; instead, the homeowner’s own water well had been drilled into a naturally occurring pocket of methane. Nonetheless, up to 50 layers of natural gas can occur between the surface and deep shale formations, and methane from these shallow deposits has intruded on groundwater near fracking sites. In May, Pennsylvania officials fined Chesapeake Energy $1 million for contaminating the water supplies of 16 families in Bradford County. Because the company had not properly cemented its boreholes, gas migrated up along the outside of the well, between the rock and steel casing, into aquifers. The problem can be corrected by using stronger cement and processing casings to create a better bond, ensuring an impermeable seal.
“AS NEW YORK GEARS UP FOR A MASSIVE EXPANSION OF GAS DRILLING IN THE MARCELLUS SHALE, STATE OFFICIALS HAVE MADE A POTENTIALLY TROUBLING DISCOVERY ABOUT THE WASTEWATER CREATED BY THE PROCESS: IT’S RADIOACTIVE.” ProPublica, November 2009
Shale has a radioactive signature—from uranium isotopes such as radium-226 and radium-228—that geologists and drillers often measure to chart the vast underground formations. The higher the radiation levels, the greater the likelihood those deposits will yield significant amounts of gas. But that does not necessarily mean the radioactivity poses a public health hazard; after all, some homes in Pennsylvania and New York have been built directly on Marcellus shale. Tests conducted earlier this year in Pennsylvania waterways that had received treated water—both produced water (the fracking fluid that returns to the surface) and brine (naturally occurring water that contains radioactive elements, as well as other toxins and heavy metals from the shale)—found no evidence of elevated radiation levels. Conrad Dan Volz, former scientific director of the Center for Healthy Environments and Communities at the University of Pittsburgh, is a vocal critic of the speed with which the Marcellus is being developed—but even he says that radioactivity is probably one of the least pressing issues. “If I were to bet on this, I’d bet that it’s not going to be a problem,” he says.
“CLAIMING THAT THE INFORMATION IS PROPRIETARY, DRILLING COMPANIES HAVE STILL NOT COME OUT AND FULLY DISCLOSED WHAT FRACKING FLUID IS MADE OF.” Vanity Fair, June 2010
Under mounting pressure, companies such as Schlumberger and Range Resources have posted the chemical compounds used in some of their wells, and in June, Texas became the first state to pass a law requiring full public disclosure. This greater transparency has revealed some oddly benign ingredients, such as instant coffee and walnut shells—but also some known and suspected carcinogens, including benzene and methanol. Even if these chemicals can be found under kitchen sinks, as industry points out, they’re poured down wells in much greater volumes: about 5000 gallons of additives for every 1 million gallons of water and sand. A more pressing question is what to do with this fluid once it rises back to the surface. In Texas’s Barnett Shale, wastewater can be reinjected into impermeable rock 1.5 miles below ground. This isn’t feasible in the Marcellus Shale region; the underlying rocks are not porous enough. Currently, a handful of facilities in Pennsylvania are approved to treat the wastewater. More plants, purpose-built for the task, are planned. In the meantime, most companies now recycle this water to drill their next well.
“THE INCREASING ABUNDANCE OF CHEAP NATURAL GAS, COUPLED WITH RISING DEMAND FOR THE FUEL FROM CHINA AND THE FALL-OUT FROM THE FUKUSHIMA NUCLEAR DISASTER IN JAPAN, MAY HAVE SET THE STAGE FOR A ‘GOLDEN AGE OF GAS.” WALL STREET JOURNAL SUMMARIZING AN INTERNATIONAL ENERGY AGENCY REPORT, JUNE 6, 2011
There’s little question that the United States, with 110 years’ worth of natural gas (at the 2009 rate of consumption), is destined to play a major role in the fuel’s development. But even its most ardent supporters, men like T. Boone Pickens, concede that it should be a bridge fuel between more polluting fossil fuels and cleaner, renewable energy. In the meantime, the U.S. should continue to invest in solar and wind, conserve power and implement energy-efficient technology. Whether we can effectively manage our natural gas resource while developing next-gen sources remains to be seen. Margie Tatro, director of fuel and water systems at Sandia National Laboratories, says, “I think natural gas is a transitioning fuel for the electricity sector until we can get a greater percentage of nuclear and renewables on the grid.”
The United States has made massive improvements in air quality over the past decade and study after study has shown that the increased use of natural gas for electricity generation – made possible by the shale revolution – is the reason we’ve achieved this feat.
This progress is the centerpiece of Energy In Depth’s new report – Compendium of Studies Demonstrating the Safety and Health Benefits of Fracking – which includes data from 23 peer-reviewed studies, 17 government health and regulatory agencies and reports from 10 research institutions that clearly demonstrate: • Increased natural gas use — thanks to hydraulic fracturing —has led to dramatic declines in air pollution. The United States is the number one oil and gas producer in the world and it has some of the lowest death rates from air pollution in the world. Numerous studies have shown that pollution has plummeted as natural gas production has soared. • Emissions from well sites and associated infrastructure are below thresholds regulatory authorities consider to be a threat to public health – that’s the conclusion of multiple studies using air monitors that measure emissions directly. • There is no credible evidence that fracking causes or exacerbates asthma. In fact, asthma rates and asthma hospitalizations across the United States have declined as natural gas production has ramped up. • There is no credible evidence that fracking causes cancer. Studies that have directly measured emissions at fracking sites have found emissions are below the threshold that would be harmful to public health. • There is no credible evidence that fracking leads to adverse birth outcomes. In fact, adverse birth outcomes have decreased while life expectancy has increased in areas that are ramping up natural gas use. • Fracking is not a credible threat to groundwater. Study after study has shown that there are no widespread, systemic impacts to drinking water from hydraulic fracturing. It is well known that the shale revolution has been a boon to our nation’s economy, its geopolitical position, and the millions of consumers and manufacturers who continue to benefit from historically low energy costs. But the case in support of shale’s salubrious effect on air quality and health continues to be an underreported phenomenon – this new report puts the health benefits of our increased use of natural gas in the spotlight.
Conclusion To be clear, no form of energy development, whether we’re talking about fossil fuels or renewables, is risk free. But the data clearly show, time and time again, that emissions from fracking are not a credible risk to public health.
In fact, the data show that enormous reductions in pollution across the board are attributable to the significant increases in natural gas consumption that hydraulic fracturing has made possible.
They show power plant emissions of SO2 declining by 86 percent, emissions of NOx declining by 67 percent, and emissions of mercury by 55 percent. They also show hospitalizations for asthma declining as natural gas ramps up. At the same time life expectancy and birth outcomes have improved.
And, of course, all these positive health outcomes can be largely traced back to significantly cleaner air, thanks to fracking.
A man who has not been a socialist before 25 has no heart. If he remains one after 25 he has no head.—King Oscar II of Sweden
H/T to American Elephants for linking to this Jordan Peterson video: The Fatal Flaw in Leftist Thought. He has an outstanding balance between head and heart, and also applies scientific analysis to issues, in this case the problem of identity politics and leftist ideology.
As usual Peterson makes many persuasive points in this talk. I was struck by his point that we have established the boundary of extremism on the right, but no such boundary exists on the left. Our society rejects right wingers who cross the line and assert racial superiority. Conservative voices condemn that position along with the rest.
We know from the Soviet excesses that the left can go too far, but what is the marker? Left wingers have the responsibility to set the boundary and sanction the extremists. Peterson suggests that the fatal flaw is the attempt to ensure equality of outcomes for identity groups, and explains why that campaign is impossible.
From Previous Post on Head, Heart and Science
Recently I had an interchange with a friend from high school days, and he got quite upset with this video by Richard Lindzen. So much so, that he looked up attack pieces in order to dismiss Lindzen as a source. This experience impressed some things upon me.
Climate Change is Now Mostly a Political Football (at least in USA)
My friend attributed his ill humor to the current political environment. He readily bought into slanderous claims, and references to being bought and paid for by the Koch brothers. At this point, Bernie and Hilliary only disagree about who is the truest believer in Global Warming. Once we get into the general election process, “Fighting Climate Change” will intensify as a wedge issue, wielded by smug righteous believers on the left against the anti-science neanderthals on the right.
So it is a hot label for social-media driven types to identify who is in the tribe (who can be trusted) and the others who can not. For many, it is not any deeper than that.
The Warming Consensus is a Timesaver
My friend acknowledged that his mind was made up on the issue because 95+% of scientists agreed. It was extremely important for him to discredit Lindzen as untrustworthy to maintain the unanimity. When a Warmist uses: “The Scientists say: ______” , it is much the same as a Christian reference: “The Bible says: _______.” In both cases, you can fill in the blank with whatever you like, and attribute your idea to the Authority. And most importantly, you can keep the issue safely parked in a No Thinking Zone. There are plenty of confusing things going on around us, and no one wants one more ambiguity requiring time and energy.
Science Could Lose the Delicate Balance Between Head and Heart
Decades ago Arthur Eddington wrote about the tension between attitudes of artists and scientists in their regarding nature. On the one hand are people filled with the human impulse to respect, adore and celebrate the beauty of life and the world. On the other are people driven by the equally human need to analyze, understand and know what to expect from the world. These are Yin and Yang, not mutually exclusive, and all of us have some of each.
Most of us can recall the visceral response in the high school biology lab when assigned to dissect a frog. Later on, crayfish were preferred (less disturbing to artistic sensibilities). For all I know, recent generations have been spared this right of passage, to their detriment. For in the conflict between appreciating things as they are, and the need to know why and how they are, we are exposed to deeper reaches of the human experience. If you have ever witnessed, as I have, a human body laid open on an autopsy table, then you know what I mean.
Anyone, scientist or artist, can find awe in contemplating the mysteries of life. There was a time when it was feared that the march of science was so advancing the boundaries of knowledge that the shrinking domain of the unexplained left ever less room for God and religion. Practicing scientists knew better. Knowing more leads to discovering more unknowns; answers produce cascades of new questions. The mystery abounds, and the discovery continues. Eddington:
It is pertinent to remember that the concept of substance has disappeared from fundamental physics; what we ultimately come down to is form. Waves! Waves!! Waves!!! Or for a change — if we turn to relativity theory — curvature! Energy which, since it is conserved, might be looked upon as the modern successor of substance, is in relativity theory a curvature of space-time, and in quantum theory a periodicity of waves. I do not suggest that either the curvature or the waves are to be taken in a literal objective sense; but the two great theories, in their efforts to reduce what is known about energy to a comprehensible picture, both find what they require in a conception of “form”.
What do we really observe? Relativity theory has returned one answer — we only observe relations. Quantum theory returns another answer — we only observe probabilities.
It is impossible to trap modern physics into predicting anything with perfect determinism because it deals with probabilities from the outset.
― Arthur Stanley Eddington
Works by Eddington on Science and the Natural World are here.
Summary
The science problem today is not the scientists themselves, but with those attempting to halt its progress for the sake of political power and wealth.
Eddington: Religious creeds are a great obstacle to any full sympathy between the outlook of the scientist and the outlook which religion is so often supposed to require … The spirit of seeking which animates us refuses to regard any kind of creed as its goal. It would be a shock to come across a university where it was the practice of the students to recite adherence to Newton’s laws of motion, to Maxwell’s equations and to the electromagnetic theory of light. We should not deplore it the less if our own pet theory happened to be included, or if the list were brought up to date every few years. We should say that the students cannot possibly realise the intention of scientific training if they are taught to look on these results as things to be recited and subscribed to. Science may fall short of its ideal, and although the peril scarcely takes this extreme form, it is not always easy, particularly in popular science, to maintain our stand against creed and dogma.
― Arthur Stanley Eddington
But enough about science. It’s politicians we need to worry about:
Footnote:
“Asked in 1919 whether it was true that only three people in the world understood the theory of general relativity, [Eddington] allegedly replied: ‘Who’s the third?”
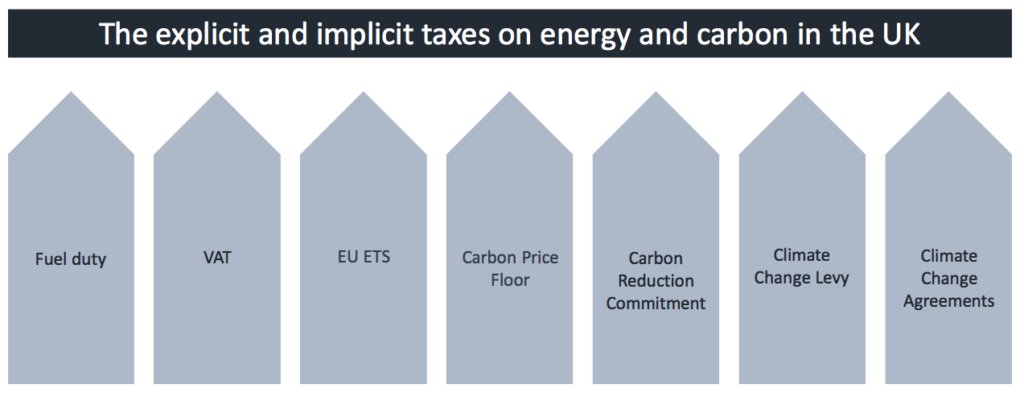
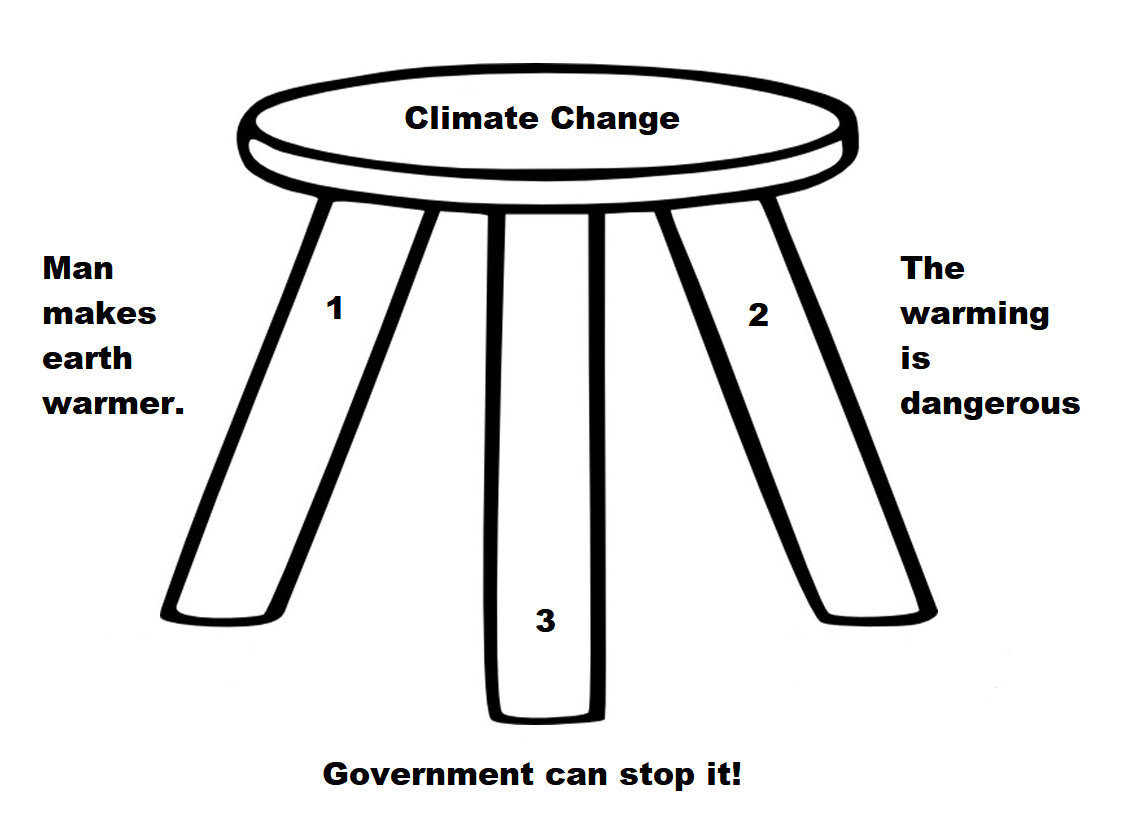
As the stool above shows, the climate change package sits on three premises. The first is the science bit, consisting of an unproven claim that observed warming is caused by humans burning fossil fuels. The second part rests on impact studies from billions of research dollars spent uncovering any and all possible negatives from warming. And the third leg is climate policies showing how governments can “fight climate change.”
The call for climate action depends on proponents providing convincing answers to questions regarding all three dimensions. H/T to Master Resource for pointing to essays by William Niskonen and Steven Horwitz setting forth the issues to be resolved. I will refer to excerpts from Global Warming Is about Social Science Too by Horowitz.
To help clarify what’s at stake, I offer a list of questions that are (or should be) at the center of the debate over anthropogenic (human-caused) global warming. I will provide some quick commentary on some to note their importance and then conclude with what I see as the importance of this list.
Matters of Science
1. Is the planet getting warmer?
2. If it’s getting warmer, is that warming caused by humans? Obviously this is a big question because if warming is not human-caused, then it’s not clear how much we can do to reduce it. What we might do about the consequences, however, remains an open question.
3. If it’s getting warmer, by what magnitude? If the magnitude is large, then there’s one set of implications. But if it’s small, then, as we’ll see, it might not be worth responding to. This is a good example of a scientific question with large implications for policy.
My Comment: Most people studying climate science agree that it has warmed about a degree celsius since the end of the Little Ice Age (~1850). But there have been multi-decadal periods of warming and cooling as well as the current plateau in temperatures. As well, there are many places (e.g.almost 1/3 of US stations) showing cooling while other places have warming trends. Skeptics note that no one has yet separated natural warming from man-made warming. In the record, natural warming prior to the 1940s matches almost exactly the warming from 1970s to 2000, claimed to be man-made.
Horowitz continues: All these questions are presumably matters of science. In principle we ought to be able to answer them using the tools of science, even if they are complex issues that involve competing interpretations and methods. Let’s assume the planet is in fact warming and that humans are the reason.
Impacts of Warming
4. What are the costs of global warming? This question is frequently asked and answered.
5. What are the benefits of global warming? This question needs to be asked as well, as global warming might bring currently arctic areas into a more temperate climate that would enable them to become sources of food. Plus, a warmer planet might decrease the demand for fossil fuels for heating homes and businesses in those formerly colder places.
6. Do the benefits outweigh the costs or do the costs outweigh the benefits? This is also not frequently asked. Obviously, if the benefits outweigh the costs, then we shouldn’t be worrying about global warming. Two other points are worth considering. First, the benefits and costs are not questions of scientific fact because how we do the accounting depends on all kinds of value-laden questions. But that doesn’t mean the cost-benefit comparison isn’t important. Second, this question might depend greatly on the answers to the scientific questions above. In other words: All questions of public policy are ones that require both facts and values to answer. One cannot go directly from science to policy without asking the kinds of questions I’ve raised here.
Rotterdam Adaptation Policy–Ninety years thriving behind dikes and dams.
Climate Policies
7. If the costs outweigh the benefits, what sorts of policies are appropriate? There are many too many questions here to deal with in detail, but it should be noted that disagreements over what sorts of policies would best deal with the net costs of global warming are, again, matters of both fact and value, or science and social science.
8. What are the costs of the policies designed to reduce the costs of global warming? This question is not asked nearly enough. Even if we design policies on the blackboard that seem to mitigate the effects of global warming, we have to consider, first, whether those policies are even likely to be passed by politicians as we know them, and second, whether the policies might have associated costs that outweigh their benefits with respect to global warming. So if in our attempt to reduce the effects of global warming we slow economic growth so far as to impoverish more people, or we give powers to governments that are likely to be used in ways having little to do with global warming, we have to consider those results in the total costs and benefits of using policy to combat global warming. This is a question of social science that is no less important than the scientific questions I began with.
I could add more, but this is sufficient to make my key points. First, it is perfectly possible to accept the science of global warming but reject the policies most often put forward to combat it. One can think humans are causing the planet to warm but logically and humanely conclude that we should do nothing about it.
Second, people who take that position and back it up with good arguments should not be called “deniers.” They are not denying the science; they are questioning its implications. In fact, those who think they can go directly from science to policy are, as it turns out, engaged in denial – denial of the relevance of social science.
Steven Horwitz is the Schnatter Distinguished Professor of Free Enterprise in the Department of Economics at Ball State University, where he also is a Fellow at the John H. Schnatter Institute for Entrepreneurship and Free Enterprise. He is the author of Hayek’s Modern Family: Classical Liberalism and the Evolution of Social Institutions.
Climate science, impacts and policies also appear as a house of cards.
The best context for understanding decadal temperature changes comes from the world’s sea surface temperatures (SST), for several reasons:
The ocean covers 71% of the globe and drives average temperatures;
SSTs have a constant water content, (unlike air temperatures), so give a better reading of heat content variations;
A major El Nino was the dominant climate feature in recent years.
HadSST is generally regarded as the best of the global SST data sets, and so the temperature story here comes from that source, the latest version being HadSST3. More on what distinguishes HadSST3 from other SST products at the end.
The Current Context
The chart below shows SST monthly anomalies as reported in HadSST3 starting in 2015 through May 2018.
Open image in new tab to enlarge.
A global cooling pattern has persisted, seen clearly in the Tropics since its peak in 2016, joined by NH and SH dropping since last August. Upward bumps occurred last October, in January and again in March and April 2018. Five months of 2018 now show slight warming since the low point of December 2017, led by steadily rising NH. May 2018 temps in all regions are slightly lower than 5/2015, except for the Tropics being much lower. Since 4/2018 SH and Tropics cooled slightly while NH pulled the Global anomaly upwards.
Note that higher temps in 2015 and 2016 were first of all due to a sharp rise in Tropical SST, beginning in March 2015, peaking in January 2016, and steadily declining back below its beginning level. Secondly, the Northern Hemisphere added three bumps on the shoulders of Tropical warming, with peaks in August of each year. Also, note that the global release of heat was not dramatic, due to the Southern Hemisphere offsetting the Northern one.
With ocean temps positioned the same as three years ago, we can only wait and see whether the previous cycle will repeat or something different appears. As the analysis belows shows, the North Atlantic has been the wild card bringing warming this decade, and cooling will depend upon a phase shift in that region.
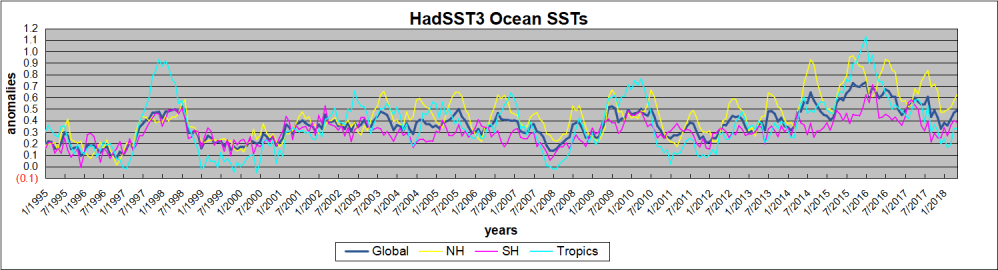
A longer view of SSTs
The graph below is noisy, but the density is needed to see the seasonal patterns in the oceanic fluctuations. Previous posts focused on the rise and fall of the last El Nino starting in 2015. This post adds a longer view, encompassing the significant 1998 El Nino and since. The color schemes are retained for Global, Tropics, NH and SH anomalies. Despite the longer time frame, I have kept the monthly data (rather than yearly averages) because of interesting shifts between January and July.
Open image in new tab to enlarge.
1995 is a reasonable starting point prior to the first El Nino. The sharp Tropical rise peaking in 1998 is dominant in the record, starting Jan. ’97 to pull up SSTs uniformly before returning to the same level Jan. ’99. For the next 2 years, the Tropics stayed down, and the world’s oceans held steady around 0.2C above 1961 to 1990 average.
Then comes a steady rise over two years to a lesser peak Jan. 2003, but again uniformly pulling all oceans up around 0.4C. Something changes at this point, with more hemispheric divergence than before. Over the 4 years until Jan 2007, the Tropics go through ups and downs, NH a series of ups and SH mostly downs. As a result the Global average fluctuates around that same 0.4C, which also turns out to be the average for the entire record since 1995.
2007 stands out with a sharp drop in temperatures so that Jan.08 matches the low in Jan. ’99, but starting from a lower high. The oceans all decline as well, until temps build peaking in 2010.
Now again a different pattern appears. The Tropics cool sharply to Jan 11, then rise steadily for 4 years to Jan 15, at which point the most recent major El Nino takes off. But this time in contrast to ’97-’99, the Northern Hemisphere produces peaks every summer pulling up the Global average. In fact, these NH peaks appear every July starting in 2003, growing stronger to produce 3 massive highs in 2014, 15 and 16, with July 2017 only slightly lower. Note also that starting in 2014 SH plays a moderating role, offsetting the NH warming pulses. (Note: these are high anomalies on top of the highest absolute temps in the NH.)
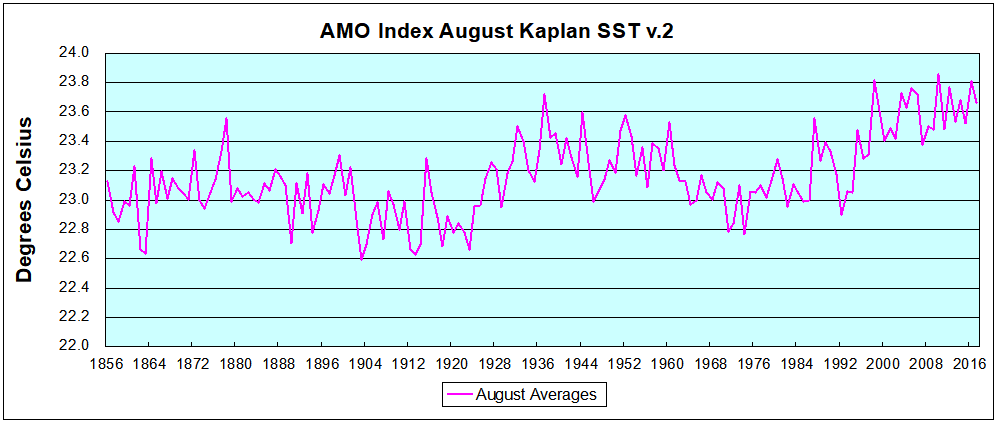
What to make of all this? The patterns suggest that in addition to El Ninos in the Pacific driving the Tropic SSTs, something else is going on in the NH. The obvious culprit is the North Atlantic, since I have seen this sort of pulsing before. After reading some papers by David Dilley, I confirmed his observation of Atlantic pulses into the Arctic every 8 to 10 years as shown by this graph:
The data is annual averages of absolute SSTs measured in the North Atlantic. The significance of the pulses for weather forecasting is discussed in AMO: Atlantic Climate Pulse
But the peaks coming nearly every July in HadSST require a different picture. Let’s look at August, the hottest month in the North Atlantic from the Kaplan dataset.Now the regime shift appears clearly. Starting with 2003, seven times the August average has exceeded 23.6C, a level that prior to ’98 registered only once before, in 1937. And other recent years were all greater than 23.4C.
Summary
The oceans are driving the warming this century. SSTs took a step up with the 1998 El Nino and have stayed there with help from the North Atlantic, and more recently the Pacific northern “Blob.” The ocean surfaces are releasing a lot of energy, warming the air, but eventually will have a cooling effect. The decline after 1937 was rapid by comparison, so one wonders: How long can the oceans keep this up?
To paraphrase the wheel of fortune carnival barker: “Down and down she goes, where she stops nobody knows.” As this month shows, nature moves in cycles, not straight lines, and human forecasts and projections are tenuous at best.
Postscript:
In the most recent GWPF 2017 State of the Climate report, Dr. Humlum made this observation:
“It is instructive to consider the variation of the annual change rate of atmospheric CO2 together with the annual change rates for the global air temperature and global sea surface temperature (Figure 16). All three change rates clearly vary in concert, but with sea surface temperature rates leading the global temperature rates by a few months and atmospheric CO2 rates lagging 11–12 months behind the sea surface temperature rates.”
Footnote: Why Rely on HadSST3
HadSST3 is distinguished from other SST products because HadCRU (Hadley Climatic Research Unit) does not engage in SST interpolation, i.e. infilling estimated anomalies into grid cells lacking sufficient sampling in a given month. From reading the documentation and from queries to Met Office, this is their procedure.
HadSST3 imports data from gridcells containing ocean, excluding land cells. From past records, they have calculated daily and monthly average readings for each grid cell for the period 1961 to 1990. Those temperatures form the baseline from which anomalies are calculated.
In a given month, each gridcell with sufficient sampling is averaged for the month and then the baseline value for that cell and that month is subtracted, resulting in the monthly anomaly for that cell. All cells with monthly anomalies are averaged to produce global, hemispheric and tropical anomalies for the month, based on the cells in those locations. For example, Tropics averages include ocean grid cells lying between latitudes 20N and 20S.
Gridcells lacking sufficient sampling that month are left out of the averaging, and the uncertainty from such missing data is estimated. IMO that is more reasonable than inventing data to infill. And it seems that the Global Drifter Array displayed in the top image is providing more uniform coverage of the oceans than in the past.
USS Pearl Harbor deploys Global Drifter Buoys in Pacific Ocean


 The Farmer’s Weekly advises UK farmers:


 Looks like it’s time yet again to play Climate Whack-A-Mole. That means stepping back to get some perspective on the reports and the interpretations applied by those invested in alarmism.


 While fracking has been around for decades, two developments in recent years are responsible for thrusting the technique into the public eye. The first is the fairly recent development in which fracking was combined with horizontal drilling, another common technique used in the oil and gas industry.


 The best context for understanding decadal temperature changes comes from the world’s sea surface temperatures (SST), for several reasons:
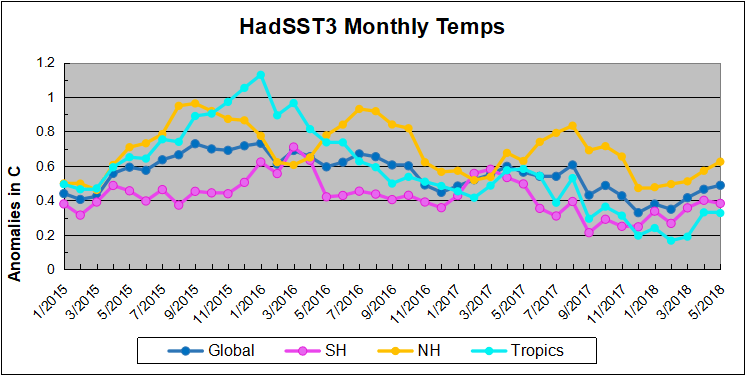
 The data is annual averages of absolute SSTs measured in the North Atlantic. The significance of the pulses for weather forecasting is discussed in