July 10 Arctic Ice Report

The extent of Arctic ice fell to a new wintertime low in March 2017. But springtime ice persisted and June and July are hanging around the decadal average.
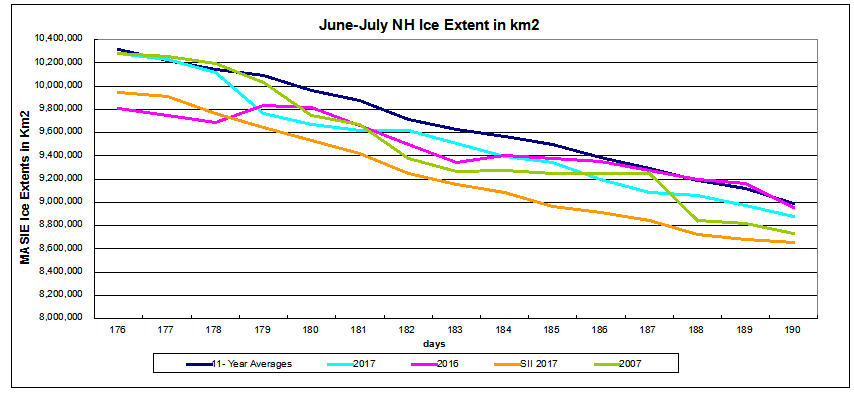
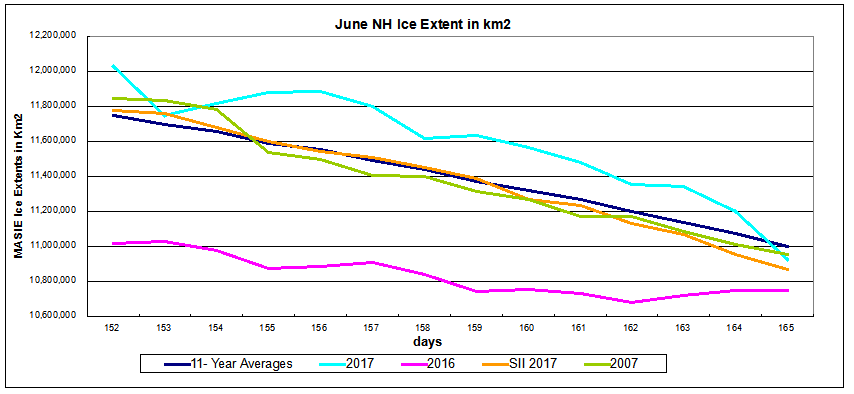
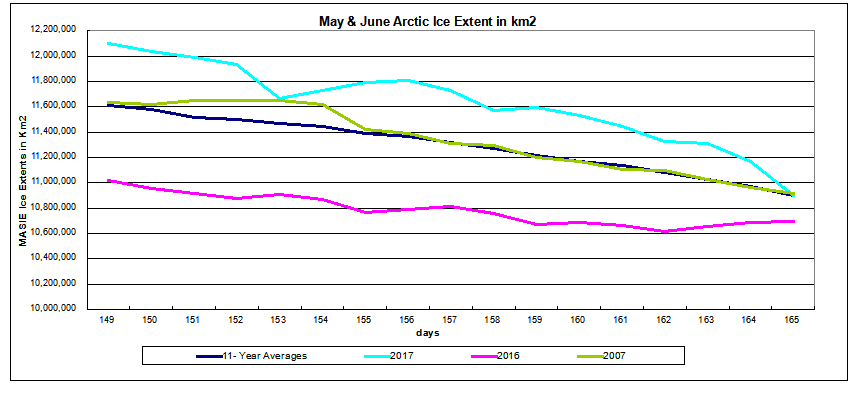
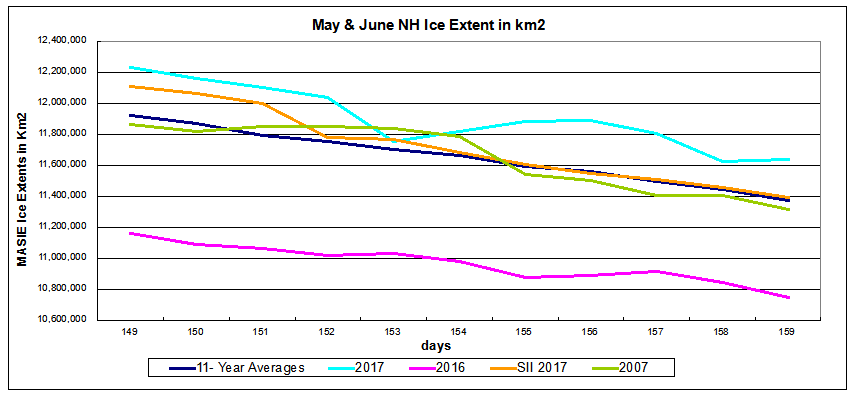
The graph shows the last two weeks ending day 190, July 9, 2017. 2016 and 2017 are nearly average and lower than 9M km2, while 2007 is about 150k km2 down, and SII 2017 even lower. The recent drop was largely due to Hudson Bay going to open water in just ten days (images at Ten Days in Hudson Bay).
As we shall see, this year’s extents are in surplus on the Atlantic side, offset by deficits on the Pacific side and in Hudson Bay. The image compares day 190 with one year ago.
The Table compares 2017 day 190 ice extents with the decadal average and 2007
| Region | 2017190 | Day 190 Average |
2017-Ave. | 2007190 | 2017-2007 |
| (0) Northern_Hemisphere | 8877716 | 8991896 | -114181 | 8732146 | 145570 |
| (1) Beaufort_Sea | 825960 | 866156 | -40196 | 860404 | -34443 |
| (2) Chukchi_Sea | 563718 | 683345 | -119626 | 609005 | -45287 |
| (3) East_Siberian_Sea | 868691 | 1000309 | -131618 | 871751 | -3060 |
| (4) Laptev_Sea | 719324 | 674515 | 44809 | 647038 | 72285 |
| (5) Kara_Sea | 538340 | 437243 | 101097 | 499369 | 38971 |
| (6) Barents_Sea | 125872 | 69548 | 56324 | 77180 | 48692 |
| (7) Greenland_Sea | 563021 | 450768 | 112253 | 475611 | 87410 |
| (8) Baffin_Bay_Gulf_of_St._Lawrence | 419134 | 364194 | 54941 | 379529 | 39606 |
| (9) Canadian_Archipelago | 702592 | 750592 | -48000 | 743621 | -41030 |
| (10) Hudson_Bay | 306542 | 499414 | -192873 | 360041 | -53499 |
| (11) Central_Arctic | 3243319 | 3183825 | 59494 | 3205488 | 37831 |
The deficits in BCE (Beaufort, Chukchi, East Siberian) are offset by surpluses elsewhere. 2017 would be above average were it not for the 193k km2 deficit in Hudson Bay.
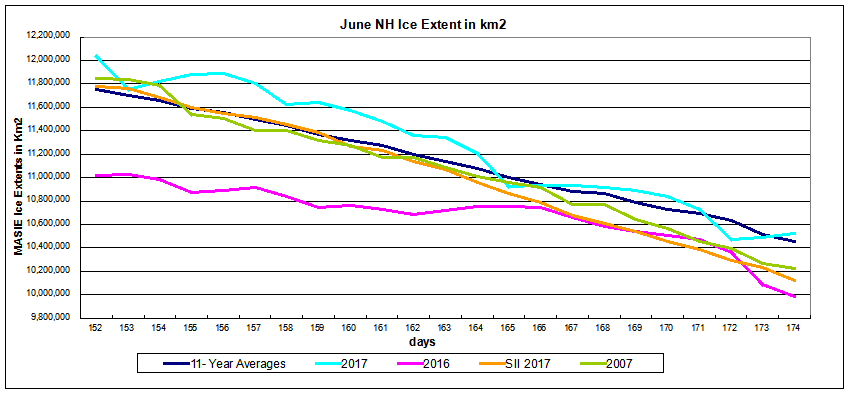
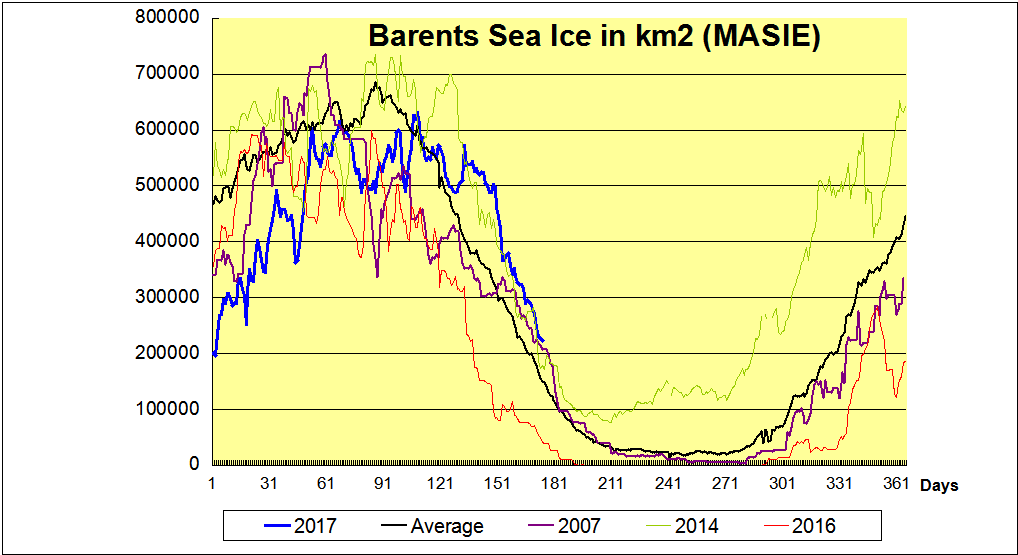
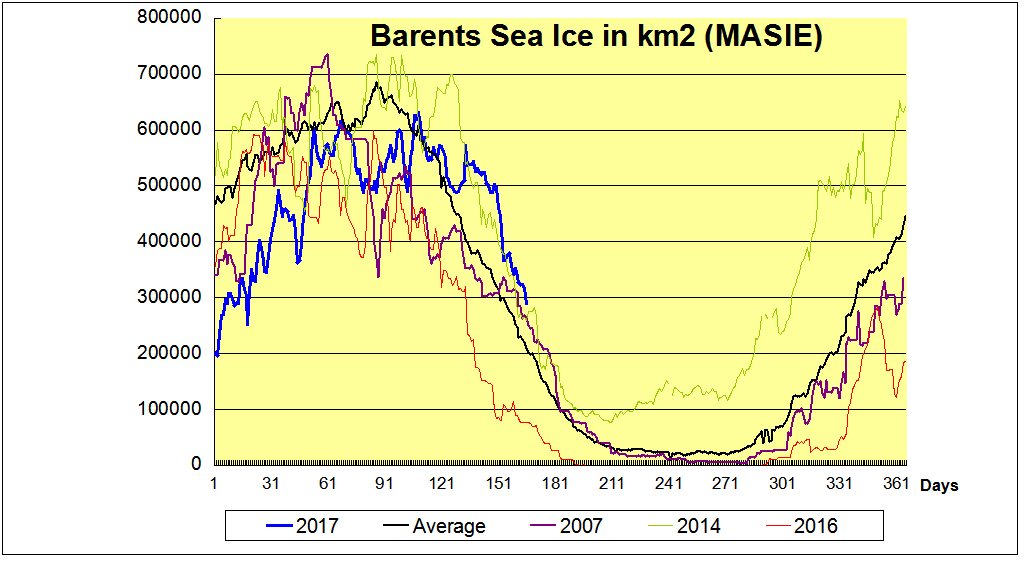
The graph below shows Barents this year continues to be above average matching the record year of 2014. It will be interesting to see if 2017 hits its minimum around day 210 like 2014 did.

The black line is average for the last 11 years. 2007 in purple appears close to an average year. 2014 had the highest annual extent in Barents Sea, due to higher and later maximums, holding onto ice during the summer, and recovering quickly. In contrast, 2016 was the lowest annual extent, melting out early and recovering later. 2017 in blue started out way behind, but grew rapidly to reach average, and then persisted longer to exceed even 2014. It may yet beat out 2014 as the highest in the last 11 years.
For more on why Barents Sea matters see Barents Icicles