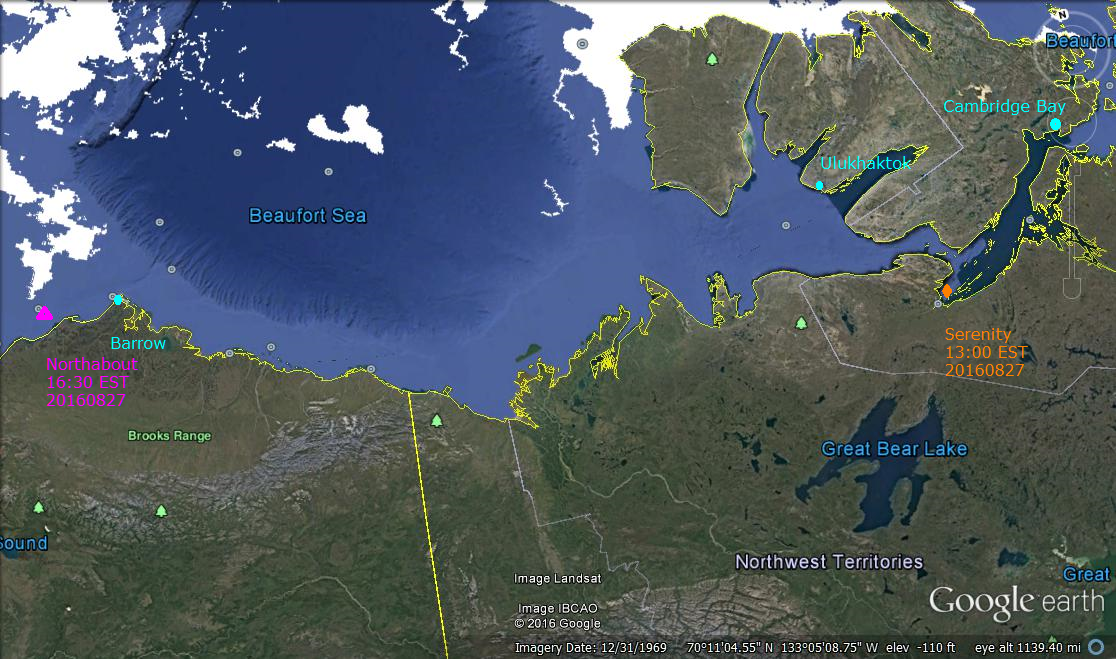
Northabout Racing Against Refreezing

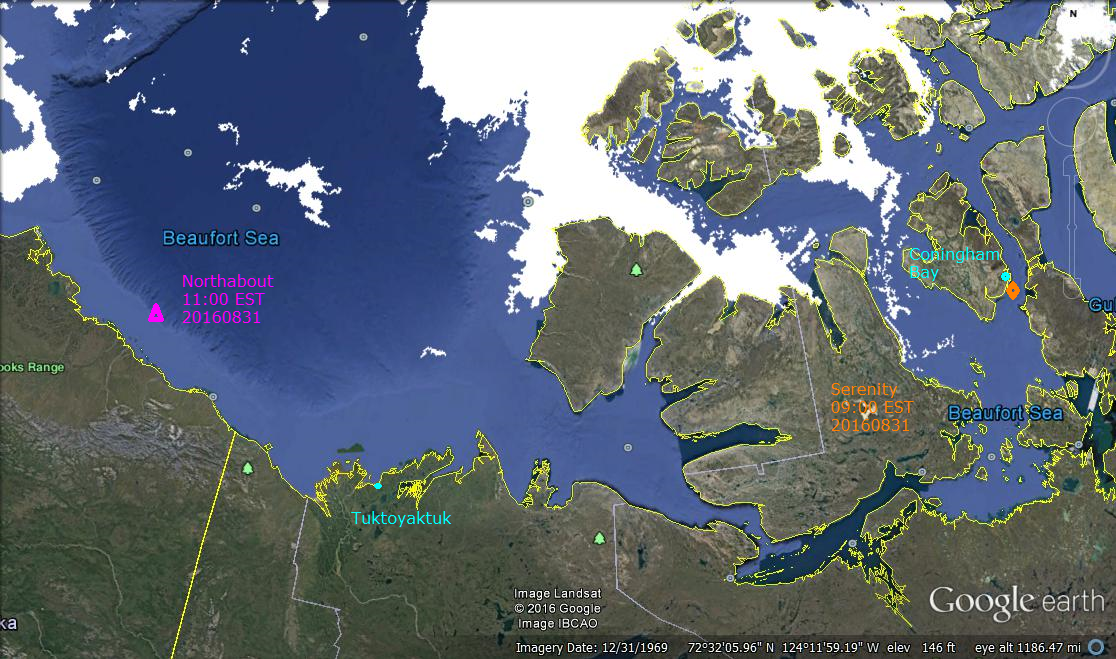
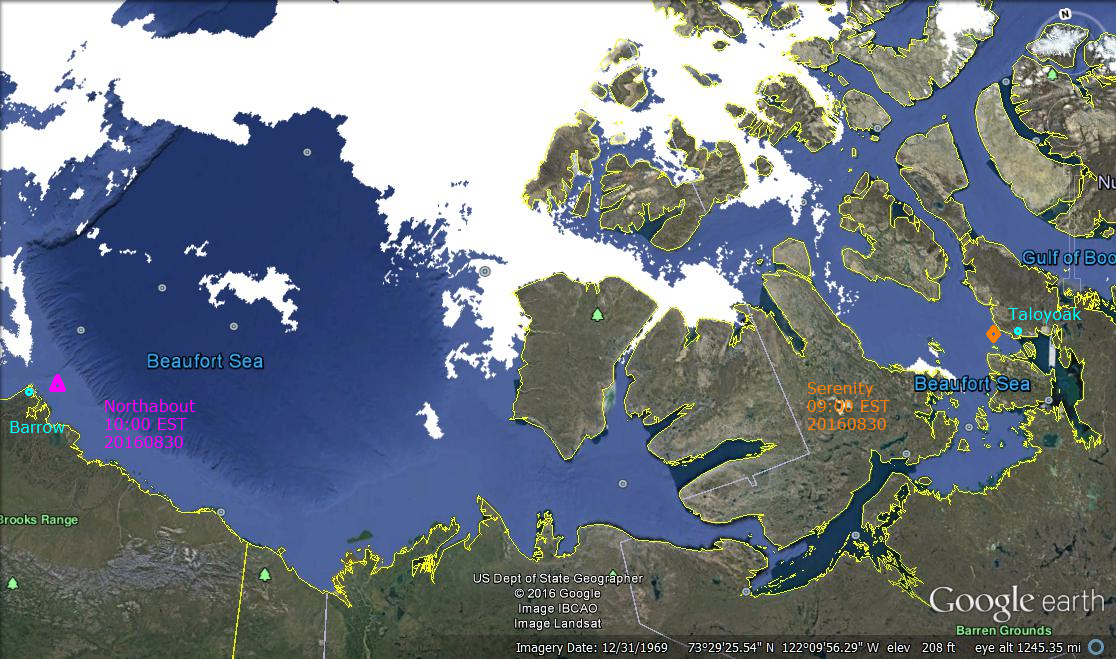
Imagery dat refers to Google Earth capture of land forms. Ice extents are for Sept. 8, 2016 from MASIE. Click on image to zoom in.
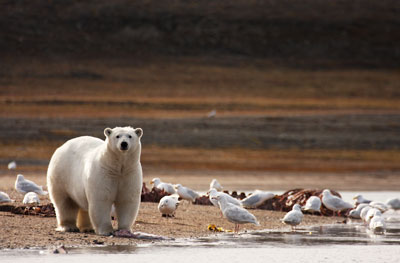
As I have said before, I wish the sailors safe passage even though they have been misled by climate alarmists. Their adventure is life-threatening, though not unprecedented. More than 200 NWP crossings are recorded since 1906, but who knows whether 2017 or beyond will have as much open water as this year.
From the ship’s log:
N69 02 W 101 30 pressure 1006, water1.7C, Air 2C 0500 UTC 9 Sept local time 22.00 8 Sept, Queen Maud Gulf
A winters start. Low cloud base and dark skies. We slowly edged our way past Cambridge Bay into Queen Maud Gulf, surely named by Amundsen.
Cambridge Bay is the last place we could really over winter the boat so I hope we don’t have to retrace our steps.
We knew Polar Bound was coming our way, many months ago. Skippered by a legend in High Latitude Sailing, David Scott Cowper. He has forgotten what we haven’t even learnt yet. Firstly, he was shown up on our AIS, as we got closer to each other, it was a surreal moment. Two Englishmen chatting away over the radio waves, in the North West Passage. No other boat or Nationality around.
Mad dogs and Englishmen came into my thoughts.
What a shame, David was heading to Cambridge Bay for breakfast and invited us to join him, very unfortunately we are in a race against time before the freeze . Also, we need to get to Baffin Bay before a big storm, don’t tell the ladies that ! Hopefully, we will be in harbour by then.
So, the rest of the day was skirting Islands with big cliffs, until this evening. Now making our way up Victoria Strait, water temps plummeted but the skies have cleared to give beautiful stars. A really clear sky, I can’t think of another night like it. Our Ice Charts show 1/10 ice. As Steve pointed out so sagely, doesn’t sound much, but if you have one large chunk in your way in the dark, it’s going to dent your boat !
I have started to twitch at the thought. The last Ice in the sea at night was the Chukchi sea before Point Barrow, we have all had nightmares ever since.
David
Background on the Polar Ocean Challenge
Update August 14, 2016
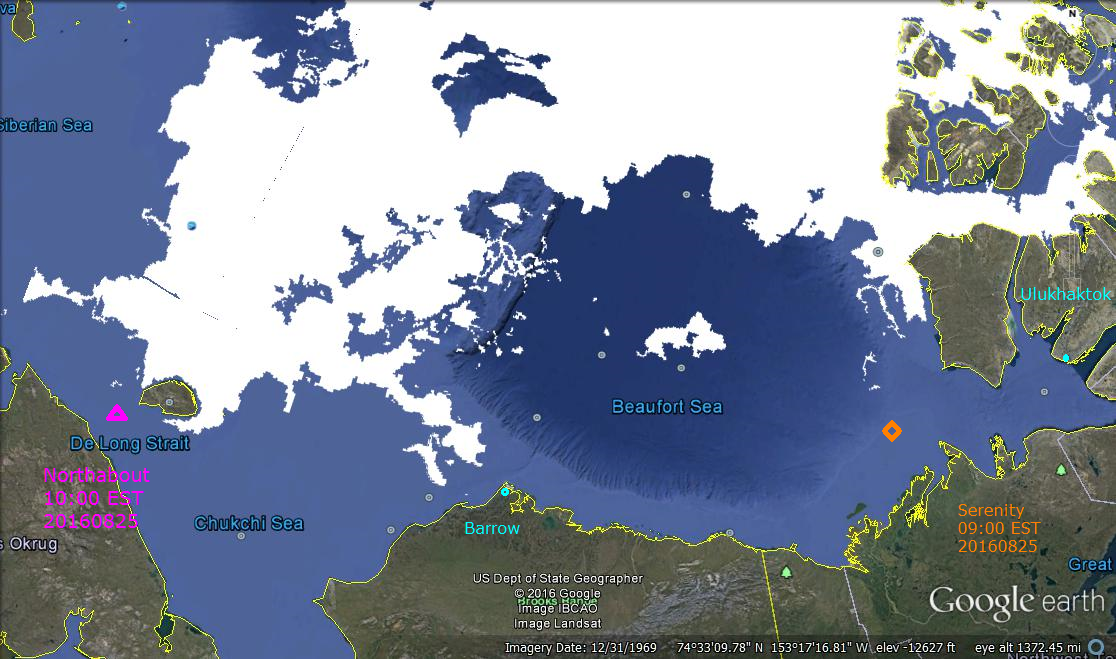
It appears that Northabout has found a way around the Laptev wall, and is close to finding open water. Below the Google Earth image of ice edges from NIC shows how the strait has opened up along with navigable shore lines.
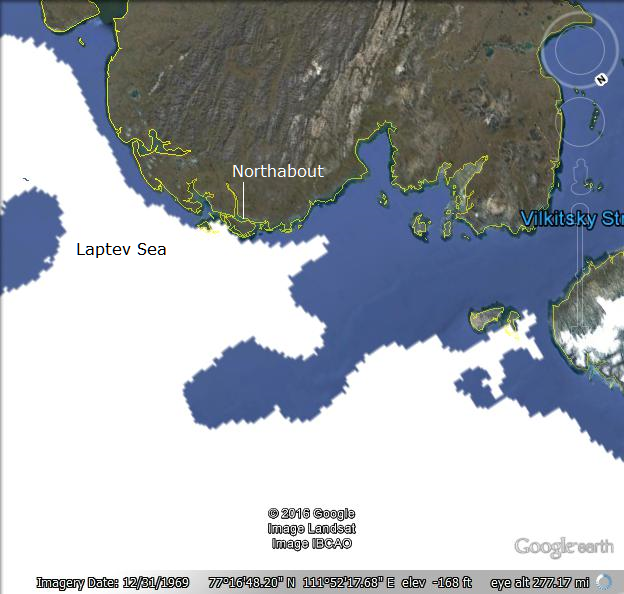
Imagery date refers to Google Earth capture of land forms. Ice edges are provided by MASIE for August 13, 2016.
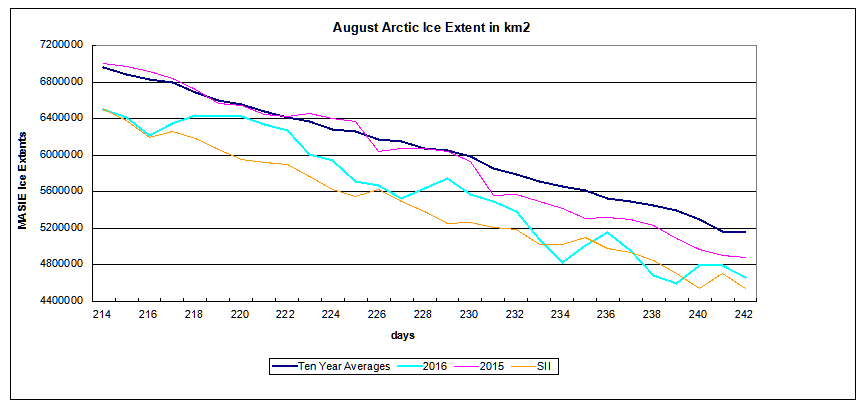
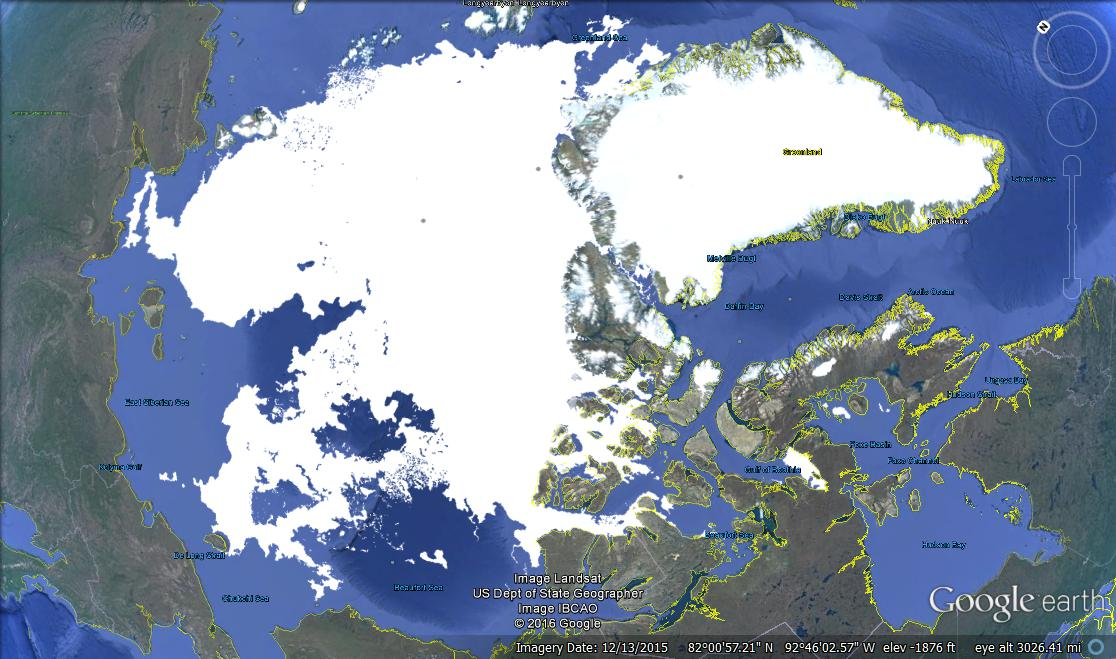
The Big Picture from August 11, 2016.
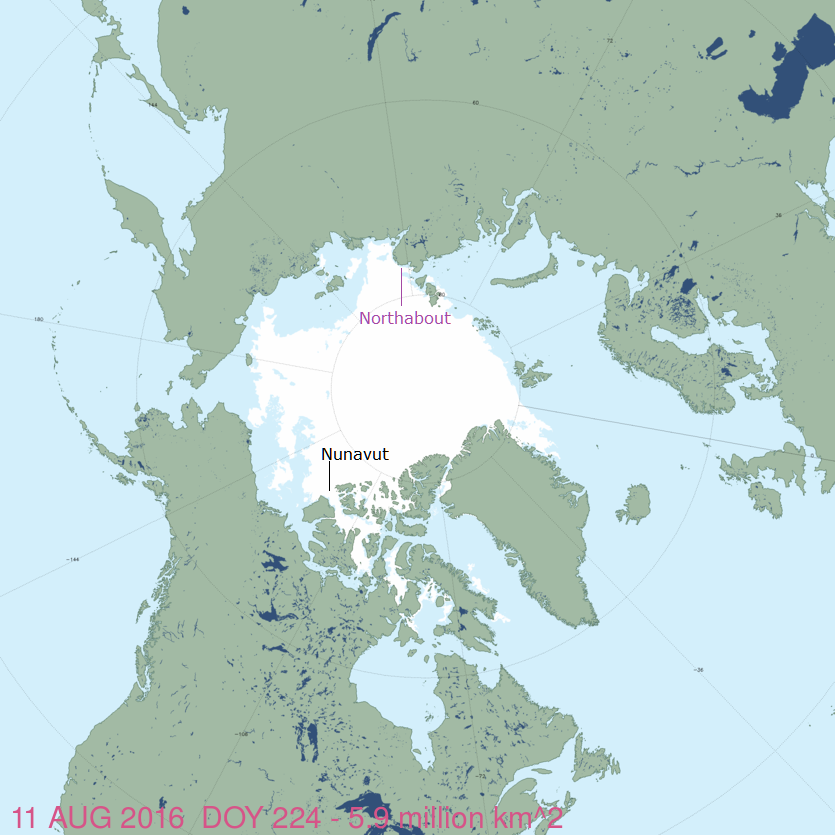
The Polar Ocean Challenge involves the sailing ship Northabout circumnavigating the North Pole counterclockwise starting from Bristol UK. The chart above from MASIE shows the two choke points in the itinerary: The Laptev Wall of ice at the beginning and the Nunavut Gauntlet of ice at the end. The image shows If Northabout can get past Laptev, it is relatively clear sailing all the way to Beaufort where Nunavut awaits.

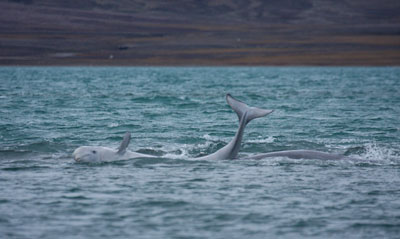
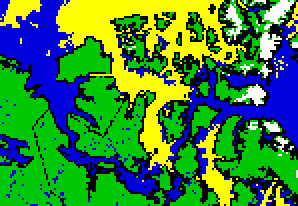
The above chart from AARI shows how Northabout has passed through the strait from Kara into Laptev and is in a holding pattern up against the wall. Caleb has some great photos (here) of the views from the deck, along with some comments respecting the explorers despite their being misled by global warming theorists.
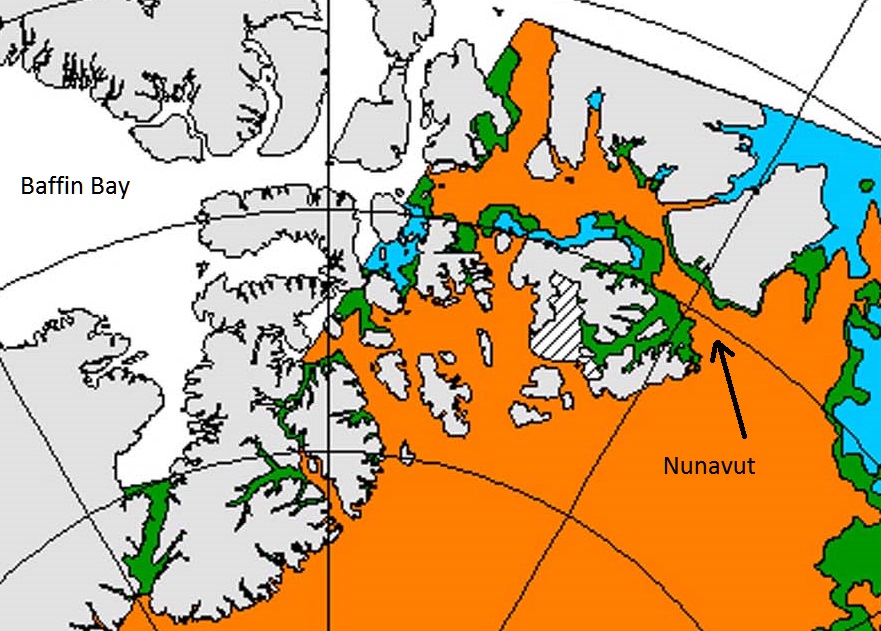
Above is the latest chart from AARI showing the present ice situation at the other end of the trip, the Nunavut Gauntlet. The white part is without data since the Russians are focused on their side of the ocean, but it does show heavy ice in Beaufort Sea on the right, Within Nunavut, Parry Channel is well blocked, but with some water around the edges. If and when Northabout gets here, no one knows what they will face. They are counting on the passage opening this year, unlike previous years.
An image of the ice and snow extents from NOAA by way of National Ice Center (NIC)

A closeup of Nunavut from that chart shows they have a chance by using the southern route, skipping all but the eastern end of Parry Channel, provided the ice is better not worse than now when they approach.

Footnote:
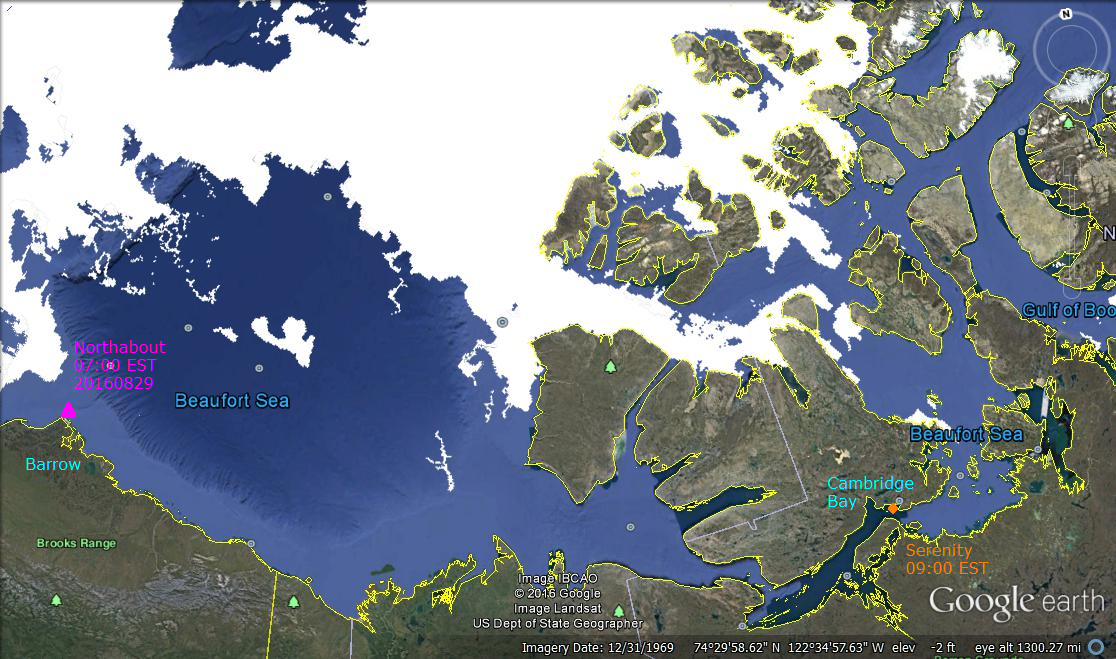
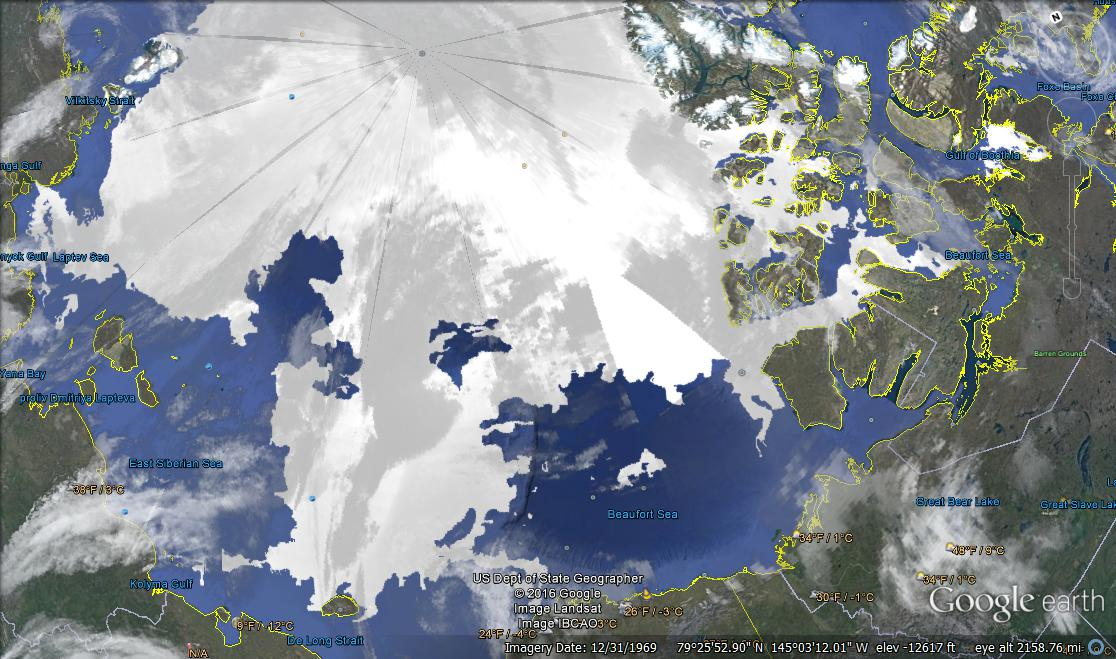
Another view of the Arctic is available from NIC using Google Earth. The daily shapefile can be downloaded, and it then opens in Google Earth, which allows you to browse and zoom in on regions of interest. Here is an image from this source:
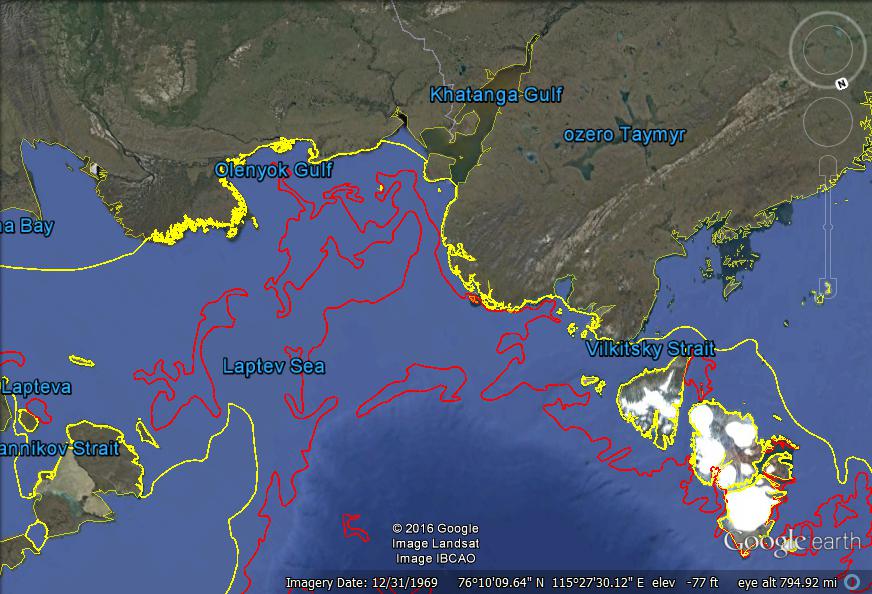
Note: Imagery date is Google Earth capture of land masses. Ice edges are 20160812 from NIC.