Someone asked how the annual average ice extent was coming along this year, so I crunched the numbers. The table shows 2016 year to date (YTD) compared to the ten-year average YTD (2006 -2015 inclusive). Results are provided from MASIE as well as SII (Sea Ice Index from NOAA, Multisensor Analyzed Sea Ice Extent from National Ice Center). SII monthly average for September will be the number used by the Sea Ice Prediction Network to compare to forecasted extents.
| Monthly |
2016 |
2016 |
2016 |
2016-10yr Ave |
2016-10yr Ave |
| Averages |
MASIE |
SII |
SII Deficit |
MASIE |
SII |
| Jan |
13.922 |
13.472 |
-0.450 |
0.049 |
-0.308 |
| Feb |
14.804 |
14.210 |
-0.593 |
0.019 |
-0.422 |
| Mar |
14.769 |
14.405 |
-0.364 |
-0.239 |
-0.481 |
| Apr |
13.917 |
13.694 |
-0.223 |
-0.391 |
-0.613 |
| May |
12.086 |
11.900 |
-0.186 |
-0.681 |
-1.060 |
| June |
10.419 |
10.353 |
-0.066 |
-0.533 |
-0.839 |
| July |
8.067 |
7.920 |
-0.147 |
-0.334 |
-0.501 |
| YTD Ave. |
12.569 |
12.279 |
-0.290 |
-0.301 |
-0.603 |
MASIE shows 2016 average annual ice extent calculated from the seven monthly averages is 12.6M km2, ~300k km2 below average YTD. SII shows YTD average extent is 12.3M km2, about 300k km2 less than MASIE, and 600k km2 less than SII YTD average of the last ten years. IOW, MASIE YTD is 2.3% below average and SII is 4.7% below average.
The table also shows most of the MASIE ice deficits arose in April, May, and June, offsetting normal January and February measurements. SII shows all months in 2016 down by much larger amounts.
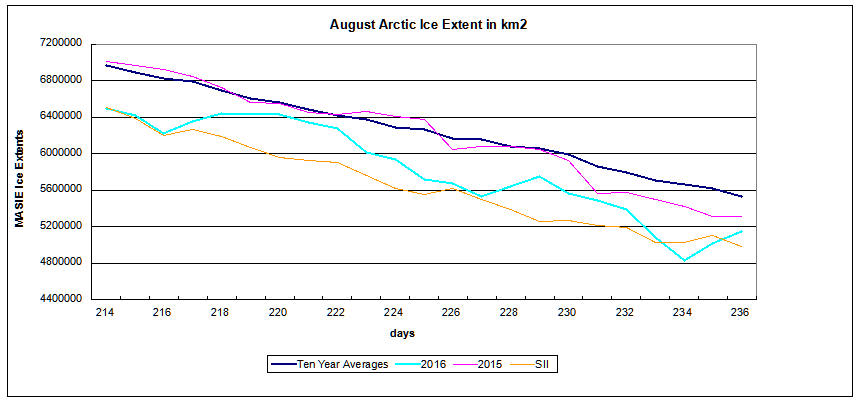
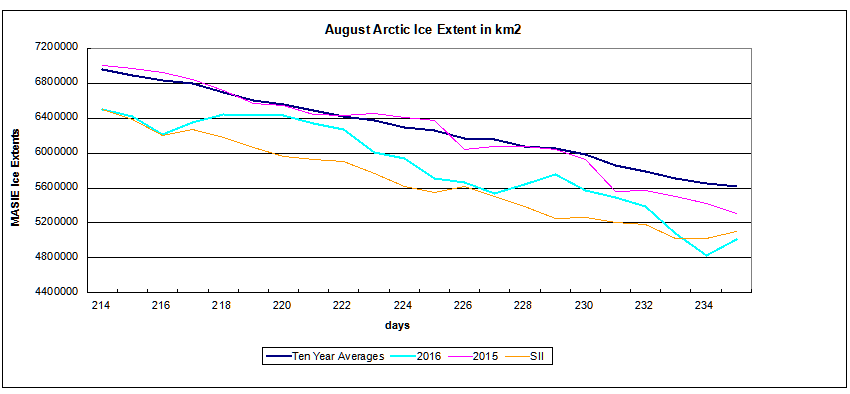
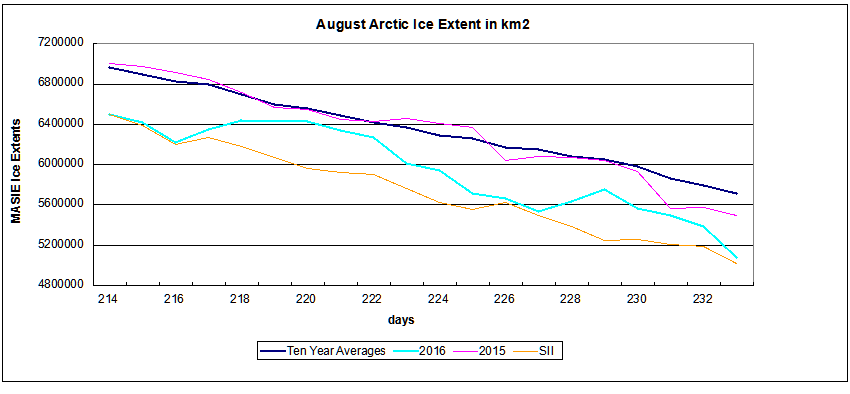
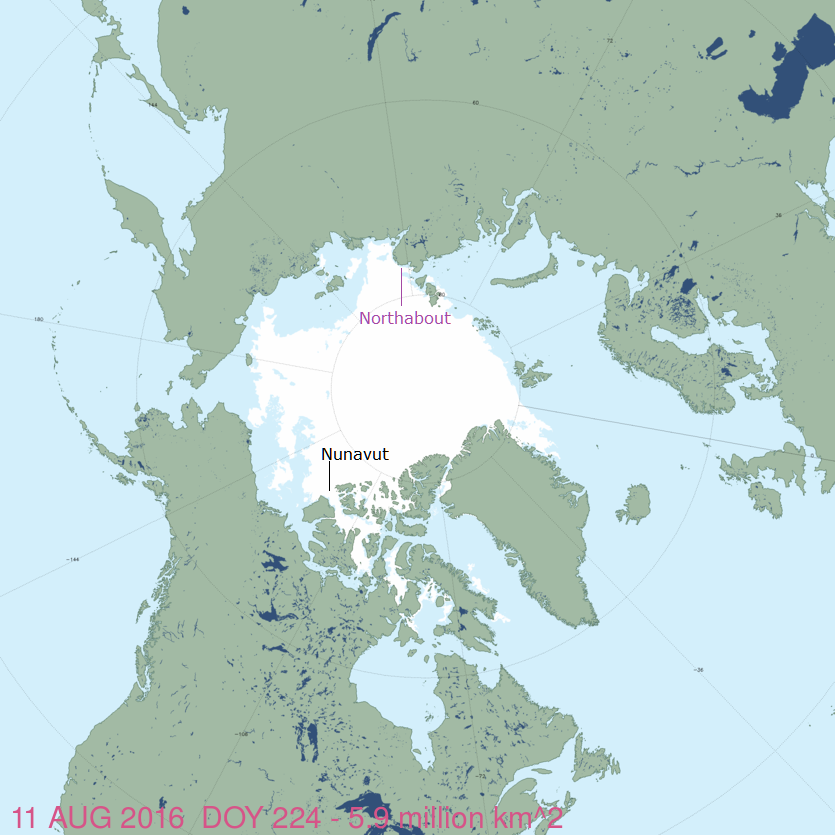
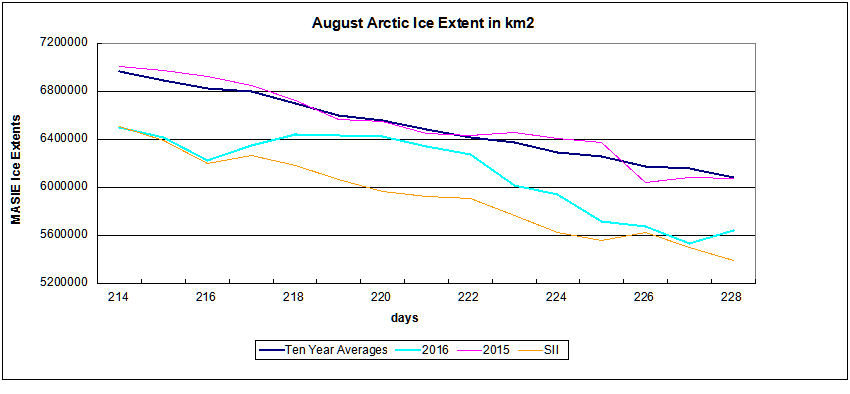
You may also notice that the monthly loss of extent is increasing, and August will likely be similar to July. September losses will be smaller since refreezing typically resumes in the last week or so. Still, there is no cause for alarm, despite what this guy says.

30 August 2012: Cambridge Professor Peter Wadhams predicts Arctic summer sea ice “all gone by 2015”.

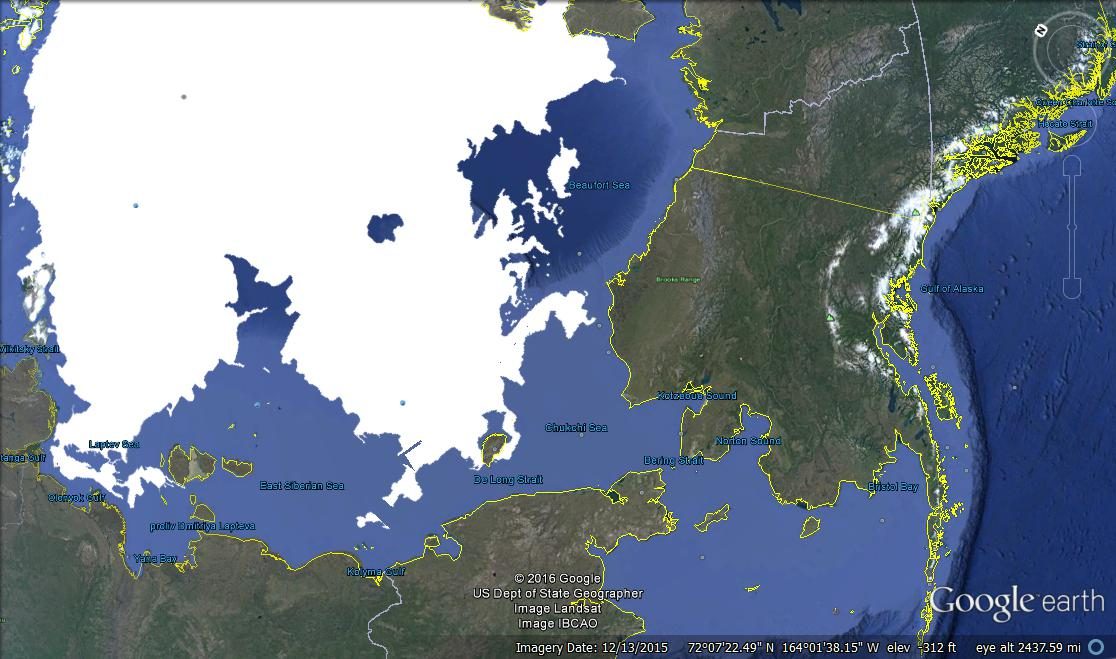
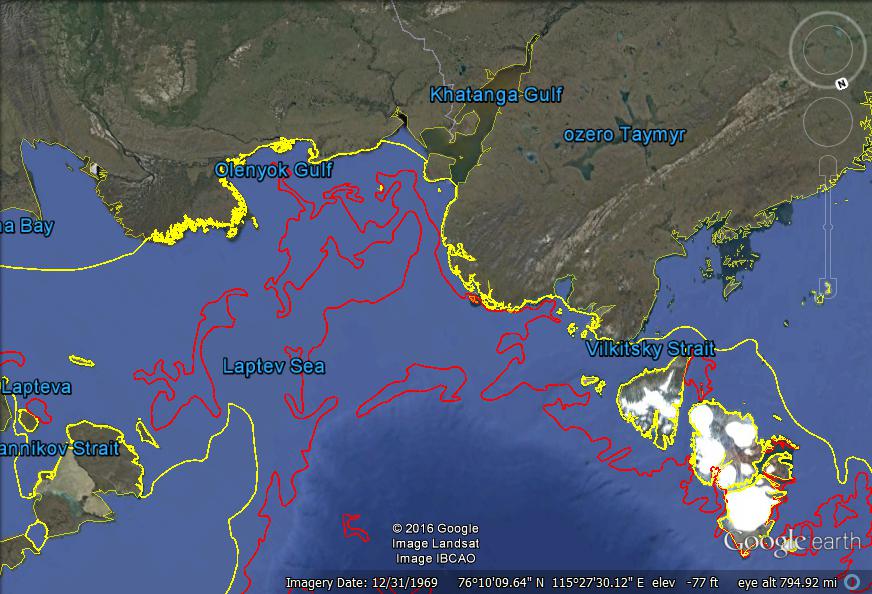
As the chart below shows, the seas most down from average this year are Beaufort, E. Siberian, Kara, CAA, and Greenland Sea. Meanwhile higher extents are showing in Chukchi and Laptev, resulting in 2016 ~350k km2 below average for this date.
| Region |
2016213 |
Day 213 Average |
2016-Ave. |
| (0) Northern_Hemisphere |
6640969 |
6988735 |
-347766 |
| (1) Beaufort_Sea |
669717 |
793684 |
-123967 |
| (2) Chukchi_Sea |
582590 |
540462 |
42127 |
| (3) East_Siberian_Sea |
661000 |
784830 |
-123830 |
| (4) Laptev_Sea |
669258 |
386981 |
282277 |
| (5) Kara_Sea |
54858 |
179795 |
-124937 |
| (6) Barents_Sea |
144 |
30868 |
-30724 |
| (7) Greenland_Sea |
182516 |
316383 |
-133866 |
| (8) Baffin_Bay_Gulf_of_St._Lawrence |
126394 |
122921 |
3473 |
| (9) Canadian_Archipelago |
482313 |
545093 |
-62781 |
| (10) Hudson_Bay |
111666 |
138699 |
-27033 |
| (11) Central_Arctic |
3099606 |
3146919 |
-47313 |
| (12) Bering_Sea |
0 |
186 |
-186 |
| (13) Baltic_Sea |
0 |
47 |
-47 |
| (14) Sea_of_Okhotsk |
0 |
710 |
-710 |

| 2016213 |
NH Max Loss |
% Loss Sea Max |
% Total Loss |
| (0) Northern_Hemisphere |
8436630 |
55.95% |
100% |
| (1) Beaufort_Sea |
400728 |
37.44% |
5% |
| (2) Chukchi_Sea |
383399 |
39.69% |
4% |
| (3) East_Siberian_Sea |
426120 |
39.20% |
5% |
| (4) Laptev_Sea |
228552 |
25.46% |
3% |
| (5) Kara_Sea |
880130 |
94.13% |
10% |
| (6) Barents_Sea |
599235 |
99.98% |
7% |
| (7) Greenland_Sea |
477196 |
72.33% |
5% |
| (8) Baffin_Bay_Gulf_of_St._Lawrence |
1518188 |
92.31% |
17% |
| (9) Canadian_Archipelago |
370866 |
43.47% |
4% |
| (10) Hudson_Bay |
1149204 |
91.14% |
13% |
| (11) Central_Arctic |
147104 |
4.53% |
2% |
| (12) Bering_Sea |
768232 |
100.00% |
9% |
| (13) Baltic_Sea |
97582 |
100.00% |
1% |
| (14) Sea_of_Okhotsk |
1308697 |
100.00% |
15% |
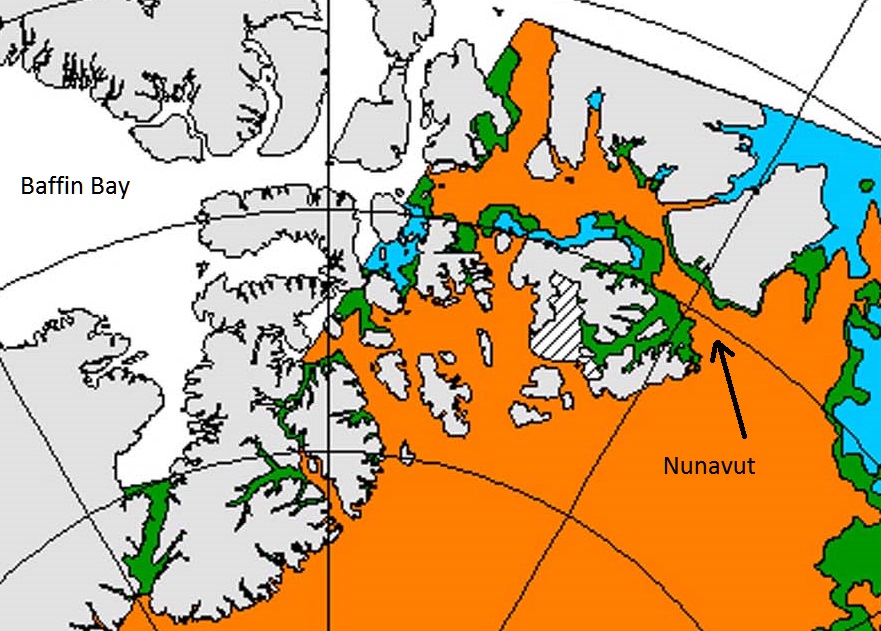
It is clear from the above that the bulk of ice losses are coming from Okhotsk, Barents and Bering Seas (100% melted),along with Kara Sea, Hudson Bay and Baffin Bay-St. Lawrence (90+% melted). All of them are marginal seas that will go down close to zero by September. Note: Some seas are not at max on the NH max day. Thus, totals from adding losses will vary from NH daily total.


CPC shows the Arctic Oscillation waffling between positive and negative values, recently positive and forecasted to near neutral. Generally, positive AO signifies lower pressures over Arctic ice, with more cloud, lower insolation and less melting. The outlook at this point is mixed.

September Minimum Outlook
Historically, where will ice be remaining when Arctic melting stops? Over the last 10 years, on average MASIE shows the annual minimum occurring about day 260. Of course in a given year, the daily minimum varies slightly a few days +/- from that.
For comparison, here are sea ice extents reported from 2007, 2012, 2014 and 2015 for day 260:
| Arctic Regions |
2007 |
2012 |
2014 |
2015 |
| Central Arctic Sea |
2.67 |
2.64 |
2.98 |
2.93 |
| BCE |
0.50 |
0.31 |
1.38 |
0.89 |
| Greenland & CAA |
0.56 |
0.41 |
0.55 |
0.46 |
| Bits & Pieces |
0.32 |
0.04 |
0.22 |
0.15 |
| NH Total |
4.05 |
3.40 |
5.13 |
4.44 |
Notes: Extents are in M km2. BCE region includes Beaufort, Chukchi and Eastern Siberian seas. Greenland Sea (not the ice sheet). Canadian Arctic Archipelago (CAA). Locations of the Bits and Pieces vary.
As the table shows, low NH minimums come mainly from ice losses in Central Arctic and BCE. The great 2012 cyclone hit both in order to set the recent record. The recovery since 2012 shows in 2014, with some dropoff last year, mostly in BCE.
Summary
We are well into the melt season, and the resulting minimum will depend upon the vagaries of weather between now and September. Early on, 2016 was slightly higher than 2015 in March, lower in May and narrowing the gap late June and late July. Note: 2016 melt season is starting without the Blob, with El Nino over, and a cold blob in the North Atlantic. The AO has been hovering around neutral, now possibly indicating cloud cover reducing the pace of melting.
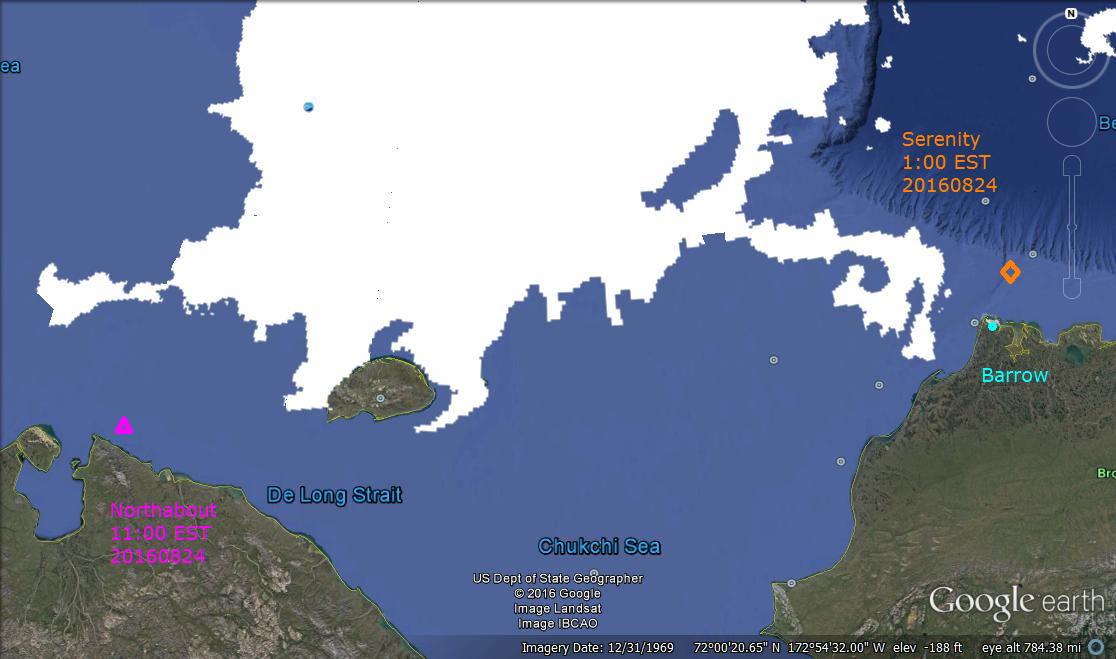
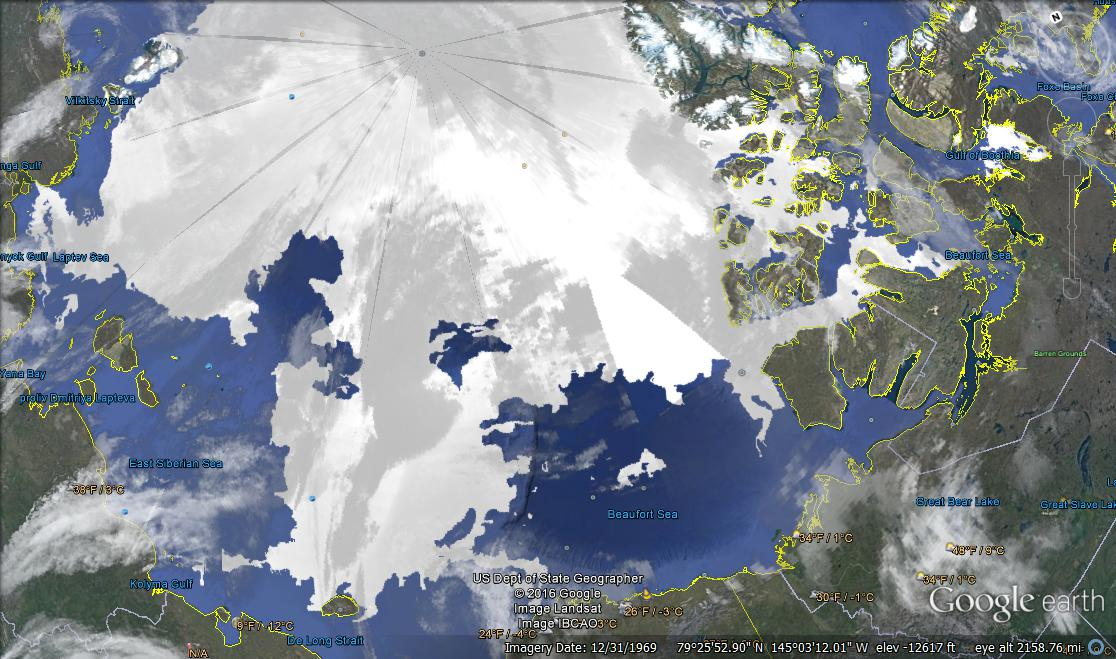
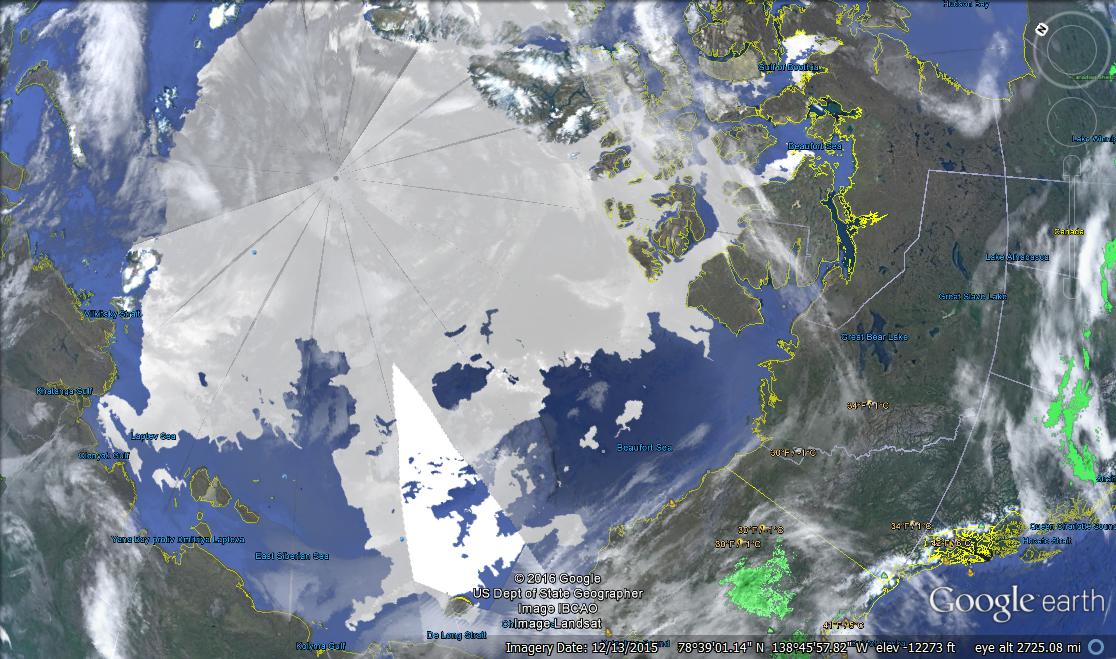
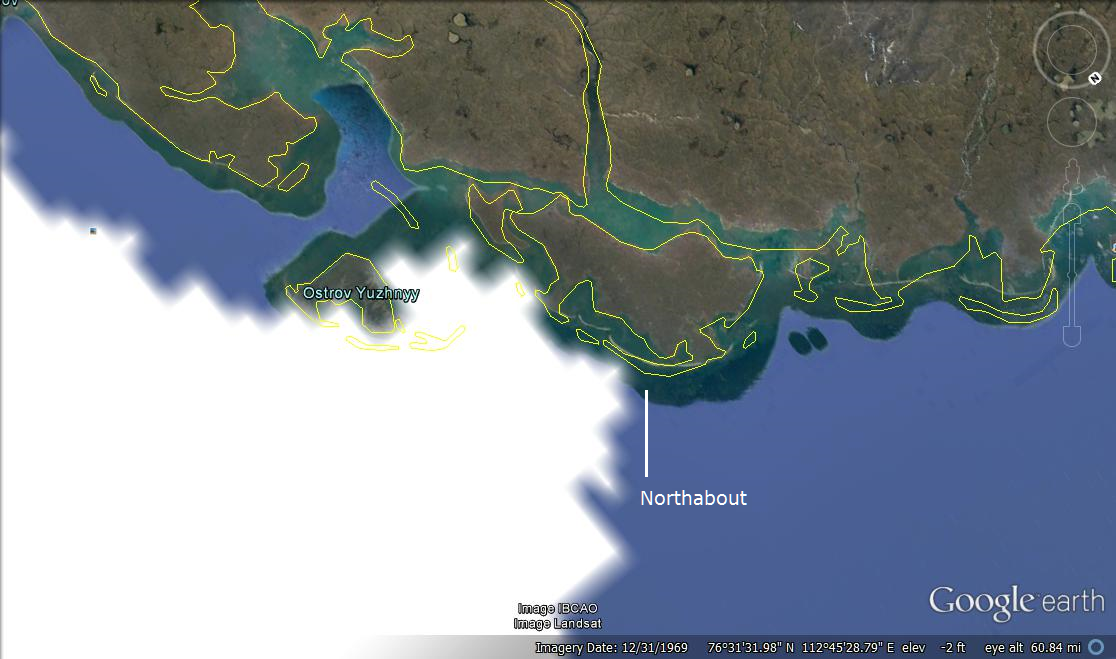
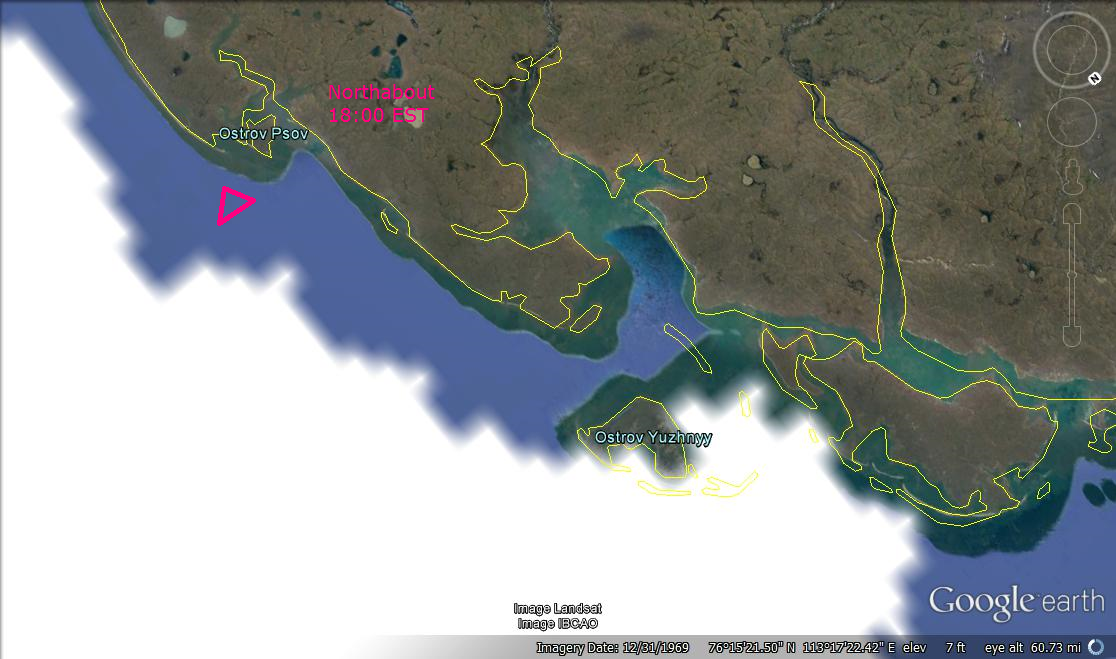
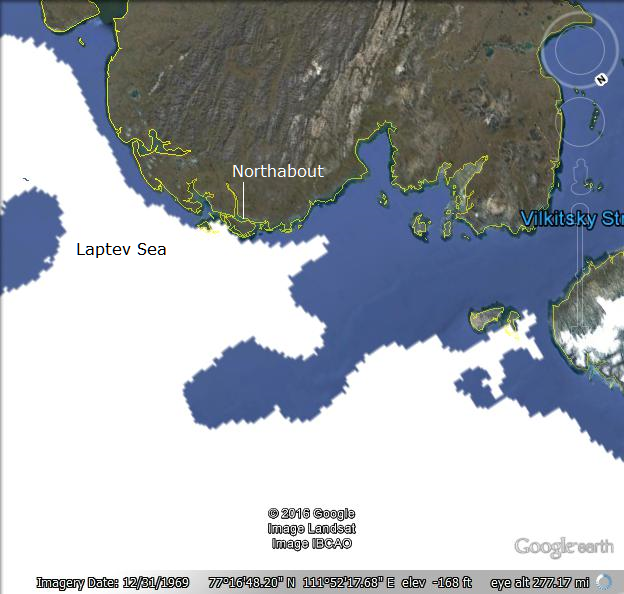
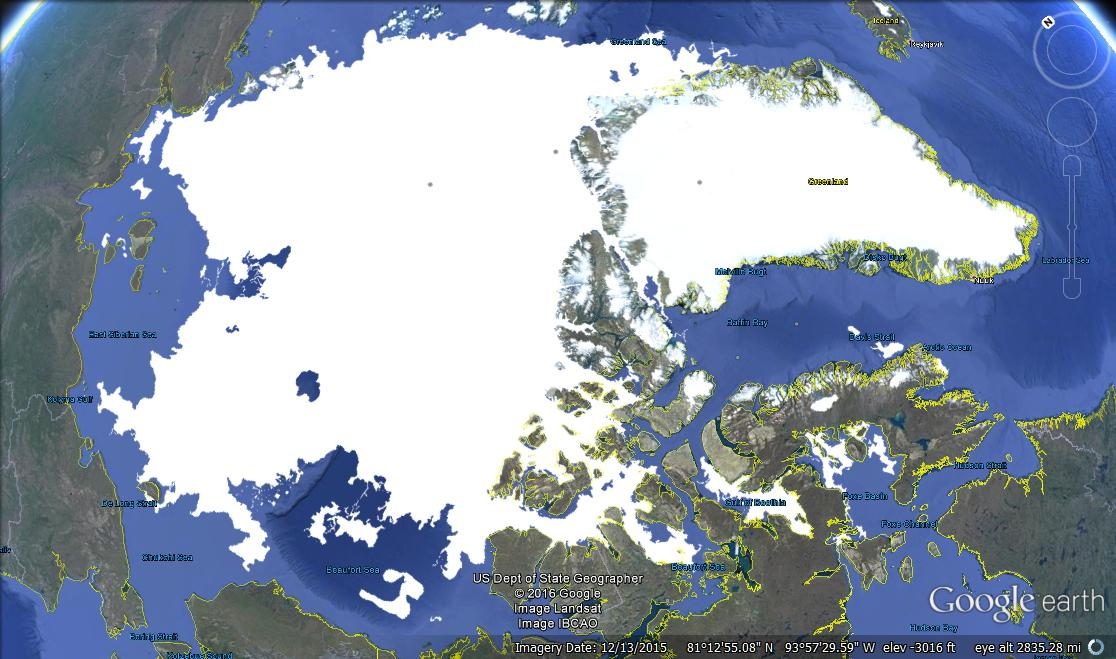
Meanwhile we can watch and appreciate the beauty of the changing ice conditions.

Arctic sea ice in summer 2015. This photo was made during an expedition of the German research icebreaker Polarstern into the central Arctic Ocean. Credit: Stefan Hendricks
Footnote: Regarding the colder than normal water in the North Atlantic
A 2016 article for EOS is entitled Atlantic Sea Ice Could Grow in the Next Decade
Changing ocean circulation in the North Atlantic could lead to winter sea ice coverage remaining steady and even growing in select regions.
The researchers analyzed simulations from the Community Earth System Model, modeling both atmosphere and ocean circulation. They found that decadal-scale trends in Arctic winter sea ice extent are largely explained by changes in ocean circulation rather than by large-scale external factors like anthropogenic warming.
From the Abstract of Yeager et al.
We present evidence that the extreme negative trends in Arctic winter sea-ice extent in the late 1990s were a predictable consequence of the preceding decade of persistent positive winter North Atlantic Oscillation (NAO) conditions and associated spin-up of the thermohaline circulation (THC). Initialized forecasts made with the Community Earth System Model decadal prediction system indicate that relatively low rates of North Atlantic Deep Water formation in recent years will result in a continuation of a THC spin-down that began more than a decade ago. Consequently, projected 10-year trends in winter Arctic winter sea-ice extent seem likely to be much more positive than has recently been observed, with the possibility of actual decadal growth in Atlantic sea-ice in the near future.