Arctic Sea Ice: Self-Oscillating System
The Climate System is Self-Oscillating: Sea Ice Proves It.
Scientists have studied the Arctic for a long time at the prestigious AARI: Arctic and Antarctic Research Institute St. Petersburg, Russia. V. F. Zakharov has published a complete description supported by research findings under this title: Sea Ice In the Climate System A Russian View (here)
Below I provide excerpts from this extensive analysis to form a synopsis of their view: Component parts of the climate system interact so that Arctic Sea Ice varies within a range constrained by those internal forces.

Self-Oscillating Sea Ice System
The most probable regulator of the physical geographical process can be found from analysis of the relationships between the components of the climate system. It is not necessary to investigate the cause-effect relationships between all these components in succession. It is sufficient to choose one of them, let us say sea ice, and consider its direct interaction with the atmosphere and the ocean – in the climate system and the significance of internal mechanisms in the natural process. Pg 1
The idea that the ice area growth at present can be achieved by changes in only the haline structure of the upper ocean layer, as a result of surface Arctic water overflowing onto warmer but more saline water, is supported both by calculations and empirical data. Pg. 46
First of all, it should be noted that the signs of temperature and salinity anomalies coincide in most cases: a decreased salinity corresponds to enhanced temperature and vice versa. Such similarity in the change of these parameters is impossible to explain from the point of view of the governing role of thermal conditions in the atmosphere with regard to the ocean, as the air temperature increase and decrease can result only in the change of the thermal state of sea surface layer not its salinity. Pgs. 48-49
Thus, the presented facts suggest that the most significant cause of changes in the ice cover extent are the changes in the vertical water structure in the upper ocean layer, rather than the changes of thermal conditions in the atmosphere. These changes are induced by fluctuations in the horizontal dimensions of the halocline, which are governed in turn by the expansion or reduction of the surface Arctic water mass. Pg. 49
It follows from the above that, under present day conditions, the changes in the area of the Arctic sea ice during the colder period of the year can be induced only by the change in the haline structure of the upper ocean layer. Indirectly, this change will also affect the thermal state of the atmosphere. Pg. 56
It is important to note that the ice effect on the atmosphere is not limited to the thermal effect. That it can produce a significant effect on atmospheric circulation is already evident from the fact that the Arctic anticyclone, considered by Viese [13] as a regulator of atmospheric processes in the Northern polar region, could form as a pressure formation only in the conditions of the ice regime in the Arctic. Pg. 56
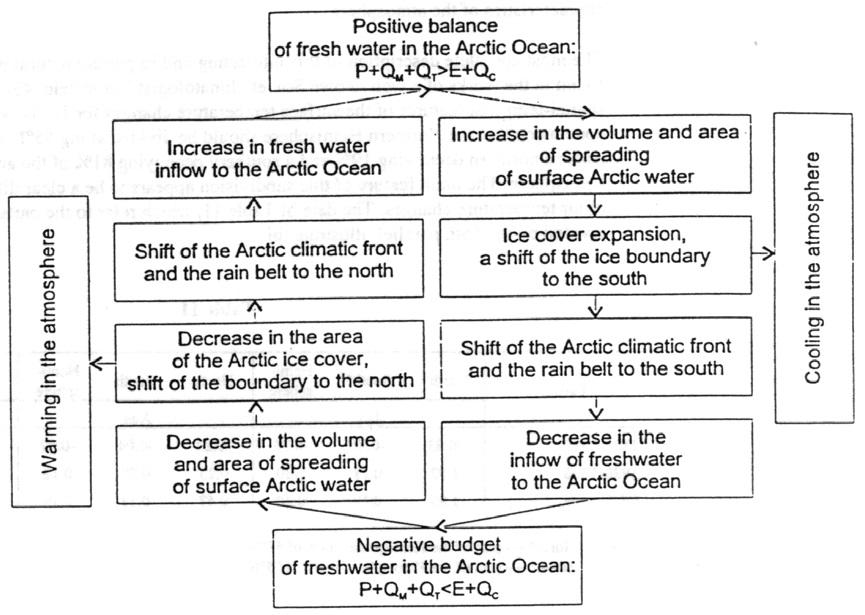
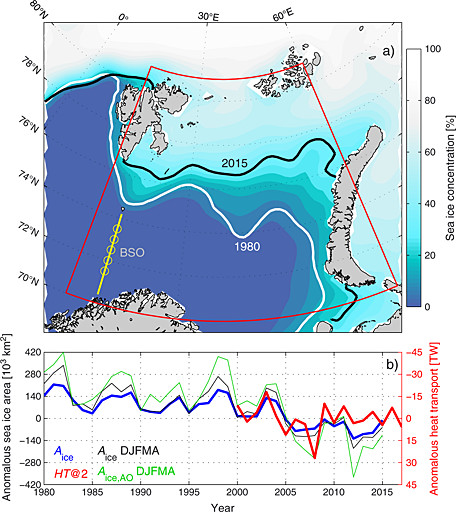
Zakharov fig.24
An analysis of cause-effect relationships does not leave any doubt in what direction and in what order the climate signal propagates in the atmosphere-ocean-polar ice system. This is not the direction and order usually assumed to cause present climate change. When it has become clear that the changes in the ocean, caused by disturbances of its freshwater balance, precede changes in the extent of sea ice, and the latter the changes in the atmosphere, then there was nothing left but for us to acknowledge self oscillation to be the most probable explanation for the development of the natural process. Pg. 58
Maybe the most convincing evidence of the Arctic sea ice stability is its preservation during the last 700,000 years despite vast glacial- interglacial fluctuations. The surface air temperature in the Arctic during the interglacial periods was higher by several degrees than present day temperatures. Pg. 44
Conclusion:
The remarkable stability of our planetary climate system derives from feedbacks between internal parts of the system, providing the oscillations we observe as natural variability. Arctic Sea Ice is a prime example.