California Newts Suffer, Because Climate Change

Two newts from Southern California, the newt on the left showing 20% reduced

Phys.org has the story:  As climate change messes with temperature and precipitation, California newts suffer by David Colgan, University of California, Los Angeles.  Excerpt in italics

That’s bad news for Los Angeles’ only newt, California newt, Taricha torosa, and other newts in the Taricha genus, particularly in the southern half of the state south of Big Sur.  A UCLA-led study, in the Nature journal Scientific Reports examined body condition of newts across their entire range, from San Diego to Mendocino. In the south, researchers discovered that body condition—a measure of health that compares weight to length—decreased by an average of 20% from 2008–2016.

Independent confirmation of the study comes in the form of California Governor Gavin Newtsom seeming to shrink before our eyes as he declared martial law on the pretext of coronavirus.

Persisting March Arctic Ice

Previous posts showed 2020 Arctic Ice breaking the 15M km2 ceiling, while wondering whether the ice will have staying power.  “Yes” is the answer, at least through the first two-thirds of March. The animation above shows ice extents over the first 20 days of March 2020 in the Pacific basins.  Bering Sea on the right grew ice until peaking at 819k km2 on day 71, 44% higher than 2019 Bering maximum.  It then declined losing 274k km2 by day 80.  Meanwhile Okhotsk Sea on the left lost 100k km2 by day 72 before gaining back 65k km2.

The animation above shows ice extents on the Atlantic side fluctuating and helping offset Pacific ice losses. On the left Baffin Bay and Gulf of St. Lawrence fluctuate but end the period with nearly the same ice as at the beginning. In the center Greenland Sea ice was steady the first week and then added 116k km2 up to day 80.  On the right Barents Sea lost 130k km2 up to day 73, then gained 140k km2 back by day 80.

By end of February, ice extent this year was well above the 13- year average, then dipped lower before growing again to match the average and surplus to other years including 2007.  This is important since March monthly average is considered the ice extent maximum for the year. Note also that SII is matching and at times exceeds the MASIE estimates.

The chart below shows the distribution of ice across the various regions comprising the Arctic zone.

Region 2020080 Day 080 Average 2020-Ave. 2007080 2020-2007
 (0) Northern_Hemisphere 14901276 14873303 27972 14547397 353879
 (1) Beaufort_Sea 1070655 1070207 448 1069711 944
 (2) Chukchi_Sea 966006 965780 226 966006 0
 (3) East_Siberian_Sea 1087137 1087135 3 1087137 0
 (4) Laptev_Sea 897845 897799 46 897845 0
 (5) Kara_Sea 934902 917684 17218 912117 22785
 (6) Barents_Sea 749134 620285 128849 583698 165436
 (7) Greenland_Sea 688025 628250 59776 606689 81336
 (8) Baffin_Bay_Gulf_of_St._Lawrence 1494573 1537332 -42760 1392468 102105
 (9) Canadian_Archipelago 854282 852953 1330 852767 1516
 (10) Hudson_Bay 1260903 1260407 497 1259717 1186
 (11) Central_Arctic 3248013 3223120 24893 3239953 8060
 (12) Bering_Sea 543951 757159 -213208 836184 -292233
 (13) Baltic_Sea 13401 80508 -67107 83894 -70492
 (14) Sea_of_Okhotsk 1083325 958236 125089 739985 343340

As of yesterday, Day 2020071 matches the NH 13-year average and also most regions.  Bering Sea is the main deficit to average along with Baffin Bay and Baltic Sea. Offsetting surpluses appear in Barents and Okhotsk Seas, as well as Greenland Sea and Central Arctic and Barents Sea. Note Okhotsk sea ice is almost 50% more than the extent in 2007.


Arctic Ice Power Mid March

Previous posts showed 2020 Arctic Ice breaking the 15M km2 ceiling, while wondering whether the ice will have staying power.  “Yes” is the answer, at least through the first third of March.

By end of February, ice extent this year was well above the 13- year average, then dipped lower before growing again surplus to average and other recent years.  This is important since March monthly average is considered the ice extent maximum for the year. Note also the SII is matching and currently exceeding the MASIE estimates.

The chart below shows the distribution of ice across the various regions comprising the Arctic zone.

Region 2020071 Day 071 Average 2020-Ave. 2018071 2020-2018
 (0) Northern_Hemisphere 15015552 15016528 -976 14608334 407218
 (1) Beaufort_Sea 1070655 1070115 540 1070445 210
 (2) Chukchi_Sea 966006 965984 22 966006 0
 (3) East_Siberian_Sea 1087137 1087135 3 1087137 0
 (4) Laptev_Sea 897845 897645 200 897845 0
 (5) Kara_Sea 930542 923821 6721 933916 -3374
 (6) Barents_Sea 658816 625730 33086 679863 -21047
 (7) Greenland_Sea 617321 624974 -7654 526061 91259
 (8) Baffin_Bay_Gulf_of_St._Lawrence 1516513 1597523 -81010 1488350 28163
 (9) Canadian_Archipelago 854282 852766 1517 853109 1174
 (10) Hudson_Bay 1260903 1259848 1055 1260838 66
 (11) Central_Arctic 3248013 3215629 32384 3172178 75835
 (12) Bering_Sea 818900 738395 80505 401469 417431
 (13) Baltic_Sea 14681 87191 -72510 130767 -116086
 (14) Sea_of_Okhotsk 1062110 1048073 14037 1120721 -58611

As of yesterday, Day 2020071 matches the NH 13-year average and also most regions.  Two deficits to average are in Baffin Bay and Baltic Sea, offset by surpluses in Bering and Okhotsk, as well as Central Arctic and Barents Sea. Note current Bering Sea ice is twice the extent in 2018.


Arctic Ice Exceeds Expectations March 5

Update on Large Arctic Ice Extents as of March 5, 2020

After crashing through the 15M km2 ceiling, both MASIE and SII show the extents holding over that amount.

In addition to surpluses in Bering and Okhotsk Seas in the Pacific, Barents Sea is now growing significant ice on the European side. At 823k km2, Bering is 145% of 2019 maximum, while Barents is 94% of 2019 max.

Background from Previous Posts

As noted in a previous February post, March marks the moment of truth regarding the Arctic maximum extent. Ten days later 2020 met the challenge.

For ice extent in the Arctic, the bar is set at 15M km2. The average in the last 13 years occurs on day 62 at 15.04M before descending. Six of the last 13 years were able to clear 15M, but recently only 2014 and 2016 ice extents cleared the bar at 15M km2; the others came up short.

As of yesterday, 2020 cleared 15M km2 as recorded both by MASIE and SII.

During February MASIE and SII both show ice extent hovering around the 13 year average, matching it exactly on day 52 at 14.85M km2. Then the ice cover shrank before growing strongly the last five days to overtake the 13 year average on day 61 at 15.05M km2.

Region 2020060 Day 060 Average 2020-Ave. 2018060 2020-2018
 (0) Northern_Hemisphere 14999007 14987840 11167 14535979 463028
 (1) Beaufort_Sea 1070655 1070222 433 1070445 210
 (2) Chukchi_Sea 965972 963804 2168 965971 1
 (3) East_Siberian_Sea 1087137 1087039 98 1087120 18
 (4) Laptev_Sea 897845 897824 21 897845 0
 (5) Kara_Sea 919052 928455 -9403 921526 -2474
 (6) Barents_Sea 735450 634497 100953 512601 222848
 (7) Greenland_Sea 596926 621572 -24646 518130 78796
 (8) Baffin_Bay_Gulf_of_St._Lawrence 1464407 1544205 -79798 1783076 -318669
 (9) Canadian_Archipelago 854282 853074 1209 853109 1174
 (10) Hudson_Bay 1260887 1260890 -2 1260838 49
 (11) Central_Arctic 3247904 3211522 36382 3087802 160103
 (12) Bering_Sea 746111 674028 72083 340789 405322
 (13) Baltic_Sea 30173 103770 -73598 134750 -104577
 (14) Sea_of_Okhotsk 1110709 1097753 12956 1079823 30886

As reported previously, Pacific sea ice is a big part of the story this year.  Out of the last 13 years, on day 52 only two years had Okhotsk ice extent higher than 2020, and only four years had higher Bering ice. Those surpluses offset a small deficit in Greenland Sea ice. And on day 61, the last push came from Bering and Okhotsk.

Typically, Arctic ice extent loses 67 to 70% of the March maximum by mid September, before recovering the ice in building toward the next March.

What will the ice do this year?  Where will 2020 rank in the annual Arctic Ice High Jump competition?

Drift ice in Okhotsk Sea at sunrise.


Arctic Ice Abounds March 1

As noted in a previous post ten days ago, March marks the moment of truth regarding the Arctic maximum extent. Now ten days later 2020 met the challenge.

For ice extent in the Arctic, the bar is set at 15M km2. The average in the last 13 years occurs on day 62 at 15.04M before descending. Six of the last 13 years were able to clear 15M, but recently only 2014 and 2016 ice extents cleared the bar at 15M km2; the others came up short.

As of yesterday, 2020 cleared 15M km2 as recorded both by MASIE and SII.

During February MASIE and SII both show ice extent hovering around the 13 year average, matching it exactly on day 52 at 14.85M km2. Then the ice cover shrank before growing strongly the last five days to overtake the 13 year average on day 61 at 15.05M km2.

Region 2020060 Day 060 Average 2020-Ave. 2018060 2020-2018
 (0) Northern_Hemisphere 14999007 14987840 11167 14535979 463028
 (1) Beaufort_Sea 1070655 1070222 433 1070445 210
 (2) Chukchi_Sea 965972 963804 2168 965971 1
 (3) East_Siberian_Sea 1087137 1087039 98 1087120 18
 (4) Laptev_Sea 897845 897824 21 897845 0
 (5) Kara_Sea 919052 928455 -9403 921526 -2474
 (6) Barents_Sea 735450 634497 100953 512601 222848
 (7) Greenland_Sea 596926 621572 -24646 518130 78796
 (8) Baffin_Bay_Gulf_of_St._Lawrence 1464407 1544205 -79798 1783076 -318669
 (9) Canadian_Archipelago 854282 853074 1209 853109 1174
 (10) Hudson_Bay 1260887 1260890 -2 1260838 49
 (11) Central_Arctic 3247904 3211522 36382 3087802 160103
 (12) Bering_Sea 746111 674028 72083 340789 405322
 (13) Baltic_Sea 30173 103770 -73598 134750 -104577
 (14) Sea_of_Okhotsk 1110709 1097753 12956 1079823 30886

As reported previously, Pacific sea ice is a big part of the story this year.  Out of the last 13 years, on day 52 only two years had Okhotsk ice extent higher than 2020, and only four years had higher Bering ice. Those surpluses offset a small deficit in Greenland Sea ice. And on day 61, the last push came from Bering and Okhotsk.

Typically, Arctic ice extent loses 67 to 70% of the March maximum by mid September, before recovering the ice in building toward the next March.

What will the ice do this year?  Where will 2020 rank in the annual Arctic Ice High Jump competition?

Drift ice in Okhotsk Sea at sunrise.


Storm Ciara, Caused by Meghan?

Trains, flights and ferries have been cancelled and weather warnings issued across the United Kingdom as a storm with hurricane-force winds up to 129 km/h (80 mph) battered the region.

A strange new twist in climate science attribution of blame for extreme weather.  From the NewsThump Storm Ciara causing chaos across the nation: is it Meghan’s fault?  Excerpts in italics with my bolds.

Storm Ciara is causing travel and infrastructure chaos across the country and experts are suggesting that this first American sounding storm of the year could be the fault of Meghan Markle, Duchess of Sussex.

“It is certainly conceivable that Meghan has some sort of weather control device that she has used to bring Storm Ciara to Great Britain,” explained Simon Williams, a man in the pub who regularly watches Britain’s Wildest Weather.

“Either that or she’s got strange witchy powers that allow her to control the weather like she controls poor Harry.

“Whichever it is, it’s definitely her fault. I mean, look at the evidence – the storm hits just a few days after they moved to Canada.

“Mark my words, this storm wreaking havoc to the country that was fine till she came along? All Meghan’s fault.”

Popular trumpet of idiocy Piers Morgan was so apoplectic with rage that he simultaneously soiled himself, vomited and bleed from various orifices at the mere mention of the Duchess.

“Meghan. Royals. Arrogant,” he spluttered incoherently before calming down enough to make the following statement.

“Now look, I’m not racist,” said the man who is only angry at the black one.

“But this is what happens when you let people from different cultures into the Royal Family, they don’t really understand the ancient sophisticated British royal way of life, so they go around causing big storms.”

It is expected that the storm could bring further disruption to those communities recovering from last year’s floods.

Which were also definitely Meghan’s fault.


Arctic Ice Moment of Truth

For ice extent in the Arctic, the bar is set at 15M km2. The average in the last 13 years occurs on day 62 at 15.04M before descending. Six of the last 13 years were able to clear 15M, but recently only 2014 and 2016 ice extents cleared the bar at 15M km2; the others came up short.

During February MASIE and SII both show ice extent hovering around the 13 year average, matching it exactly on day 52 at 14.85M km2. Other recent years were lower until 2019 caught up, before dropping off in the final week of the month.  We shall see what this year does with only 10 to 14 days left before the March maximum is recorded.

Region 2020052 Day 052 Average 2020-Ave. 2018052 2020-2018
 (0) Northern_Hemisphere 14875470 14857903 17567 14312247 563223
 (1) Beaufort_Sea 1070655 1070222 433 1070445 210
 (2) Chukchi_Sea 965972 964814 1158 955104 10868
 (3) East_Siberian_Sea 1087137 1087039 98 1087120 18
 (4) Laptev_Sea 897845 897824 21 897845 0
 (5) Kara_Sea 906378 917433 -11055 917969 -11591
 (6) Barents_Sea 648148 613817 34332 552077 96071
 (7) Greenland_Sea 538698 613963 -75264 428606 110092
 (8) Baffin_Bay_Gulf_of_St._Lawrence 1502218 1495888 6330 1757430 -255211
 (9) Canadian_Archipelago 854282 853074 1209 853109 1174
 (10) Hudson_Bay 1259931 1260881 -950 1260838 -907
 (11) Central_Arctic 3246709 3213870 32839 3150241 96468
 (12) Bering_Sea 731776 685013 46763 194708 537067
 (13) Baltic_Sea 25524 104858 -79334 94201 -68677
 (14) Sea_of_Okhotsk 1117881 1022253 95628 1060733 57148

As reported previously, Pacific sea ice is a big part of the story this year.  Out of the last 13 years, on day 52 only two years had Okhotsk ice extent higher than 2020, and only four years had higher Bering ice. Those surpluses offset a small deficit in Greenland Sea ice.

Typically, Arctic ice extent loses 67 to 70% of the March maximum by mid September, before recovering the ice in building toward the next March.

What will the ice do this year?  Where will 2020 rank in the annual Arctic Ice High Jump competition?

Drift ice in Okhotsk Sea at sunrise.


Two of Four Seasons Gone, Because Climate Change

From the NewsThump, Vivaldi’s Four Seasons reduced to Two in light of climate change.  Excerpts in italics with my bolds.

Antonio Vivaldi’s Four Seasons concerti will now consist of just two seasons, because that’s all there are these days.

The conductor of the London Philharmonic Orchestra Simon Williams commented, “The current generation doesn’t really understand the idea of four different seasons of weather, so in a bid to appeal to a modern audience we’ve updated the concerti to be more representative of 300 years of environmental damage.

“Overall, the suite will be much more discordant and unpredictable. The part representing winter will be doubled in length and feature woodwind solos to signify the yearly rising of floodwaters. A choir of scientists will sing the aria ‘Te Lo Abbiamo Detto’ (We Told You So).

Spring and autumn will be done away with altogether.

“Summer has also been greatly extended, as has the ‘languor caused by the heat’ bit, occasionally broken up strings phrases to represent next door’s kids on the trampoline.”


Tallest Climate Tale Winner

Thanks to GWPF for honoring my submission nominating the Tallest Climate Tale of 2019. Their post is We Have A Winner: Tallest Climate Tale of 2019 Text below in italics.Date: 12/02/20GWPF

We have been deliberating hard, and have decided upon a winner for our competition.

At the start of the year, we asked GWPF readers to send us nominations for our search to find the tallest climate tale of 2019. You have not let us down, sending us in entries from around the world.

An honourable mention must go to last year’s winner, Andrew Kissling, from New Zealand, who delivered the goods yet again. Amongst his excellent entries were an article claiming child marriage was increasing because of climate change, and that chips are now an inch shorter, and climate change is to blame.

However, topping the list this year was Ron Clutz, who many of you may be familiar with from his blog, Science Matters. The judges felt that his entry captured perfectly the absurdity of today’s climate change debate.

The article claimed that rational thought itself may become a victim of climate change. We at the GWPF know that rational discussion about climate change is already very rare.

Congratulations to Ron, who wins a bottle of whisky and two GWPF books (Population Bombed and The Polar Bear Catastrophe that Never Happened).

Original Post:  CO2 Hysteria Impairs Thinking

An article by James Pero at Daily Mail confirms suspicions about muddled thinking regarding global warming/climate change.  Is carbon dioxide making it harder to THINK straight?   Excerpts in italics with my comments and images.

Rising CO2 levels may hinder cognitive function and could decrease decision-making efficiency by 50 PERCENT in 2100, study says. 

  • Carbon emissions may have a drastic impact on cognitive function
  • Researchers say that CO2 may decrease classroom decision making
  • It could reduce decision making by as much as 50 percent in 2100, they say

Rational thought may eventually become a victim of climate change according to a new study.

[Well, media announcements and studies like this one show rationality is already greatly compromised.]

Research presented by scientists at the annual American Geophysical Union and submitted to the journal GeoHealth suggests that increased CO2 may soon diminish humans’ capacity to think clearly.

The findings follow previous studies that show how indoor air pollution and poor ventilation can hinder people’s ability to perform mentally, including a study published last year from the University College London.

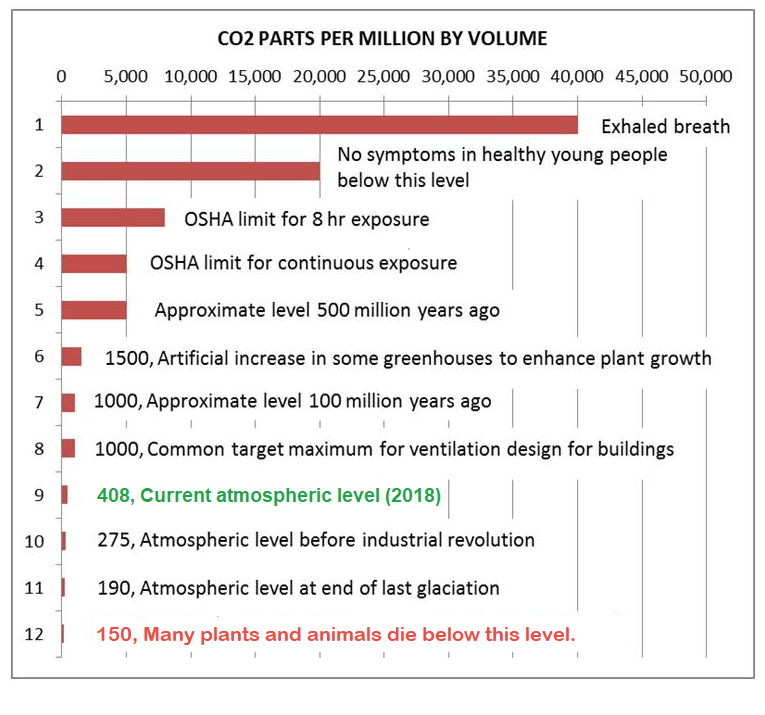
[Note the chart at the top showing that CO2 in the atmosphere is 410ppm (parts/per/million), or 0.04%.  Note also that health and safety regulations for buildings expect no harmful effects below 5000 ppm, which would be 10 times the present amount.]

‘Human cognitive performance declines with an increase in CO2’, the researchers wrote in the paper.

‘Direct impacts of CO2 emissions on human cognitive performance may be unavoidable.’

Those studies concluded that circulating air and regulating the amount of CO2 trapped in a room can help mitigate the effects of too much CO2, but new research suggests ventilation in a climate change-addled future might just make matters worse.

[This diagram shows the ratio of human to natural carbon dioxide in the atmosphere equals the ratio of their inflows, independent of residence time.

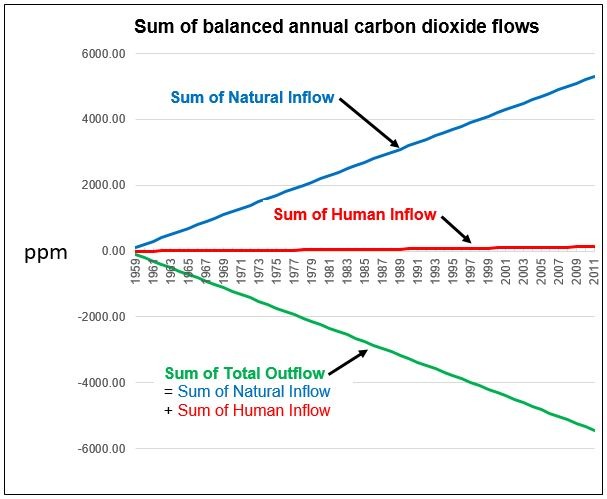
The amount of CO2 flowing from humans into the atmosphere is miniscule (about 4%) compared to CO2 flowing from the oceans and biosphere (96%).  Thus the human component presently is 17ppm (or 0.002%).  Eliminating our emissions entirely would have no discernable impact on the total amount.  See Who to Blame for Rising CO2?]

It also used two different climate models – one that factors in reductions in CO2 and another that projects conditions if emissions continue unfettered.

In the model that factors in some emissions intervention, scientists say decision making in the classroom could decrease by 25 percent while a model without emissions mitigation could see a whopping 50 percent reduction.

Though previous studies have shown a correlation between brain function and CO2, not much is currently understood about why the gas affects our brains the way it does.

As noted by Gizmodo, a previous study on CO2’s correlation to brain function showed that an increase as little as 5 percent had reduces brain activity.

[Let’s see: A 5% increase in CO2 would be a leap from 0.041% to 0.043%, requiring some fine sensors to even detect it.  Doubtful that brains are that sensitive to the gas itself, but obviously there is huge sensitivity to the idea of rising CO2.

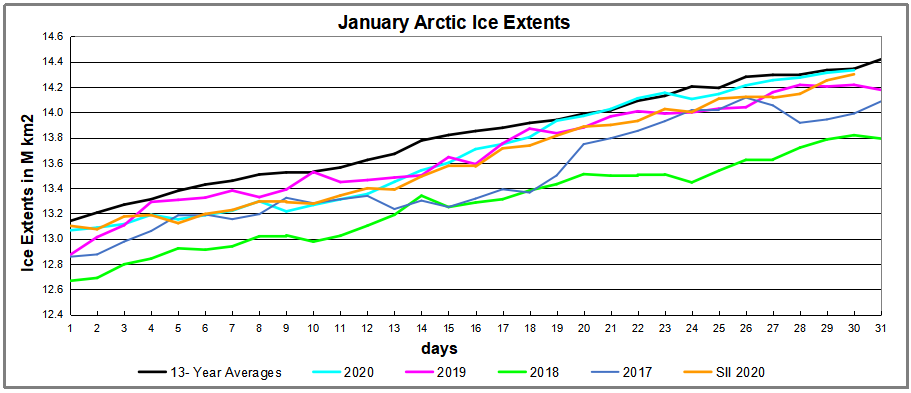
OTOH plants have sensed and appreciated the increased CO2 as shown in the greening of the planet since 1982]
No current research has studied the kind of long-term exposure that will would result from rampant climate change.

As noted by researchers, however, all of the adverse effects of CO2 on mental performance can still be averted by making a concerted effort to lower emissions and stave off climate change.

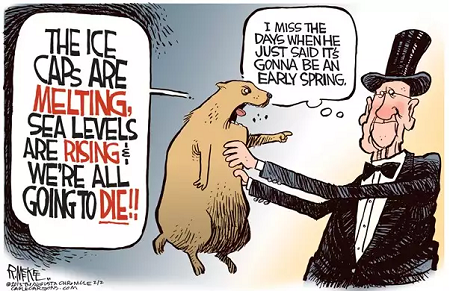
This is your brain on CO2 hysteria. Just say no!


Jan. 30 Ordinary Arctic Ice

A previous post noted the Pacific ice see saw had returned, with Bering Sea slow to recover.  The image above shows that now both Pacific seas are recovering ice strongly in the second half of January 2020. As supported by the table later, the pace of refreezing was slow to begin but 2020 extents are now quite ordinary and tracking the 13 year average (2007 to 2019 inclusive). Okhotsk Sea on the left has steadily grown 250k km2 ice extent to be currently at 68% of last March maximum.  Bering on the right added 170k km2 and now exceeds last March max by 3%.

On the Atlantic side there has also been some ice growth on the margins.  Notably Barents Sea on the right has added 160k km2 to exceed its average by 40%, and is now 95% of last March max.  Also visible on the upper left is ice forming in the Gulf of St. Lawrence and Baffin Bay ice slowly extending south. The graph below shows the ice extent growing during January compared to some other years and the 13 year average (2007 to 2019 inclusive).

Note that the  NH ice extent 13 year average increases about 1.2M km2 during January, up to 14.4M km2. MASIE 2020 stated with a slower icing rate, dropping 300k km2 lower than average before catching up to reaching the average on January 19 and tracking closely since.  Other years were lower at this point, while MASIE and SII 2020 are showing nearly the same extents.

The table shows where the ice is distributed compared to average.  Deficits in Greenland Sea and Baffin Bay are offset by a 230k km2 surplus of Barents Sea ice.  At this point the surplus in Okhotsk exceeds the Bering deficit. 

Region 2020030 Day 030 Average 2020-Ave. 2018030 2020-2018
 (0) Northern_Hemisphere 14333538 14344185  -10647  13819038 514500 
 (1) Beaufort_Sea 1070655 1070223  432  1070445 210 
 (2) Chukchi_Sea 965972 965999  -27  965971
 (3) East_Siberian_Sea 1087137 1087133  1087120 18 
 (4) Laptev_Sea 897845 897842  897845
 (5) Kara_Sea 934901 914385  20515  880656 54245 
 (6) Barents_Sea 783310 553930  229380  471973 311337 
 (7) Greenland_Sea 482444 588685  -106241  506539 -24094 
 (8) Baffin_Bay_Gulf_of_St._Lawrence 1260581 1347235  -86653  1384973 -124392 
 (9) Canadian_Archipelago 854282 853059  1223  853109 1174 
 (10) Hudson_Bay 1260192 1260815  -623  1260838 -646 
 (11) Central_Arctic 3212864 3207580  5284  3176620 36244 
 (12) Bering_Sea 584617 645329  -60712  402199 182419 
 (13) Baltic_Sea 12939 80631  -67693  37943 -25004 
 (14) Sea_of_Okhotsk 894008 807371  86637  763761 130247 

Footnote:  Interesting comments on January 13 by Dr. Judah Cohen at his blog regarding the Arctic fluctuations. Excerpts in italics with my bolds.

Arctic sea ice extent

The positive AO is conducive to sea ice growth and Arctic sea ice growth rate continues to grow slowly and remains well below normal but higher than recent winters; the weather pattern remains favorable for further sea ice growth. Negative sea ice anomalies exist in three regions: the Bering Sea, around Greenland-Canadian Archipelagos and Barents-Kara Seas. The anomalies in the North Pacific sector have shrunk (Figure 16), and based on model forecasts negative sea ice anomalies in the Bering Sea can shrink further in the next two weeks. Below normal sea ice in and around Greenland and the Canadian Archipelagos may favor a negative winter NAO, though there are no signs of such a scenario. Based on recent research low sea ice anomalies in the Chukchi and Bering seas favors cold temperatures in central and eastern North America while low sea ice in the Barents-Kara seas favor cold temperatures in Central and East Asia, however this topic remains controversial. Recent research has shown that regional anomalies that are most highly correlated with the strength of the stratospheric PV are across the Barents-Kara seas region where low Arctic sea ice favors a weaker winter PV.

Northern Hemisphere Snow Cover

Despite a strongly postive AO snow cover has advanced across Eurasia and is now near decadal means. And if the snowfall forecasts for Europe ever verify it could advance further. Above normal snow cover extent in October, favors a strengthened Siberian high, cold temperatures across northern Eurasia and a weakened polar vortex/negative AO this upcoming winter followed by cold temperatures across the continents of the NH.

Illustration by Eleanor Lutz shows Earth’s seasonal climate changes. If played in full screen, the four corners present views from top, bottom and sides. It is a visual representation of scientific datasets measuring Arctic ice extents and snow cover.