TV Monetizes Hurricane Irma
Weather reporters do a stand-up as the force of the winds caused by Hurricane Irma hit Miami. (Marcus Yam / Los Angeles Times)
Chicago Tribune on Sept. 11 published Swept away by TV coverage of Hurricane Irma by Dahleen Glanton, Contact Reporter.
It is a fine reflection piece by a media insider on how commercial media covers extreme weather events. She recounts her journey of discovery becoming critical and eventually repelled by the coverage from her own media colleagues. Excerpts below with my bolds.
I didn’t leave the house on Sunday. The hurricane story unfolding on my television set was too gripping to walk away for even a few minutes.
Television anchors kept warning us that much of Florida could be washed away by gigantic surges of ocean water in the aftermath of Hurricane Irma. The pictures coming out of Cuba and the Caribbean already had proved how devastating this storm could be. I was terrified for everyone in its path.
But that wasn’t the only reason I, and so many others, sat glued to the TV all day. Cable news television gave us a virtual front row seat to the developing storm, providing a riveting performance that was full of adventure, suspense and drama.
The show presented on the TV news was designed to be entertaining. It was meant to keep us captivated for hours, mesmerized by the “heroic” sacrifices of journalists who risked their lives to show us what it is like to stand outside in the midst of a deadly storm.
They described the predicted surge as “a killer water event” and the reporters vowed to run to safety before it occurred. But if we just kept watching — even through commercial breaks — they promised, we would see it for ourselves.
For many of us, this was an uneasy proposition. No one was excited about the possibility of people losing their homes and businesses, perhaps even lives, but the prospect of seeing a hurricane dance up close was too tempting to turn down.
Reporters went up to people who had ventured outside, including one man walking his three-legged dog, and warned them to go back inside before it was too late. The camera panned in on a bird as the reporter surmised that perhaps it had flown with the hurricane from as far away as Cuba. Birds follow hurricanes, he told us. These birds know when it’s safe to come out.
The reporters in their plastic rain slickers with the network’s logo on the back kept explaining that they were doing all this for us. Regardless of what the critics said about their reckless behavior, “We’re here so you don’t have to be,” they insisted.
The surge never happened Sunday, and we should be grateful for that. What we saw on TV was typical of a hurricane — howling winds, swaying trees and metal stop signs shaking in the distance. The anti-climatic ending left us confused.
How could a 10- to 15-foot surge hyped all day long for Florida’s west coast suddenly turn into one of about 3 feet? How could TV meteorologists presented on air as experts and reporters billed as experienced storm chasers get it so wrong?
I still don’t know the answers. But it didn’t take long to figure out that the cable news coverage from Florida on Sunday wasn’t about us at all. It was all about their ratings.
This was a new experience for me. For more than a decade, I covered hurricanes in the South for the Tribune. Hunkered down in Mississippi during Hurricane Katrina, I never had the chance to see how a big storm was covered on national TV.
What I saw on Sunday was both shocking and intriguing.
As a journalist who has covered many hurricanes and tornadoes, I know what it takes to tell a story. Standing in front of a water-splashed camera holding a limb from a fallen tree is not necessary to show the strength of a storm.
I understand that television relies on the power of optics. It is true that a TV camera can paint a picture much more vividly than I could by writing about it on a computer.
While I’m sure some people who have relatives and friends in Florida were grateful for the in-depth coverage, too much of what we saw on Sunday was manufactured drama. Networks took advantage of a heartbreaking situation and made a mockery of it.
Surfing through the channels, the visuals were all the same. Reporters, wobbling in the bristling wind, their words barely audible as they attempted to convince us that it was OK for them to do what they were warning others not to do.
In one scene, a reporter tried to convince us that the concrete wall he was standing in front of would protect him from the surge. He demonstrated how he could bend down and take refuge from the wind if he needed to.
In the same breath, he warned of flying debris — roof shingles and street signage that could transform into projectiles so fierce that they could knock you out.
On another channel, a well-known meteorologist swayed and stumbled on a sidewalk while the eye of the hurricane went through Naples, Fla. The wind nearly took his breath away and viewers could barely understand what he was saying.
When we did manage to hear a thing or two, it was nothing of importance.
“This is a mid-level Category 3. Imagine if it was a Category 4 or 5?” he boasted. “This is a story you can tell your children and grandchildren.”
The anchor watching from the studio in New York seemed somewhat embarrassed. He offered this explanation for the perilous acts.
“So we can see what this does to our natural bodies and our world,” he said.
There were no surprises, though. We saw exactly what we expected to see when someone is standing outside in a hurricane.
The irony is that the people who would perhaps benefit from such a display didn’t get to see it at all. Millions of people across Florida were without electricity during the height of the storm.
It’s probably safe to bet they weren’t using up their limited cell phone access watching a news anchor in New York explaining what was going on in their back yards.
This show wasn’t meant for them at all. It was for people like you and me who were sitting in our nice dry homes with a bag of popcorn in one hand and the TV remote control in the other.
All of us should be honest about that.
dglanton@chicagotribune.com
Conclusion:
This could be a tipping point. We may be witnessing the dawning of skeptical awareness at the Chicago Tribune, bastion of political correctness regarding all things climate related. One of their own catches them “Jumping the Shark.”
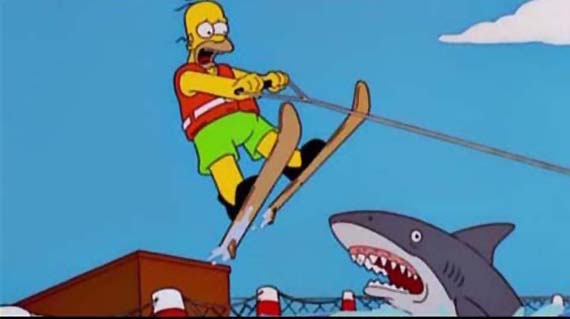
“Jumping the shark” is attempting to draw attention to or create publicity for something that is perceived as not warranting the attention, especially something that is believed to be past its peak in quality or relevance. The phrase originated with the TV series “Happy Days” when an episode had Fonzie doing a water ski jump over a shark. The stunt was intended to perk up the ratings, but it marked the show’s low point ahead of its demise.


 For context and scientific perspective we can turn to papers like this one: