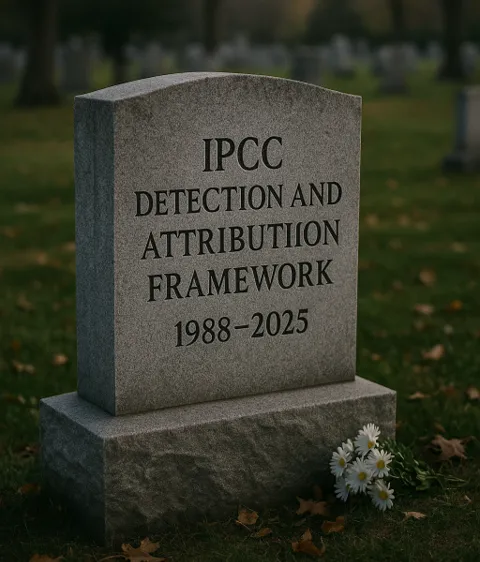
RIP. You did good science and for that we are grateful.
Roger Pielke Jr. alerts us to a dangerous development in the IPCC effort claiming loss and damage from using hydrocarbons. His blog article is A Takeover of the IPCC.
The IPCC’s longstanding framework for detection and attribution looks DOA in AR7
Pielke: The Intergovernmental Panel on Climate Change (IPCC) has just released the names of its authors for its seventh assessment report (AR7). The author list for its Chapter 3 — Changes in regional climate and extremes, and their causes — suggests strongly that the IPCC will be shifting from its longstanding focus on detection and attribution (D&A) of extreme events to a focus on “extreme event attribution” (EEA).
The IPCC AR6 was decidedly lukewarm to freezing cold on the notion of EEA, and emphasized the traditional D&A framework. Those days may now be over. World Weather Attribution (WWA) co-founder Frederika Otto has been put in charge of the chapter, along with another academic who focuses on extreme event attribution.
Pielke has a series of articles taking exception to EEA methods and claims. This post is a synopsis of work by Patrick Brown on the same issue, which is likely to be featured by climatists in the days and months ahead.

How Climate Attribution Studies Become Devious and Untrustworthy
Patrick Brown raises the question Do Climate Attribution Studies Tell the Full Story? Excerpts in italics with my bolds and added images, his analysis concluding thusly:
How a cascade of selection effects bias
the collective output of extreme event attribution studies.
Weather and climate extremes—such as high temperatures, floods, droughts, tropical cyclones, extratropical cyclones, and severe thunderstorms—have always threatened both human and natural systems. Given their significant impacts, there is considerable interest in how human-caused climate change influences these extremes. This is the focus of the relatively new discipline of Extreme Event Attribution (EEA).
Over the past couple of decades, there has been an explosion in EEA studies focusing on (or, “triggered by”) some prior notable weather or climate extreme. Non-peer-reviewed reports from World Weather Attribution (e.g., here, here, and here) represent some of the most notable examples of these kinds of analyses, and many similar studies also populate the peer-reviewed literature. The Bulletin of the American Meteorological Society’s “Explaining Extreme Events From a Climate Perspective” annual series compiles such studies, as does the Sabin Center for Climate Change Law, and they are also synthesized in reports like those from the IPCC (IPCC WG1 AR6 Chapter 11.2.3) and the United States National Climate Assessment.
The collective output of these kinds of studies certainly gives the impression that human-caused climate change is drastically changing the frequency and intensity of all kinds of weather extremes. Indeed, Carbon Brief recently published an extensive summary of the science of EEA studies, which begins with the proclamation, “As global temperatures rise, extreme weather events are becoming more intense and more frequent all around the world.”
However, these numbers cannot be taken as an accurate quantification of the influence of climate change on extreme weather because they are heavily influenced by a cascade of selection biases originating from the physical climate system, as well as researcher and media incentives. Identifying and understanding these biases is a prerequisite for properly interpreting the collective output of EEA studies and, thus, what implications they hold for general scientific understanding, as well as political and legal questions.

The large apparent discrepancy between the size of the influence of human-caused climate change on extreme weather reported in EEA studies (like those compiled by Carbon Brief) compared to more comprehensive systematic analyses (like those compiled by the IPCC) can, in large part, be attributed to the many layers of Selection Biases that influence the EEA literature’s collective output.
Selection Bias is a broad term that refers to any bias that arises from a process that selects data for analysis in a way that fails to ensure that data is representative of the broader population that the study wishes to describe.
Selection biases in the context of EEA studies include those associated with the physical climate system itself, those concerning proclivities and incentives facing researchers/journals, and those concerning the proclivities and incentives facing the media. They include
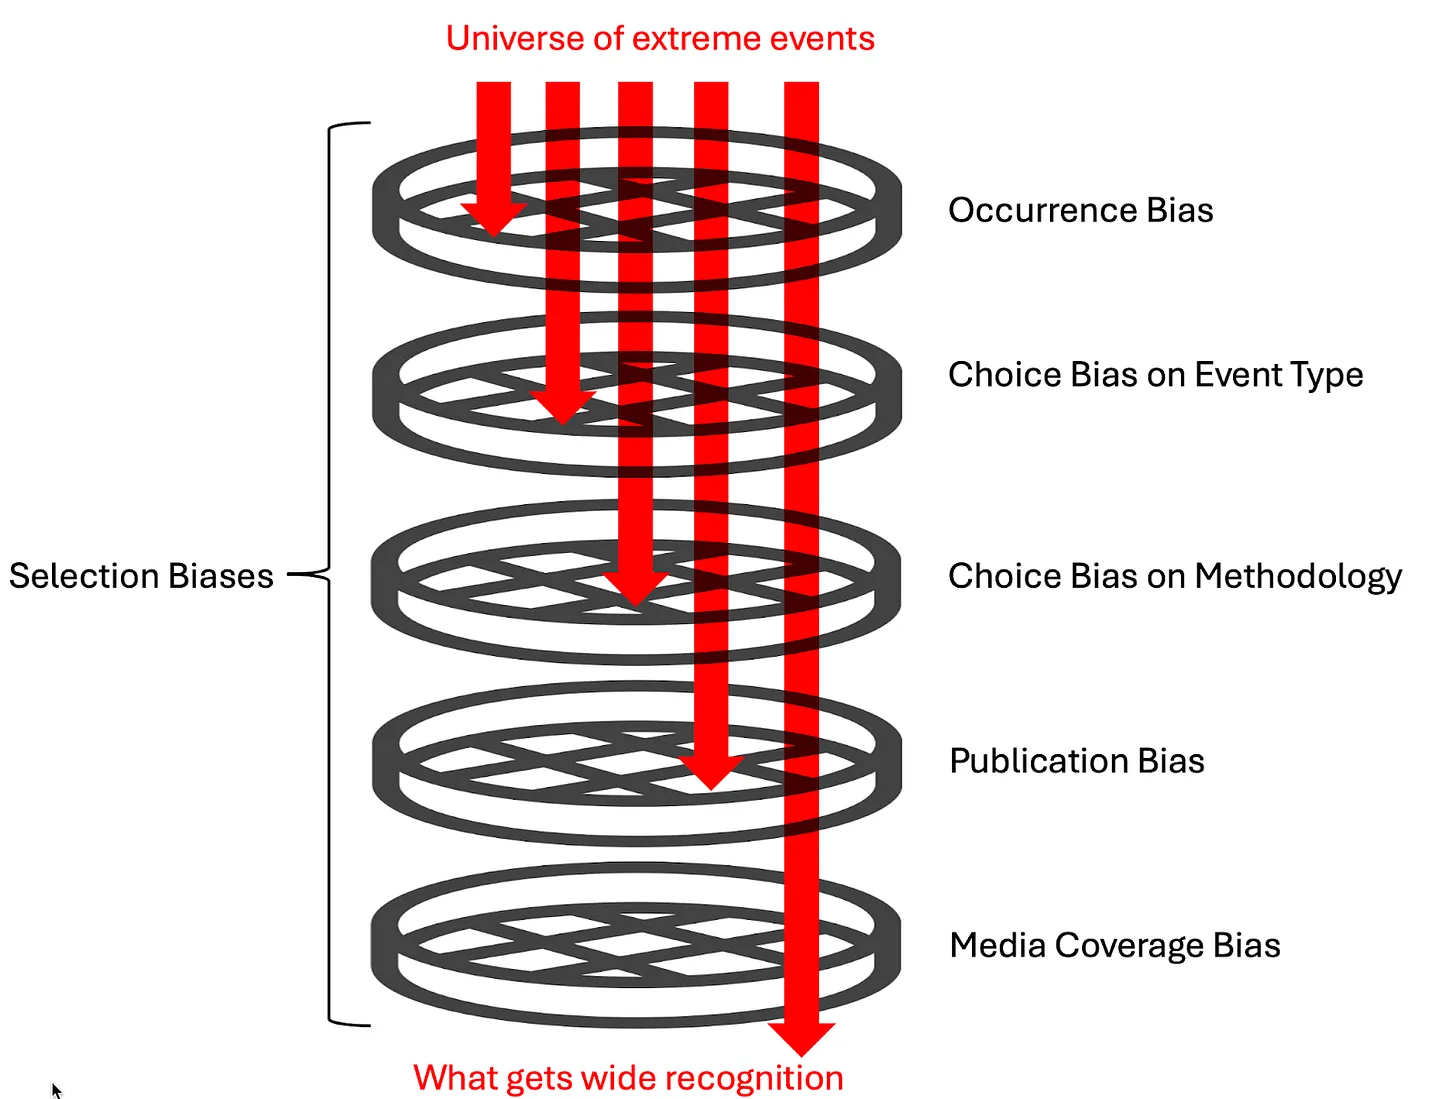
Occurrence Bias is a bias introduced by the physical climate system. Since EEA studies tend to be triggered by extreme events that have actually occurred, there is reason to believe that these studies will disproportionately sample events that are more likely than average to be exacerbated by climate change because the events occurred in the first place. Essentially, extreme events that are more likely to occur under climate change—and thus more likely to be observed—are going to be overrepresented in EEA studies, and extreme events that are less likely to occur under climate change—and thus less likely to be observed—are going to be underrepresented in EEA studies.
The map below illustrates this phenomenon. It shows changes in the magnitude of extreme drought under climate change. Specifically, it shows the fractional change in the intensity of once-per-50-year droughts (as quantified by monthly soil moisture) between a preindustrial and 21st-century run (SSP2-4.5 emissions) of the highly-regarded NCAR CESM2 Climate Model. Blue areas represent locations where the model simulates that extreme droughts become less frequent and intense with enhanced greenhouse gas concentrations, and red areas represent locations where the model simulates that extreme droughts become more frequent and intense with enhanced greenhouse gas concentrations. It is notable that overall, this model simulates that warming decreases the frequency and intensity of extreme drought in more locations than it increases it (consistent with soil moistening under warming simulated by other models).
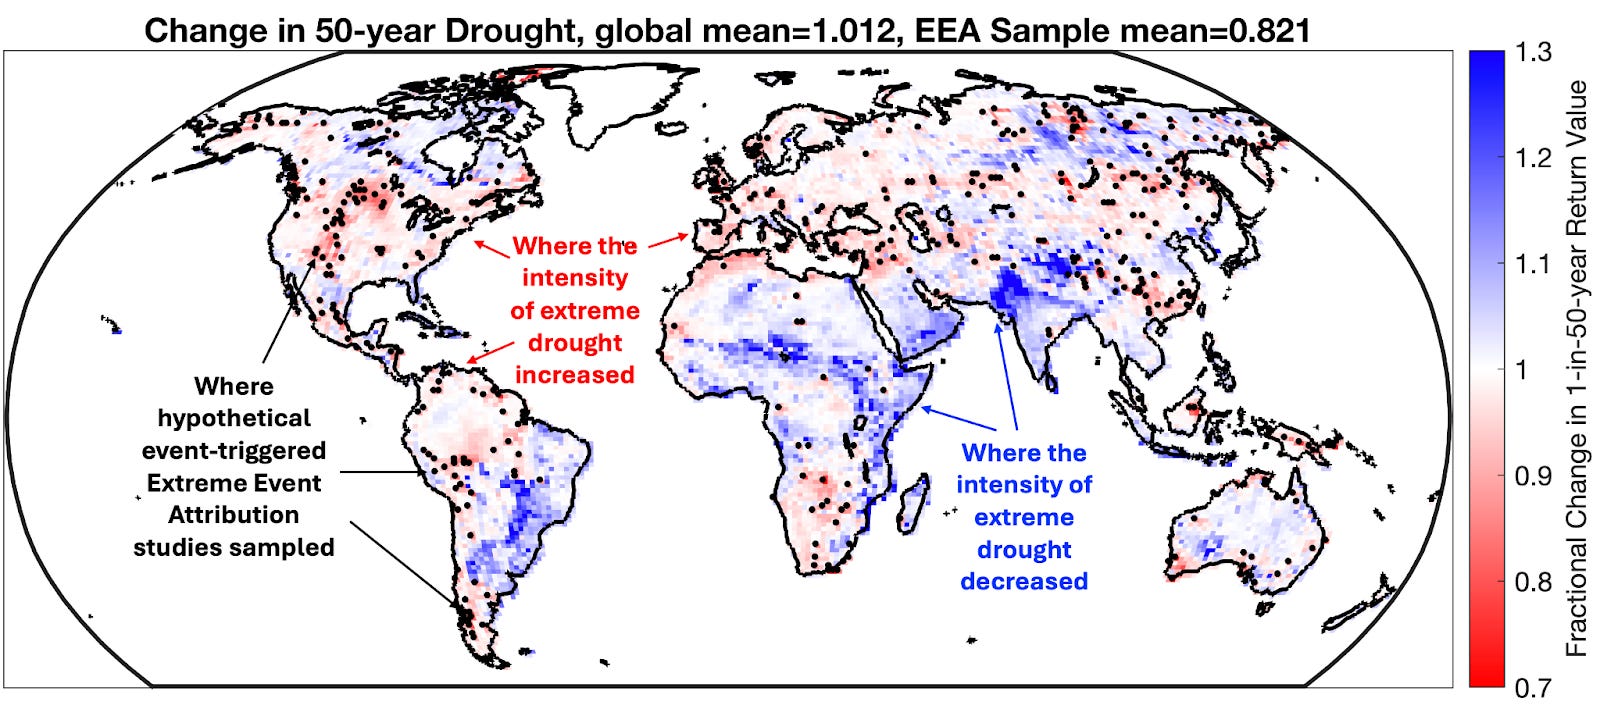
Now, here’s the kicker: The black dots show locations where once-per-50-year droughts actually occurred in the 21st-century simulation and thus represent events that would plausibly trigger EEA studies.
What do you notice about where the dots are compared to where the red is? That’s right; the simulated EEA studies overwhelmingly sample areas where droughts are getting more intense and more frequent by the very nature that those are the types of droughts that are more likely to occur in the warming climate. The result is that the EEA sample is majorly biased: warming decreased the intensity of once-per-50-year droughts by about 1% overall, but it increased their intensity within the EEA sample by 18%!
Thus, if you just relied on the EEA sample, you would come away with an
incorrect impression not only on the magnitude of change in extreme droughts
but also on the sign of the direction of change!

Choice Bias arises when researchers use prior knowledge to choose events for EEA studies that are more likely to have been made more severe by climate change. A clear example of Choice Bias pervading the Carbon Brief database is there have been 3.6 times more studies on extreme heat than there have been on extreme winter weather (205 vs. 57). Another example would be the dearth of EEA studies on extratropical cyclones (the kinds of low-pressure systems with cold and warm fronts that are responsible for most of the dramatic weather outside of the tropics). The IPCC states that the number of extratropical cyclones associated with intense surface wind speeds is expected to decrease strongly in the Northern Hemisphere with warming. Yet, it is relatively rare for EEA attribution studies to be done on these types of systems, which results in an exclusion of this good news from the EEA literature.
Publication Bias could be playing a role, too, where researchers are more likely to submit, and journals are likely to publish studies that report significant effects on salient events compared to studies that find null effects.
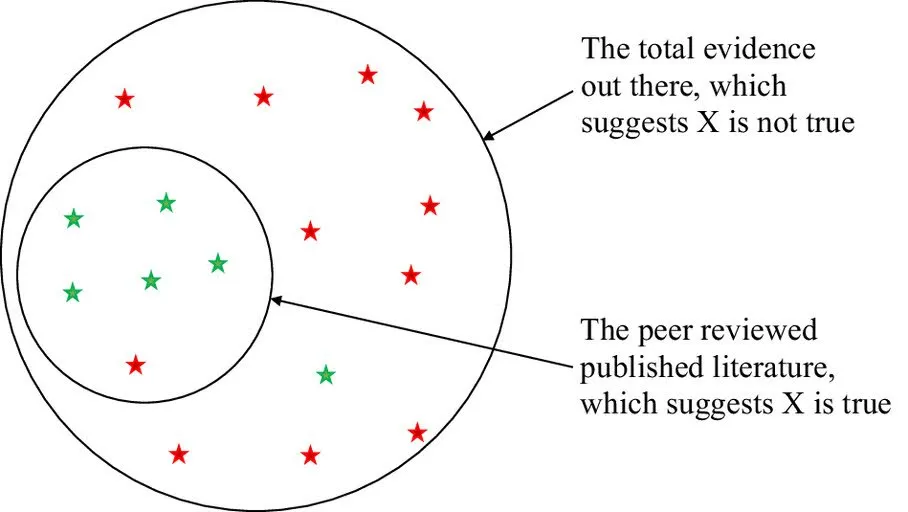
From Clark et al., 2023
Finally, the climate reporting media ecosystem is characterized by actors whose explicit mission is to raise awareness of the negative impacts of climate change, and thus, there will be a natural Media Coverage Bias with a tendency to selectively highlight EEA studies where climate change is found to be a larger driver than EEA studies that do not reach such a conclusion. These selection biases are apparent at the aggregate level, but there is also strong evidence of their presence in individual studies.
A more recent specific example suggestive of many of these dynamics is a study, Gilford et al. (2024), titled “Human-caused ocean warming has intensified recent hurricanes”. This study was conducted by three researchers at Climate Central, which summarizes the study’s findings with the following infographic:
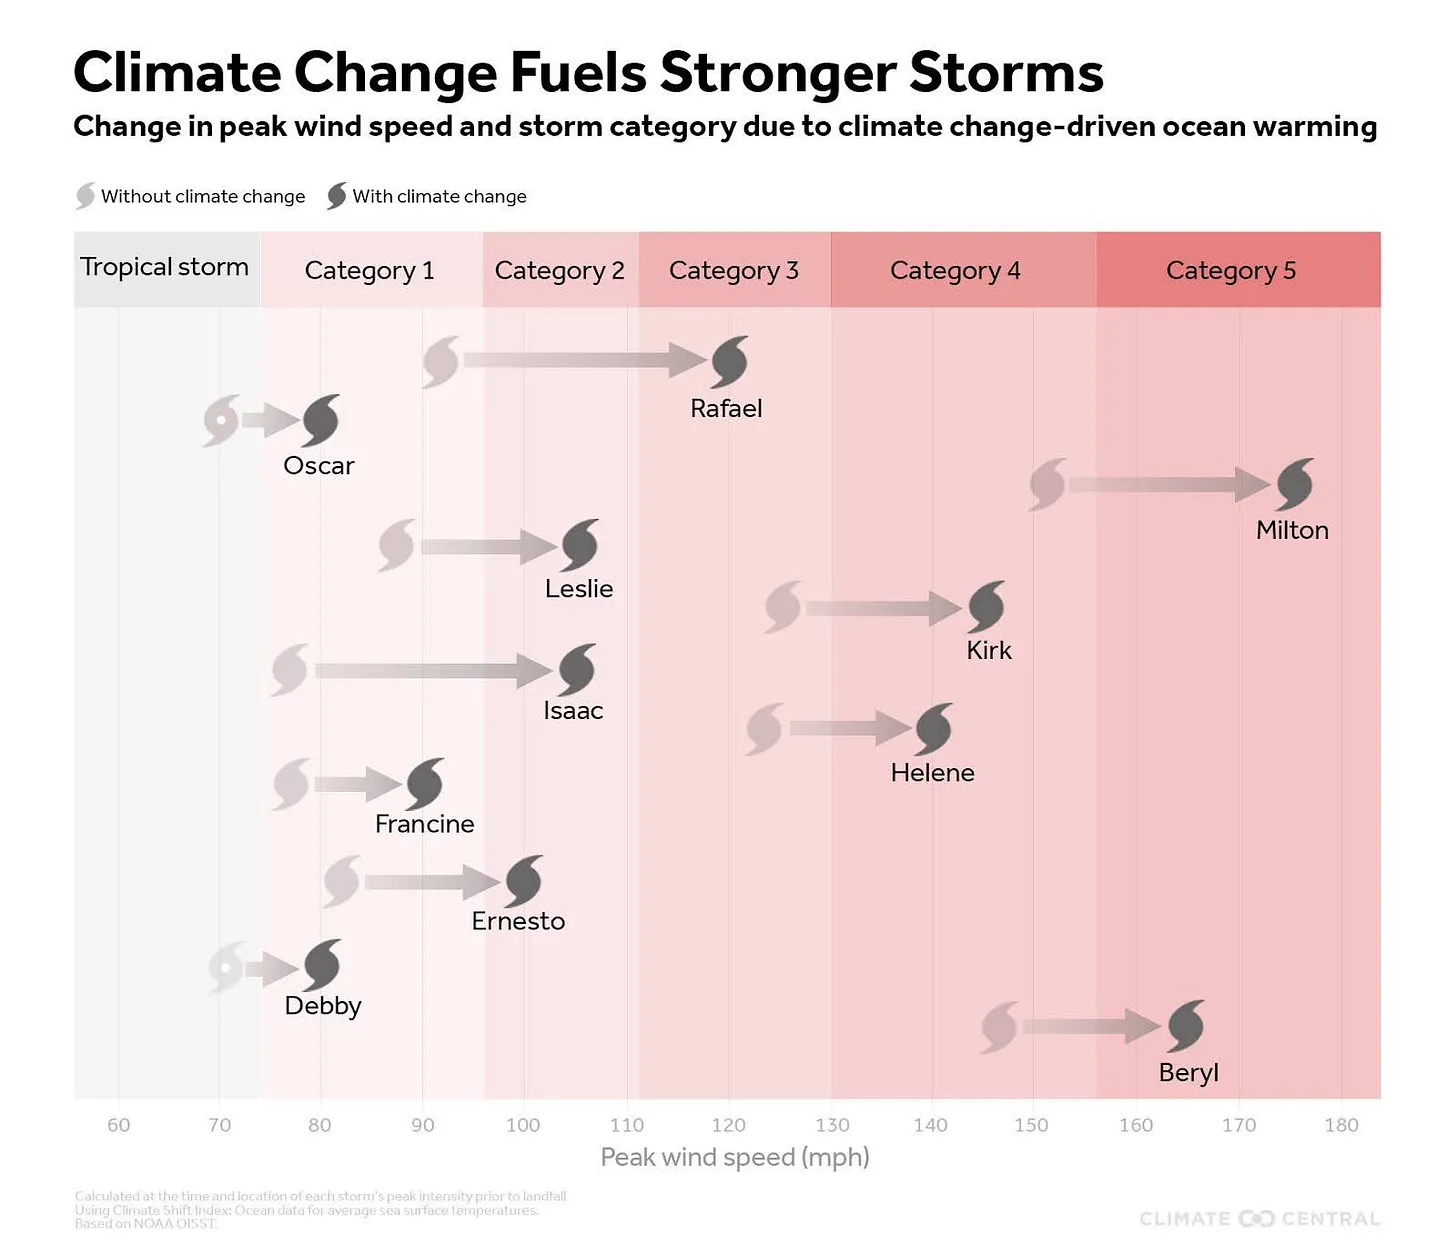
From Climate Central press release on Gilford et al. (2024).
Essentially, they claim that climate change is enhancing the intensity of all hurricanes and that the enhancement is quite large: Storms today are calculated to be an entire Category stronger than they would have been in a preindustrial climate.
This is a huge effect, and thus, if it were real, it is reasonable to expect to see clear long-term trends in metrics of tropical cyclone (hurricane) intensity like the accumulated number of major (Category 3+) hurricane days or the accumulated cyclone energy from all tropical cyclones (which is proportional to the square of hurricane windspeed accumulated over their lifetimes). However, any long-term trends in such metrics are subtle at best, both globally and over the North Atlantic.
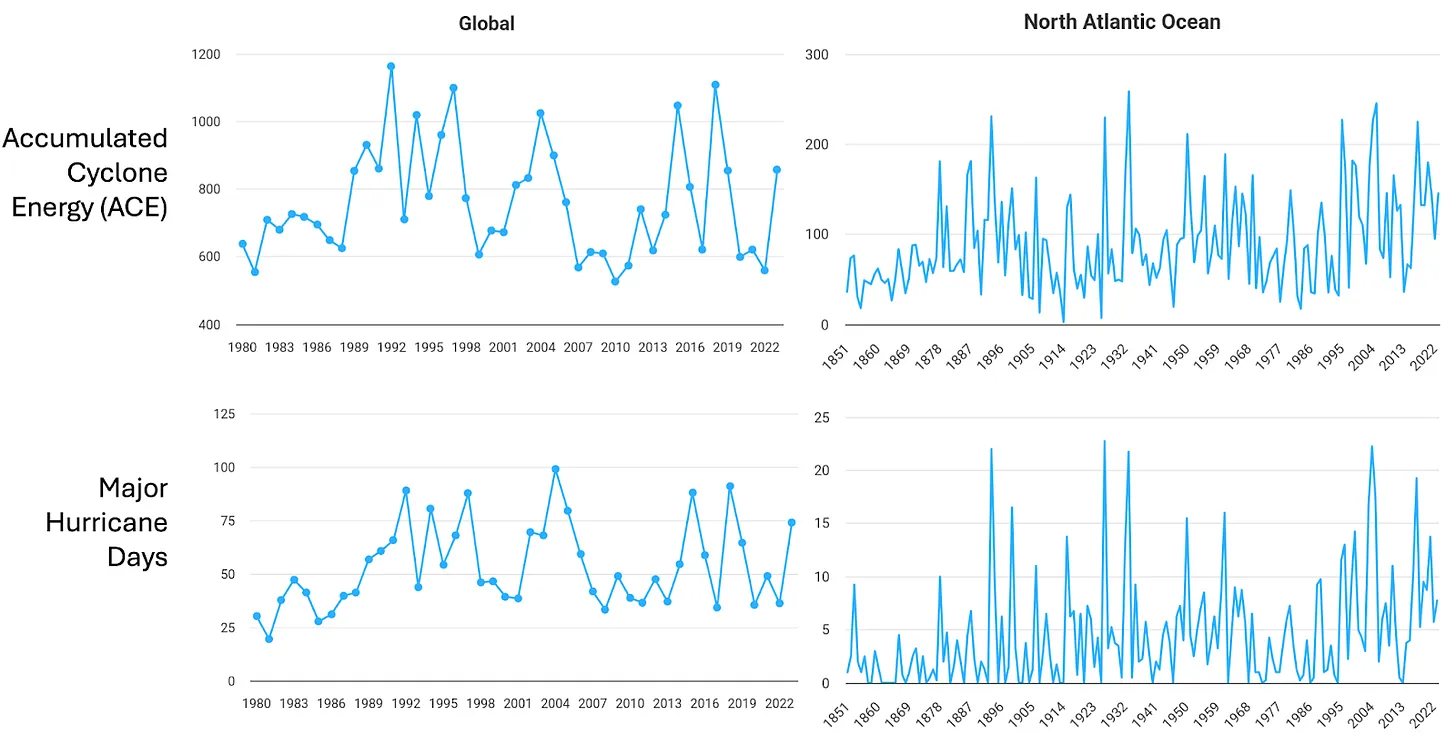
From Colorado State University Department of Atmospheric Science Tropical Meteorology Project.
So, this is a microcosm of the aforementioned apparent discrepancy between more broad quantifications of changes in extremes and their associated EEA counterparts, and again, I’d argue there are several selection biases at play affecting the production and dissemination of the EEA study.

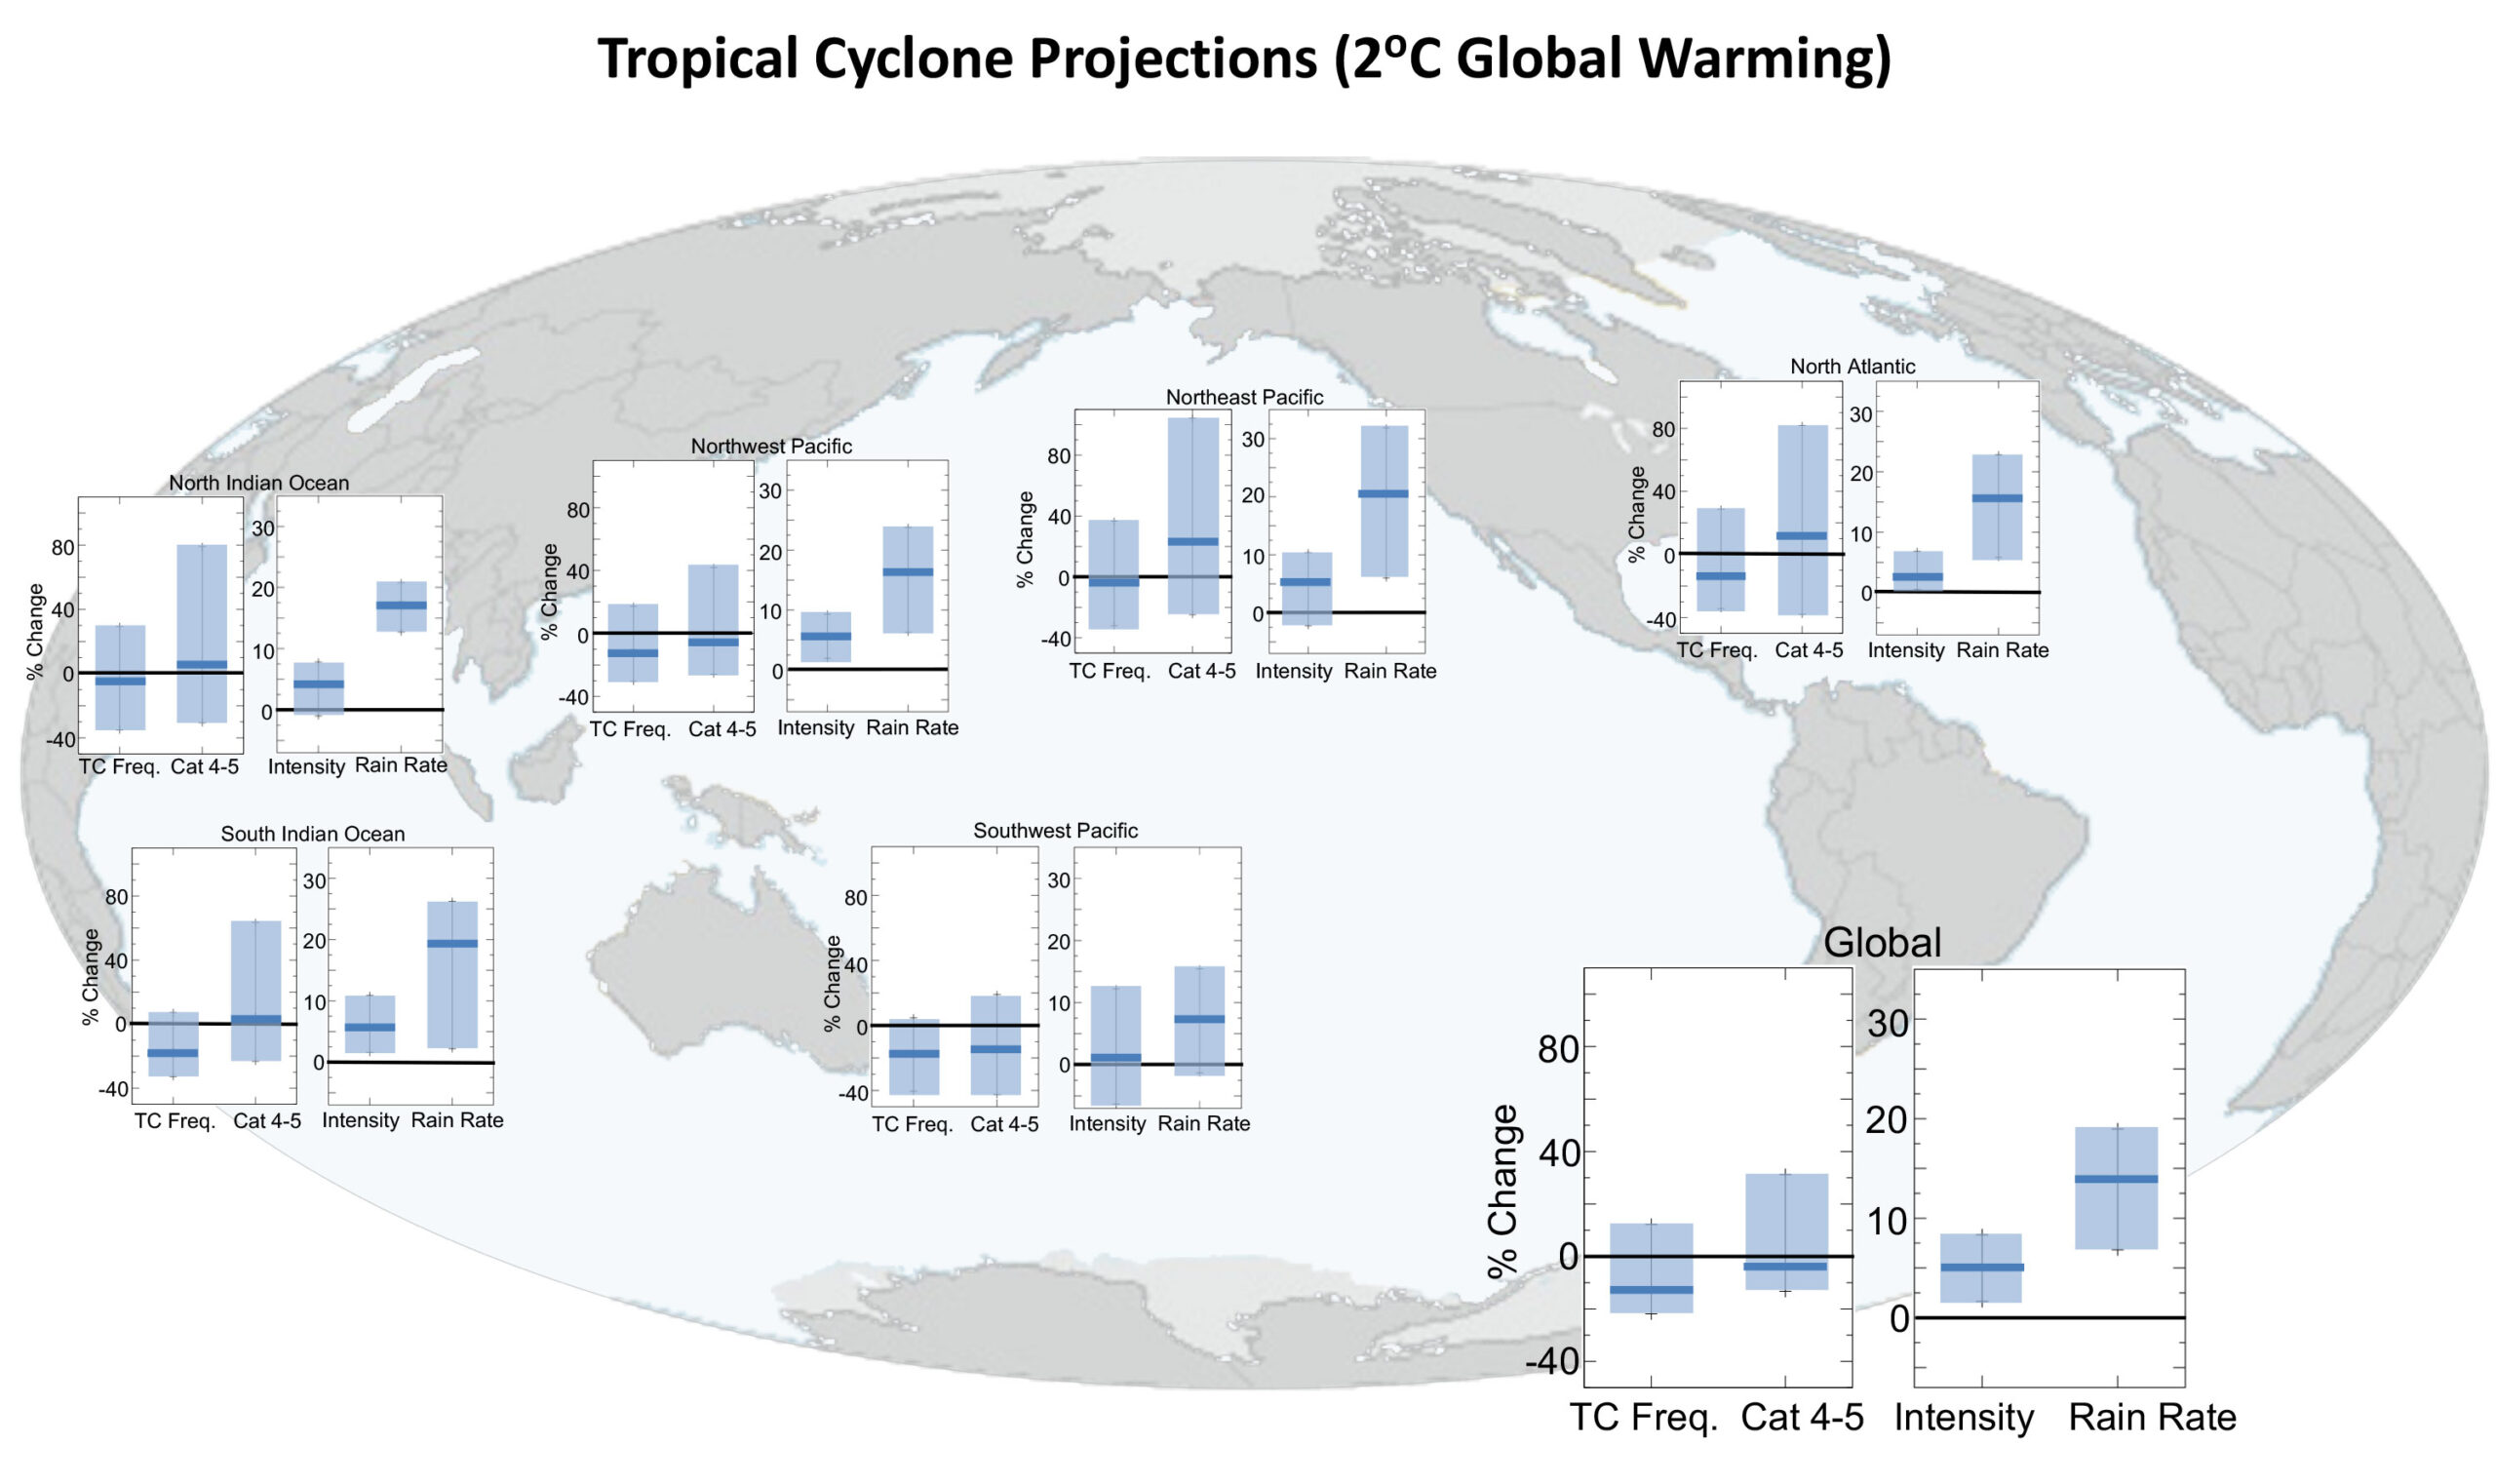
Let’s start with Choice Bias on methodology. Human-caused warming changes the environment in some ways that work to enhance hurricanes and in other ways that diminish them. The main way that hurricanes are enhanced is via the increase in sea surface temperatures (which provides the fundamental fuel for hurricanes), and the main way that hurricanes are diminished is via changes in atmospheric wind shear and humidity.
The net result of these countervailing factors pulling in opposite directions is that we expect fewer hurricanes overall, but when hurricanes are able to form, they can be stronger than they would otherwise. These factors, though, are small relative to natural random variability, and thus, they are difficult to detect in observations.
However, the Climate Central researchers made the methodological choice
to largely exclude the influence of factors that diminish
hurricane development from the study.
Are these Choice Biases in event type and methodology an accident? There are many reasons to believe they are not.
The research paper itself spells out that the motivation of the study is to “connect the dots” between climate change and hurricanes because “landfalling hurricanes with high intensities—can act as ‘focusing events’ that draw public attention” and that “Increased attention during and in wake of storms creates opportunities for public and private discourse around climate and disaster preparedness.”
Then, there is the extensive media coverage of this study. It was picked up by 134 news outlets and ranked in the 99.95th percentile of research articles (across all journals) of similar age in terms of online attention. Further, it was immediately incorporated into seven Wikipedia articles (likely having high leverage on AI queries, which would make its findings indistinguishable from scientific “fact”). This is affected by the aforementioned Media Coverage Bias, but it is also undoubtedly directly influenced by the efforts of Climate Central, which is explicitly an advocacy organization whose self-described specialty is media placement and dissemination.

The above sheds light on the reasons for certain choice biases in a particular study, but there is plenty of evidence that these selection biases are pervasive in the EEA field. After all, Dr. Myles Allen essentially founded the field with the motivation of answering the question, “Will it ever be possible to sue anyone for damaging the climate?”. This same motivation seems to animate many of the most high-profile scientists in the field today, like Allen’s protege, Dr. Friederike Otto (co-founder and leader of World Weather Attribution). She and her organization are frequently cited as bringing the necessary intellectual authority to credibly sue fossil fuel companies. She states the motivation of her work explicitly:
“Attributing extreme weather events to climate change, as I do
through my work as a climatologist, means we can hold
countries and companies to account for their inaction.”
Given the explicitly stated motivation of those in the EEA field, it is quite reasonable to suppose that there are major selection biases at play, and thus, it is not at all surprising that the collective output of the EEA field would look so different from more broad comprehensive assessments.


