Global Warming Fails to Convince

I happened to read an article at Real Clear Science An Inconvenient Truth About ‘An Inconvenient Truth’ by Eric Merkley & Dominik Stecula August 18, 2017. The article itself is of middling interest, mainly being a lament that Al Gore became the leading promoter of public awareness about the dangers of global warming. The authors contend that Republicans were predetermined to reject claims from such a high-profile liberal Democrat.

It is not new nor interesting to hear warmists diss skeptics as simplistic right-wingers having a knee jerk reaction to global warming claims. But reading the comment thread was illuminating and undercut the presumptions of the article. Instead of pointing to all the leftist knee jerkers swearing allegiance to climatism, posts by several scientists made comments hitting the credibility problem at its core.

Two comments reprinted below deserve a wide audience for expressing what many think but have not expressed so clearly.

@Gabe Kesseru

I spent an entire career in applied sciences and know the difference between true science and lesser areas of study. Climatology is one of the latter. It is mostly a field of historical trend analysis trying desperately to be a field of trend prediction (and doing very poorly at that).

Climatologists have done themselves a disservice by calling themselves scientists, since by doing so we expect them to use the scientific method. The use of scientific method will always be impossible in climatology, since the most important step in the SM is experimentation to prove the hypothesis. And experimentation is impossible when we can’t perform a laboratory equivalent of the earth’s climate over centuries in a laboratory experiment.

Secondarily, science requires that we gather data to laboratory accuracy levels which again is impossible with haphazard worldwide thermometer measurements originally meant to measure weather at casual levels of accuracy and casual levels of repeatability.

@Dan Ashley · Northcentral University

Dan Ashley here. PhD statistics, PhD Business.

I am not a climate, environment, geology, weather, or physics expert. However, I am an expert on statistics. So, I recognize bad statistical analysis when I see it. There are quite a few problems with the use of statistics within the global warming debate. The use of Gaussian statistics is the first error. In his first movie Gore used a linear regression of CO2 and temperature. If he had done the same regression using the number of zoos in the world, or the worldwide use of atomic energy, or sunspots, he would have the same result. A linear regression by itself proves nothing.

The theory that CO2 is a greenhouse gas has been proven correct in a small greenhouse only. As a matter of fact, plants like higher CO2 and it is frequently pumped into greenhouses because of that. There has never been a definitive experiment regarding CO2, at or near the concentrations in our atmosphere. This theory actually has much less statistical support than the conspiracy theories regarding JFK’s assassination.

Gaussian statistics REQUIRE the events being published to be both independent and random. The temperatures experienced in one part of the world are dependent on temperatures in other locales. The readings are not independent. A better statistical method would be Mandlebroten (fractal). Mandlebroten statistics are not merely “fat tailed” statistics.

A more problematic issue with the data is that it has been adjusted. Data adjustments are frequently needed –for example, if a measuring device fails. However 100% of the data adjustments used are in favor of proving global warming. 100%. Not 100% minus one adjustment. Not nearly 100%. 100% –that is ALL– of the adjustments were in one direction only. Any student that put data like that in a PHD dissertation would never receive a doctoral degree.

One study published showed parts of the Earth where warming was occuring faster than other parts of the globe. The study claimed to be of data solely from satellites. The study identified several areas (Gambia for one) which have greater warming than other areas. Unfortunately, in three of those areas there have been no climate satellite observations for years.

The statements that claim “less arctic ice in recorded history” are equally spurious. We started gathering data on that in 1957 with the first satellite fly overs. On this issue “recorded history” is a very short time period.

Some geologist friends told me that a significant amount of Earth’s heat comes from the hot Earth’s core. They further stated that they do not know what percentage of heat that is. They do know it is probably over 20% and probably less than 70%. Whereas either of those extremes seems unlikely to me, remember that I am not a geologist.

As to rising oceans, that should be measured accurately. Measuring it with a stick stuck in the sand is inappropriate. Geologists tell me that the land is shifting and moving. Measuring it against the gravitational center of the Earth is the only accurate way. However, we do not know how to do that. As a matter of fact, we don’t know precisely where the gravitational center of the Earth is. (Any physicists around that want to explain the two body and the three body problem as it relates to the Earth, Moon, and Sun, please do so.

So, according to climate scientists the world is warming up. They may be correct, they may be incorrect. However, they have been unable to support their thesis via the use of statistics.

I personally see no reason to disassemble the world’s economic systems over an unproven, and somewhat implausible theory.

Summary

The scientific claims made in Gore’s movies do not stand up to scrutiny.  Changing the salesman is not going to make the pitch any more believable.

See also

Reasoning About Climate

Big Al’s Sequel Flawed at its Core

Big Al’s Sequel: Flawed at its Core


maxresdefaultFortunately, box offices show few other than die-hard Gore fans are subjecting themselves to the Inconvenient Sequel. When people go to see cli-sci-fi (Climate Science Fiction) movies like Water World or Day After Tomorrow, they know in advance it will be someone’s imaginary portrayal of an undesirable future. The difference with Al Gore, and also with the writers of the draft US Climate Assessment is their claim that their imaginings are “the Truth.”

Despite the low box office numbers, the media will inundate us with flawed messages from the film, so this post is required for protection around the office water cooler or the kitchen table. Text below in italics are excerpts from Alex Epstein’s article in the Financial Post Al Gore can’t deny that his climate crusade involves great suffering  Alex Epstein: Gore has to make the case that climate dangers warrant so much human misery

Good Reasons to reject Al Gore’s alarms.

The running theme throughout An Inconvenient Sequel is that Gore’s first film was even more right than he expected. The movie begins with defenders of fossil fuels mocking or ignoring the dramatic predictions of An Inconvenient Truth. Leaving aside a heroic (and highly disputed) portrayal of Gore rescuing the Paris climate accord, the rest of the movie focuses on vindicating Gore’s two chief predictions: 1) That we could replace fossil fuels with cheap solar- and wind-powered “renewables”; and 2) that continued use of fossil fuels would lead to catastrophic temperature rises, catastrophic sea-level rises, catastrophic flooding, catastrophic drought, catastrophic storms, and catastrophic disease proliferation.

Let’s deal first with Gore’s second supposition.

Alarmists Substitute Models for Observations and Data

Since the last IPCC report (AR5), activists no longer respect what consensus scientists say. Observations and data are set aside, and only alarming projections from models count. As we know, computer simulations of the climate system are flawed, and running hotter than even adjusted global datasets. And we also know, since model outputs can only project modeler’s assumptions into the future, the models cannot prove the validity of those assumptions.

Berkeley physicist Richard Muller gives a mainstream scientist view of Gore’s claims.

“The problem is not with the survey, which asked a very general question. The problem is that many writers (and scientists!) look at that number and mis-characterize it. The 97% number is typically interpreted to mean that 97% accept the conclusions presented in An Inconvenient Truth by former Vice President Al Gore. That’s certainly not true; even many scientists who are deeply concerned by the small global warming (such as me) reject over 70% of the claims made by Mr. Gore in that movie (as did a judge in the UK; see footnote below).”

“I like to ask scientists who “believe” in global warming what they think of the data. Do they believe hurricanes are increasing? Almost never do I get the answer “Yes, I looked at that, and they are.” Of course they don’t say that, because if they did I would show them the actual data! Do they say, “I’ve looked at the temperature record, and I agree that the variability is going up”? No. Sometimes they will say, “There was a paper by Jim Hansen that showed the variability was increasing.” To which I reply, “I’ve written to Jim Hansen about that paper, and he agrees with me that it shows no such thing. He even expressed surprise that his paper has been so misinterpreted.”

“A really good question would be: “Have you studied climate change enough that you would put your scientific credentials on the line that most of what is said in An Inconvenient Truth is based on accurate scientific results? My guess is that a large majority of the climate scientists would answer no to that question, and the true percentage of scientists who support the statement I made in the opening paragraph of this comment, that true percentage would be under 30%. That is an unscientific guestimate, based on my experience in asking many scientists about the claims of Al Gore.”  Full text at Meet Richard Muller, Lukewarmist

Our Actual Climate is Mild and Not Dangerous

Nothing out of the ordinary is happening to our weather and climate, despite lots of claims otherwise. Gore’s sequel is long on anecdotes and fears, but lacks any references to the statistics contradicting him. Recent decades have been remarkably benign and agriculture is booming. IPCC scientists wrote that no evidence yet exists to connect extreme weather with human activities.  Alex Epstein:

Gore and others should be free to make the case that the danger of greenhouse gases is so serious as to warrant that scale of human misery. But they should have to quantify and justify the magnitude of climate danger. And that brings us to the truth about climate.

The overall trend in climate danger is that it is at an all-time low. The Emergency Events Database (EM-DAT) shows 6,114 climate-related deaths in 2016. In other recent years the numbers have maxed out in the tens of thousands. Compare this to the 1930s when, adjusted for population, climate-related deaths hit the 10-million mark several times.

The most significant cause of our radically reduced climate danger is industrial development, which takes a naturally dangerous climate and makes it unnaturally safe. And industrial development is driven by cheap, plentiful, reliable energy — which, today, overwhelmingly means fossil fuels. Climate will always be dangerous so priority number one is to have the energy and development to tame it. Modern irrigation, residential heating and air conditioning have made once uninhabitable places perfectly comfortable.

Controlling Human CO2 Emissions Will Not Change the Weather

The really inconvenient truth is that governments are not able to ensure favorable weather for humans. Nothing yet attempted, from corrupt carbon markets, to biofuels, to renewable electrical power, to carbon taxes has done anything beyond enriching cronies and filling government coffers.

Alex Epstein details Gore’s misdirecting us to renewables as our salvation.

Some of his anecdotes are meant to prove that cheap solar and wind are, as 2006 Gore prophesied, quickly dominating the world’s energy supply and, as 2006 Gore also warned us, that our rapidly warming climate is killing more and more people each year. But he has not given us the whole picture.

Take the rising dominance of solar and wind, which is used to paint supporters of fossil fuels as troglodytes, fools, and shills for Big Oil. The combined share of world energy consumption from renewables is all of two per cent. And it’s an expensive, unreliable, and therefore difficult-to-scale two per cent.

Because solar and wind are “unreliables,” they need to be backed up by reliable sources of power, usually fossil fuels, or sometimes non-carbon sources including nuclear and large-scale hydro power (all of which Gore and other environmentalists refuse to support). This is why every grid that incorporates significant solar and wind has more expensive electricity. Germans, on the hook for Chancellor Angela Merkel’s self-righteous anti-carbon commitments, are already paying three times the rates for electricity that Americans do.

Stories about “100-per-cent renewable” locations like Georgetown, Tex. are not just anecdotal evidence, they are lies. The Texas grid from which Georgetown draws its electricity is comprised of 43.7 per cent natural gas, 28.8 per cent coal, 12 per cent nuclear, and only 15.6 per cent renewable. Using a virtue-signalling gimmick pioneered by Apple, Facebook, and Google, Georgetown pays its state utility to label its grid electricity “renewable” — even though it draws its power from that fossil-fuel heavy Texas grid — while tarring others on the grid as “non-renewable.”

If we look at the overall trends instead of engaging in anecdotal manipulation we see that fossil fuel energy is the fastest-growing energy source in the world — still. Fossil fuels have never been more vital to human flourishing. There are 1,600 coal plants planned for the near future, which could increase international coal capacity 43 per cent. Advances in technology are making fossil fuels cleaner, safer, and more efficient than ever. To reduce their growth let alone to radically restrict their use — which is what Gore advocates — means forcing energy poverty on billions of people.

Conclusion

Gore’s Inconvenient Sequel gives a biased, self-serving, and convenient picture of fossil fuels and climate — convenient for Gore’s legacy, that is, but inconvenient for the billions his energy poverty policies will harm. As citizens, we must start demanding responsible thought leaders who will give us the whole picture that life-and-death energy and climate decisions require.

Note the contrast between Al Gore’s propaganda and Richard Lindzen’s short video:

Footnote:

Errors in “An Inconvenient Truth” Highlighted by UK High Court Judge Michael Burton:

1.) The sea level will rise up to 20 feet because of the melting of either West Antarctica or Greenland in the near future. (This “Armageddon scenario” would only take place over thousands of years, the judge wrote.)

2.) Some low-lying Pacific islands have been so inundated with water that their citizens have all had to evacuate to New Zealand. (“There is no evidence of any such evacuation having yet happened.”)

3.) Global warming will shut down the “ocean conveyor,” by which the Gulf Stream moves across the North Atlantic to Western Europe. (According to the Intergovernmental Panel on Climate Change, “it is very unlikely that the Ocean Conveyor will shut down in the future…”)

4.) There is a direct coincidence between the rise in carbon dioxide in the atmosphere and the rise in temperature over the last 650,000 years. (“Although there is general scientific agreement that there is a connection, the two graphs do not establish what Mr. Gore asserts.”)

5.) The disappearance of the snows on Mount Kilimanjaro is expressly attributable to global warming. (“However, it is common ground that, the scientific consensus is that it cannot be established that the recession of snows on Mount. Kilimanjaro is mainly attributable to human-induced climate change.”)

6.) The drying up of Lake Chad is a prime example of a catastrophic result of global warming. (“It is generally accepted that the evidence remains insufficient to establish such an attribution” and may be more likely the effect of population increase, overgrazing and regional climate variability.)

7.) Hurricane Katrina and the consequent devastation in New Orleans is because of global warming. (“It is common ground that there is insufficient evidence to show that.”)

8.) Polar bears are drowning because they have to swim long distances to find ice. (“The only scientific study that either side before me can find is one, which indicates that four polar bears have recently been found drowned because of a storm.”)

9.) Coral reefs all over the world are bleaching because of global warming and other factors. (“Separating the impacts of stresses due to climate change from other stresses, such as overfishing and pollution, was difficult.”)


Decoding Climate News


Definition of “Fake News”: When reporters state their own opinions instead of bearing witness to observed events.

Journalism professor David Blackall provides a professional context for investigative reporting I’ve been doing on this blog, along with other bloggers interested in science and climate change/global warming. His peer reviewed paper is Environmental Reporting in a Post Truth World. The excerpts below show his advice is good not only for journalists but for readers.  h/t GWPF, Pierre Gosselin

Overview: The Grand Transnational Narrative

The dominance of a ‘grand transnational narrative’ in environmental discourse (Mittal, 2012) over other human impacts, like deforestation, is problematic and is partly due to the complexities and overspecialization of climate modelling. A strategy for learning, therefore, is to instead focus on the news media: it is easily researched and it tends to act ‘as one driving force’, providing citizens with ‘piecemeal information’, making it impossible to arrive at an informed position about science, society and politics (Marisa Dispensa et al., 2003). After locating problematic news narratives, Google Scholar can then be employed to locate recent scientific papers that examine, verify or refute news media discourse.

The science publication Nature Climate Change this year, published a study demonstrating Earth this century warmed substantially less than computer-generated climate models predict.

Unfortunately for public knowledge, such findings don’t appear in the news. Sea levels too have not been obeying the ‘grand transnational narrative’ of catastrophic global warming. Sea levels around Australia 2011–2012 were measured with the most significant drops in sea levels since measurements began. . .The 2015–2016 El-Niño, a natural phenomenon, drove sea levels around Indonesia to low levels such that coral reefs were bleaching. The echo chamber of news repeatedly fails to report such phenomena and yet many studies continue to contradict mainstream news discourse.

facebook2bnew2blike2bbuttons2bfinal-970-80I will be arguing that a number of narratives need correction, and while I accept that the views I am about to express are not universally held, I believe that the scientific evidence does support them.

The Global Warming/Climate Change Narrative

The primary narrative in need of correction is that global warming alone (Lewis, 2016), which induces climate change (climate disruption), is due to the increase in global surface temperatures caused by atmospheric greenhouse gases. Instead, there are many factors arising from human land use (Pielke et al., 2016), which it could be argued are responsible for climate change, and some of these practices can be mitigated through direct public action.

Global warming is calculated by measuring average surface temperatures over time. While it is easy to argue that temperatures are increasing, it cannot be argued, as some models contend, that the increases are uniform throughout the global surface and atmosphere. Climate science is further problematized by its own scientists, in that computer modelling, as one component of this multi-faceted science, is privileged over other disciplines, like geology.

Scientific uncertainty arises from ‘simulations’ of climate because computer models are failing to match the actual climate. This means that computer models are unreliable in making predictions.

Published in the eminent journal Nature (Ma, et. al., 2017), ‘Theory of chaotic orbital variations confirmed by Cretaceous geological evidence’, provides excellent stimulus material for student news writing. The paper discusses the severe wobbles in planetary orbits, and these affect climate. The wobbles are reflected in geological records and show that the theoretical climate models are not rigorously confirmed by these radioisotopically calibrated and anchored geological data sets. Yet popular discourse presents Earth as harmonious: temperatures, sea levels and orbital patterns all naturally balanced until global warming affects them, a mythical construct. Instead, the reality is natural variability, the interactions of which are yet to be measured or discovered (Berger, 2013).

In such a (media) climate, it is difficult for the assertion to be made that there might be other sources, than a nontoxic greenhouse gas called carbon dioxide (CO2), that could be responsible for ‘climate disruption’. A healthy scientific process would allow such a proposition. Contrary to warming theory, CO2 levels have increased, but global average temperatures remain steady. The global average temperature increased from 1983 to 1998; then, it flat-lined for nearly 20 years. James Hansen’s Hockey Stick graph, with soaring and catastrophic temperatures, simply did not materialize.

As Keenan et al. (2016) found through using global carbon budget estimates, ground, atmospheric and satellite observations, and multiple global vegetation models that there is also now a pause in the growth rate of atmospheric CO2. They attribute this to increases in terrestrial sinks over the last decade, where forests consume the rising atmospheric CO2 and rapidly grow—the net effect being a slowing in the rate of warming from global respiration.

Contrary to public understanding, higher temperatures in cities are due to a phenomenon known as the ‘urban heat effect’ (Taha, 1997; Yuan & Bauer, 2007). Engines, air conditioners, heaters and heat absorbing surfaces like bitumen radiate heat energy in urban areas, but this is not due to the greenhouse effect. Problematic too are data sets like ocean heat temperatures, sea-ice thickness and glaciers: all of which are varied, some have not been measured or there are insignificant measurement time spans for the data to be reliable.

Contrary to news media reports, some glaciers throughout the world (Norway [Chinn et al., 2005] and New Zealand [Purdie et al., 2008]) are growing, while others shrink (Paul et al., 2007).

Conclusion

This is clearly a contentious topic. There are many agendas at play, with careers at stake. My view represents one side of the debate: it is one I strongly believe in, and is, I contend, supported by the science around deforestation, on the ground, rather than focusing almost entirely on atmosphere. However, as a journalism educator, I also recognize that my view, along with others, must be open to challenge, both within the scientific community and in the court of public opinion.

As a journalism educator, it is my responsibility to provide my students with the research skills they need to question—and test—the arguments put forward by the key players in any debate. Given the complexity of the climate warming debate, and the contested nature of the science that underpins both sides, this will provide challenges well into the future. It is a challenge our students should relish, particularly in an era when they are constantly being bombarded with ‘fake news’ and so-called ‘alternative facts’.

To do so, they need to understand the science. If they don’t, they need to at least understand the key players in the debate and what is motivating them. They need to be prepared to question these people and to look beyond their arguments to the agendas that may be driving them. If they don’t, we must be reconciled to a future in which ‘fake news’ becomes the norm.

Examples of my investigative reports are in Data Vs. Models posts listed at Climate Whack-a-Mole

See also Yellow Climate Journalism

Control Knobs, Rick Perry and AMS

A great post by Ross McKitrick at the Hill (H/T GWPF)  In the fight between Rick Perry and climate scientists — He’s winning  Excerpts below (my bolds)

Policy makers and the public need to understand the extent to which major scientific institutions like the American Meteorological Society have become biased and politicized on the climate issue. Convincing them of this becomes much easier when the organizations themselves supply the evidence.

This happened recently in response to a CNBC interview with Energy Secretary Rick Perry. He was asked “Do you believe CO2 [carbon dioxide] is the primary control knob for the temperature of the Earth and for climate?”

It was an ambiguous question that defies a simple yes or no answer. Perry thought for moment then said, “No, most likely the primary control knob is the ocean waters and this environment we live in.” He then went on to acknowledge the climate is changing and CO2 is having a role, but the issue is how much, and being skeptical about some of these things is “quite all right.”

Perry’s response prompted a letter of protest from Keith Seitter, executive director of the American Meteorological Society. The letter admonished him for supposedly contradicting “indisputable findings” that emissions of CO2 and other greenhouse gases are the primary cause of recent global warming, a topic for which Seitter insists there is no room for debate.

It is noteworthy that the meteorological society remained completely silent over the years when senior Democratic administration officials made multiple exaggerated and untrue statements in service of global warming alarmism.  (McKitrick provides several examples in his article)

But the meteorological society leapt to condemn Perry for a cautious response to an awkward question. Perry could not reasonably have agreed with the interviewer since the concept of a “control knob” for the Earth’s temperature wasn’t defined. Doubling CO2 might, according to models, cause a few degrees of warming. Doubling the size of the sun would burn up the planet. Doubling cloud cover might trigger an ice age. So which is the “primary control knob”? The meteorological society letter ignored the odd wording of the question, misrepresented Perry’s response and then summarily declared their position on climate “indisputable.” Perry’s cautious answer, by contrast, was perfectly reasonable in the context of a confusing question in a fast-moving TV interview.

Furthermore, Seitter’s letter invites skepticism. It pronounces confidently on causes of global warming “in recent decades” even though this is where the literature is most disputed and uncertain. Climate models have overestimated warming in recent decades for reasons that are not yet known. Key mechanisms of natural variability are not well understood, and measured climate sensitivity to CO2 appears to be lower than modelers assumed. Climate models tweaked to get recent Arctic sea ice changes right get overall warming even more wrong, adding to the list of puzzles. But to the meteorological society, the fact that these and many other questions are unresolved does not prevent them from insisting on uniformity of opinion.

Summary

The meteorological society letter is all about enforcing orthodoxy, which speaks ill of the leadership’s overall views on open scientific debate.

Ross McKitrick is a professor of economics at the University of Guelph and an Adjunct Scholar at the Cato Institute.

See also:  Nature’s Sunscreen and Climate Biorhythms

Footnote:  Arnd’s comment below reminds of this image.  It works even better with Republican Rick Perry testifying to the ocean’s climate dominance.


Man Made Warming from Adjusting Data

trends and strings

Roger Andrews does a thorough job analyzing the effects of adjustments upon Surface Air Temperature (SAT) datasets. His article at Energy Matters is Adjusting Measurements to Match the Models – Part 1: Surface Air Temperatures. Excerpts of text and some images are below.  The whole essay is informative and supports his conclusion:

In previous posts and comments I had said that adjustments had added only about 0.2°C of spurious warming to the global SAT record over the last 100 years or so – not enough to make much difference. But after further review it now appears that they may have added as much as 0.4°C.

For example, these graphs show warming of the GISS dataset:

Figure 2: Comparison of “Old” and “Current” GISS meteorological station surface air temperature series, annual anomalies relative to 1950-1990 means

The current GISS series shows about 0.3°C more global warming than the old version, with about 0.2°C more warming in the Northern Hemisphere and about 0.5°C more in the Southern. The added warming trends are almost exactly linear except for the downturns after 2000, which I suspect (although can’t confirm) are a result of attempts to track the global warming “pause”. How did GISS generate all this extra straight-line warming? It did it by replacing the old unadjusted records with “homogeneity-adjusted” versions.

The homogenization operators used by others have had similar impacts, with Berkeley Earth Surface Temperature (BEST) being a case in point. Figure 3, which compares warming gradients measured at 86 South American stations before and after BEST’s homogeneity adjustments (from Reference 1) visually illustrates what a warming-biased operator does at larger scales. Before homogenization 58 of the 86 stations showed overall warming, 28 showed overall cooling and the average warming trend for all stations was 0.54°C/century. After homogenization all 86 stations show warming and the average warming trend increases to 1.09°C/century:

Figure 3: Warming vs. cooling at 86 South American stations before and after BEST homogeneity adjustments

The adjusted “current” GISS series match the global and Northern Hemisphere model trend line gradients almost exactly but overstate warming relative to the models in the Southern (although this has only a minor impact on the global mean because the Southern Hemisphere has a lot less land and therefore contributes less to the global mean than does the Northern). But the unadjusted “old” GISS series, which I independently verified with my own from-scratch reconstructions, consistently show much less warming than the models, confirming that the generally good model/observation match is entirely a result of the homogeneity adjustments applied to the raw SAT records.


Summary

In this post I have chosen to combine a large number of individual examples of “data being adjusted to match it to the theory” into one single example that blankets all of the surface air temperature records. The results indicate that warming-biased homogeneity adjustments have resulted in current published series overestimating the amount by which surface air temperatures over land have warmed since 1900 by about 0.4°C (Table 1), and that global surface air temperatures have increased by only about 0.7°C over this period, not by the ~1.1°C shown by the published SAT series.

Land, however, makes up only about 30% of the Earth’s surface. The subject of the next post will be sea surface temperatures in the oceans, which cover the remaining 70%. In it I will document more examples of measurement manipulation malfeasance, but with a twist. Stay tuned.

Footnote:

I have also looked into this issue by analyzing a set of US stations considered to have the highest CRN rating.  The impact of adjustments was similarly evident and in the direction of warming the trends.  See Temperature Data Review Project: My Submission


Eemian and Holocene Climates


Hansen is publishing a new paper in support of the children suing the government for not fighting climate change. In it he claims temps now are higher than the Holocene and matching the Eemian, so we should expect comparable sea levels.

Paper is here:
http://www.earth-syst-dynam.net/8/577/2017/

Abstract. Global temperature is a fundamental climate metric highly correlated with sea level, which implies that keeping shorelines near their present location requires keeping global temperature within or close to its preindustrial Holocene range. However, global temperature excluding short-term variability now exceeds +1 °C relative to the 1880–1920 mean and annual 2016 global temperature was almost +1.3 °C. We show that global temperature has risen well out of the Holocene range and Earth is now as warm as it was during the prior (Eemian) interglacial period, when sea level reached 6–9 m higher than today. Further, Earth is out of energy balance with present atmospheric composition, implying that more warming is in the pipeline, and we show that the growth rate of greenhouse gas climate forcing has accelerated markedly in the past decade. The rapidity of ice sheet and sea level response to global temperature is difficult to predict, but is dependent on the magnitude of warming. Targets for limiting global warming thus, at minimum, should aim to avoid leaving global temperature at Eemian or higher levels for centuries. Such targets now require negative emissions, i.e., extraction of CO2 from the air. If phasedown of fossil fuel emissions begins soon, improved agricultural and forestry practices, including reforestation and steps to improve soil fertility and increase its carbon content, may provide much of the necessary CO2 extraction. In that case, the magnitude and duration of global temperature excursion above the natural range of the current interglacial (Holocene) could be limited and irreversible climate impacts could be minimized. In contrast, continued high fossil fuel emissions today place a burden on young people to undertake massive technological CO2 extraction if they are to limit climate change and its consequences. Proposed methods of extraction such as bioenergy with carbon capture and storage (BECCS) or air capture of CO2 have minimal estimated costs of USD 89–535 trillion this century and also have large risks and uncertain feasibility. Continued high fossil fuel emissions unarguably sentences young people to either a massive, implausible cleanup or growing deleterious climate impacts or both. (my bolds)

The image at the top shows that the Eemian climate was very different due to orbital mechanics, which were nothing like today.  And as Rud points out, the rise in sea levels took thousands of years at a rate similar to today: 2 mm a year.

In addition, Hansen et al. appear to have erased not only the Medieval Warming period, but also the Roman and Minoan periods before them.   Perhaps they are using 2016 temps as a trampoline for their claims, even though we are already well down from that El Nino event.

Hansen et al. are going over the top, exaggerating even beyond IPCC in order to proclaim Waterworld is at hand.

It seems to me that the kind of rise Hansen is looking comes after an ice age freezes lots of water, resulting in a very low baseline.  In the graph below, you can see the beginning of the Holocene around 14 thousand years ago, and then the rise slowed down to the present rate around 6000 years ago.

More information is available here:
https://wattsupwiththat.com/2015/06/01/ice-core-data-shows-the-much-feared-2c-climate-tipping-point-has-already-occurred/

For more on children’s crusade against global warming see:  Climate War Human Shields


Climate Biorhythms

Human Biorhythms

The question–whether monitoring biorhythm cycles can actually make a difference in people’s lives–has been studied since the 1960s, when the writings of George S. Thommen popularized the idea.

Several companies began experimenting and although the Japanese were the first nation to apply biorhythms on a large scale, the Swiss were the first to see and realize the benefits of biorhythms in reducing accidents.

Hans Frueh invented the Bio-Card and Bio-Calculator, and Swiss municipal and national authorities appear to have been applying biorhythms for many years before the Japanese experiments. Swissair, which reportedly had been studying the critical days of its pilots for almost a decade previously, did not allow either a pilot or a co-pilot experiencing a critical day to fly with another experiencing the same kind of instability. Reportedly, Swissair had no accidents on those flights where biorhythm had been applied.

Most biorhythm models use three cycles: a 23-day physical cycle, a 28-day emotional cycle, and a 33-day intellectual cycle.[8] Each of these cycles varies between high and low extremes sinusoidally, with days where the cycle crosses the zero line described as “critical days” of greater risk or uncertainty.

The numbers from +100% (maximum) to -100% (minimum) indicate where on each cycle the rhythms are on a particular day. In general, a rhythm at 0% is crossing the midpoint and is thought to have no real impact on your life, whereas a rhythm at +100% (at the peak of that cycle) would give you an edge in that area, and a rhythm at -100% (at the bottom of that cycle) would make life more difficult in that area. There is no particular meaning to a day on which your rhythms are all high or all low, except the obvious benefits or hindrances that these rare extremes are thought to have on your life.

Human Biorhythms are not proven

Various attempts have been made to validate this biorhythm model with inconclusive results. It is fair to say that this particular definition of physical, emotional, and intellectual cycles has not been proven. I do not myself subscribe to it nor have ever attempted to follow it. My point is mainly to draw an analogy. What if fluctuations in global temperatures are the combined results from multiple cycles of varying lengths?

milankovitch_cycles

What About Climate Biorhythms

At the longer end, we have astronomical cycles on millennial scales, and at the shorter end, we have seasonal cycles. In between there are a dozen or so oceanic cycles, such as ENSO, AMO, and AMOC, that have multi-decadal phases. Then there are solar cycles, ranging from basic quasi-11 year sunspot cycles, to other centennial maxs and mins. AARI scientists have documented a quasi-60 year cycle in Arctic ice extents. ETH Zurich has a solar radiation database showing an atmospheric sunscreen that alternatively dims or brightens the incoming sunshine over decades (see Nature’s Sunscreen).

It could be that observed warming and cooling periods occur when several more powerful cycles coincide in their phases. For example, we are at the moment anticipating an unusually quiet solar cycle, a Pacific Decadal Oscillation (PDO) negative phase, a cooler North Atlantic (AMO), and possibly a dimming period. Will that coincidence result in temperatures dropping? Was the Little Ice Age caused and then ended after 1850 by such a coincidence of climate biorhythms?

Summary

Our knowledge of these cycles is confounded by not yet untangling them to see individual periodicities, as a basis for probing into their interactions and combined influences.  Until that day, we should refrain from picking on one thing, like CO2, as though it were a control knob for the whole climate.

Nature’s Sunscreen

Greenhouse with adjustable sun screens to control warming.

A recent post Planetary Warming: Back to Basics discussed a recent paper by Nikolov and Zeller on the atmospheric thermal effect measured on various planets in our solar system. They mentioned that an important source of temperature variation around the earth’s energy balance state can be traced to global brightening and dimming.

This post explores the fact of fluctuations in the amount of solar energy reflected rather than absorbed by the atmosphere and surface. Brightening refers to more incoming solar energy from clear and clean skies. Dimming refers to less solar energy due to more sunlight reflected in the atmosphere by the presence of clouds and aerosols (air-born particles like dust and smoke).

The energy budget above from ERBE shows how important is this issue. On average, half of sunlight is either absorbed in the atmosphere or reflected before it can be absorbed by the surface land and ocean. Any shift in the reflectivity (albedo) impacts greatly on the solar energy warming the planet.

The leading research on global brightening/dimming is done at the Institute for Atmospheric and Climate Science of ETH Zurich, led by Martin Wild, senior scientist specializing in the subject.

Special instruments have been recording the solar radiation that reaches the Earth’s surface since 1923. However, it wasn’t until the International Geophysical Year in 1957/58 that a global measurement network began to take shape. The data thus obtained reveal that the energy provided by the sun at the Earth’s surface has undergone considerable variations over the past decades, with associated impacts on climate.

The initial studies were published in the late 1980s and early 1990s for specific regions of the Earth. In 1998 the first global study was conducted for larger areas, like the continents Africa, Asia, North America and Europe for instance.

Now ETH has announced The Global Energy Balance Archive (GEBA) version 2017: A database for worldwide measured surface energy fluxes. The title is a link to that paper published in May 2017 explaining the facility and some principal findings. The Archive itself is at  http://www.geba.ethz.ch.

For example, Figure 2 below provides the longest continuous record available in GEBA: surface downward shortwave radiation measured in Stockholm since 1922. Five year moving average in blue, 4th order regression model in red. Units Wm-2. Substantial multidecadal variations become evident, with an increase up to the 1950s (“early brightening”), an overall decline from the 1950s to the 1980s (“dimming”), and a recovery thereafter (“brightening”).
Figure 5. Composite of 56 European GEBA time series of annual surface downward shortwave radiation (thin line) from 1939 to 2013, plotted together with a 21 year Gaussian low-pass filter ((thick line). The series are expressed as anomalies (in Wm-2) from the 1971–2000 mean. Dashed lines are used prior to 1961 due to the lower number of records for this initial period. Updated from Sanchez-Lorenzo et al. (2015) including data until December 2013.
Martin Wild explains in a 2016 article Decadal changes in radiative fluxes at land and ocean surfaces and their relevance for global warming. From the Conclusion (SSR refers to solar radiation incident upon the surface)

However, observations indicate not only changes in the downward thermal fluxes, but even more so in their solar counterparts, whose records have a much wider spatial and temporal coverage. These records suggest multidecadal variations in SSR at widespread land-based observation sites. Specifically, declining tendencies in SSR between the 1950s and 1980s have been found at most of the measurement sites (‘dimming’), with a partial recovery at many of the sites thereafter (‘brightening’).

With the additional information from more widely measured meteorological quantities which can serve as proxies for SSR (primarily sunshine duration and DTR), more evidence for a widespread extent of these variations has been provided, as well as additional indications for an overall increasing tendency in SSR in the first part of the 20th century (‘early brightening’).

It is well established that these SSR variations are not caused by variations in the output of the sun itself, but rather by variations in the transparency of the atmosphere for solar radiation. It is still debated, however, to what extent the two major modulators of the atmospheric transparency, i.e., aerosol and clouds, contribute to the SSR variations.

The balance of evidence suggests that on longer (multidecadal) timescales aerosol changes dominate, whereas on shorter (decadal to subdecadal) timescales cloud effects dominate. More evidence is further provided for an increasing influence of aerosols during the course of the 20th century. However, aerosol and clouds may also interact, and these interactions were hypothesized to have the potential to amplify and dampen SSR trends in pristine and polluted areas, respectively.

No direct observational records are available over ocean surfaces. Nevertheless, based on the presented conceptual ideas of SSR trends amplified by aerosol–cloud interactions over the pristine oceans, modeling approaches as well as the available satellite-derived records it appears plausible that also over oceans significant decadal changes in SSR occur.

The coinciding multidecadal variations in SSTs and global aerosol emissions may be seen as a smoking gun, yet it is currently an open debate to what extent these SST variations are forced by aerosol-induced changes in SSR, effectively amplified by aerosol– cloud interactions, or are merely a result of unforced natural variations in the coupled ocean atmosphere system. Resolving this question could state a major step toward a better understanding of multidecadal climate change.

9959227_orig

Another paper co-authored by Wild discusses the effects of aerosols and clouds The solar dimming/brightening effect over the Mediterranean Basin in the period 1979 − 2012. (NSWR is Net Short Wave Radiation, that is equal to surface solar radiation less reflected)

The analysis reveals an overall increasing trend in NSWR (all skies) corresponding to a slight solar brightening over the region (+0.36 Wm−2per decade), which is not statistically significant at 95% confidence level (C.L.). An increasing trend(+0.52 Wm−2per decade) is also shown for NSWR under clean skies (without aerosols), which is statistically significant (P=0.04).

This indicates that NSWR increases at a higher rate over the Mediterranean due to cloud variations only, because of a declining trend in COD (Cloud Optical Depth). The peaks in NSWR (all skies) in certain years (e.g., 2000) are attributed to a significant decrease in COD (see Figs. 9 and 10), whilethe two data series (NSWRall and NSWRclean) are highly correlated(r=0.95).

This indicates that cloud variation is the major regulatory factor for the amount and multi-decadal trends in NSWR over the Mediterranean Basin. (Note: Lower cloud optical depth is caused by less opaque clouds and/or decrease in overall cloudiness)

On the other hand, the results do not reveal a reversal from dimming to brightening during 1980s, as shown in several studies over Europe (Norris and Wild, 2007;Sanchez-Lorenzoet al., 2015), but a rather steady slight increasing trend in solar radiation, which, however, seems to be stabilized during the last years of the data series, in agreement with Sanchez-Lorenzo et al. (2015). Similarly, Wild (2012) reported that the solar brightening was less distinct at European sites after 2000 compared to the 1990s.

In contrast, the NSWR under clear (cloudless) skies shows a slight but statistically significant decreasing trend (−0.17 Wm−2per decade,P=0.002), indicating an overall decrease in NSWR over the Mediterranean due to water-vapor variability suggesting a transition to more humid environment under a warming climate.

Other researchers find cloudiness more dominant than aerosols. For example, The cause of solar dimming and brightening at the Earth’s surface during the last half century: Evidence from measurements of sunshine duration by Gerald Stanhill et al.

Analysis of the Angstrom-Prescott relationship between normalized values of global radiation and sunshine duration measured during the last 50 years made at five sites with a wide range of climate and aerosol emissions showed few significant differences in atmospheric transmissivity under clear or cloud-covered skies between years when global dimming occurred and years when global brightening was measured, nor in most cases were there any significant changes in the parameters or in their relationships to annual rates of fossil fuel combustion in the surrounding 1° cells. It is concluded that at the sites studied changes in cloud cover rather than anthropogenic aerosols emissions played the major role in determining solar dimming and brightening during the last half century and that there are reasons to suppose that these findings may have wider relevance.

Summary

The final words go to Martin Wild from Enlightening Global Dimming and Brightening.

Observed Tendencies in surface solar radiation
Figure 2.  Changes in surface solar radiation observed in regions with good station coverage during three periods.(left column) The 1950s–1980s show predominant declines (“dimming”), (middle column) the 1980s–2000 indicate partial recoveries (“brightening”) at many locations, except India, and (right column) recent developments after 2000 show mixed tendencies. Numbers denote typical literature estimates for the specified region and period in W m–2 per decade.  Based on various sources as referenced in Wild (2009).

The latest updates on solar radiation changes observed since the new millennium show no globally coherent trends anymore (see above and Fig. 2). While brightening persists to some extent in Europe and the United States, there are indications for a renewed dimming in China associated with the tremendous emission increases there after 2000, as well as unabated dimming in India (Streets et al. 2009; Wild et al. 2009).

We cannot exclude the possibility that we are currently again in a transition phase and may return to a renewed overall dimming for some years to come.

One can’t help but see the similarity between dimming/brightening and patterns of Global Mean Temperature, such as HadCrut.

Footnote: For more on clouds, precipitation and the ocean, see Here Comes the Rain Again

Planetary Warming: Back to Basics

which20moons20have20atmospheres

It is often said we must rely on projections from computer simulations of earth’s climate since we have no other earth on which to experiment. That is not actually true since we have observations upon a number of planetary objects in our solar system that also have atmospheres.

This is brought home by a paper, published recently in the journal “Environment Pollution and Climate Change,” written by Ned Nikolov, a Ph.D. in physical science, and Karl Zeller, retired Ph.D. research meteorologist. (title is link to paper).  H/T to Tallbloke for posting on this (here) along with comments by one of the authors.

New Insights on the Physical Nature of the Atmospheric Greenhouse Effect Deduced from an Empirical Planetary Temperature Model

Nikolov and Zeller have written before on this topic, but this paper takes advantage of data from recent decades of space exploration as well as improved observatories. It is thorough, educational and makes a convincing case that a planet’s surface temperatures can be predicted from two variables: distance from the sun, and the atmospheric mass. This post provides some excerpts and exhibits as a synopsis, hopefully to encourage reading the paper itself.

Abstract

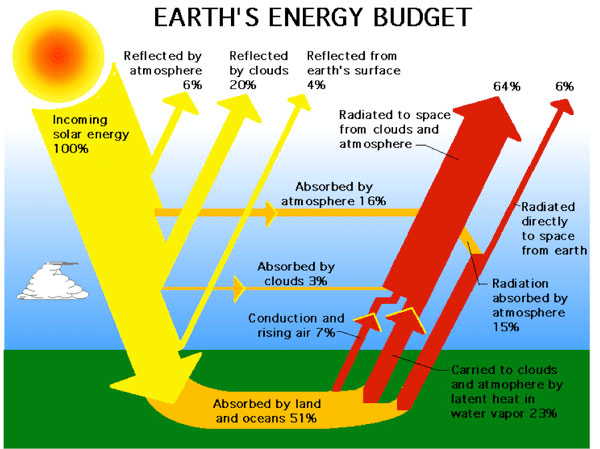
A recent study has revealed that the Earth’s natural atmospheric greenhouse effect is around 90 K or about 2.7 times stronger than assumed for the past 40 years. A thermal enhancement of such a magnitude cannot be explained with the observed amount of outgoing infrared long-wave radiation absorbed by the atmosphere (i.e. ≈ 158 W m-2), thus requiring a re-examination of the underlying Greenhouse theory.

We present here a new investigation into the physical nature of the atmospheric thermal effect using a novel empirical approach toward predicting the Global Mean Annual near-surface equilibrium Temperature (GMAT) of rocky planets with diverse atmospheres. Our method utilizes Dimensional Analysis (DA) applied to a vetted set of observed data from six celestial bodies representing a broad range of physical environments in our Solar System, i.e. Venus, Earth, the Moon, Mars, Titan (a moon of Saturn), and Triton (a moon of Neptune).

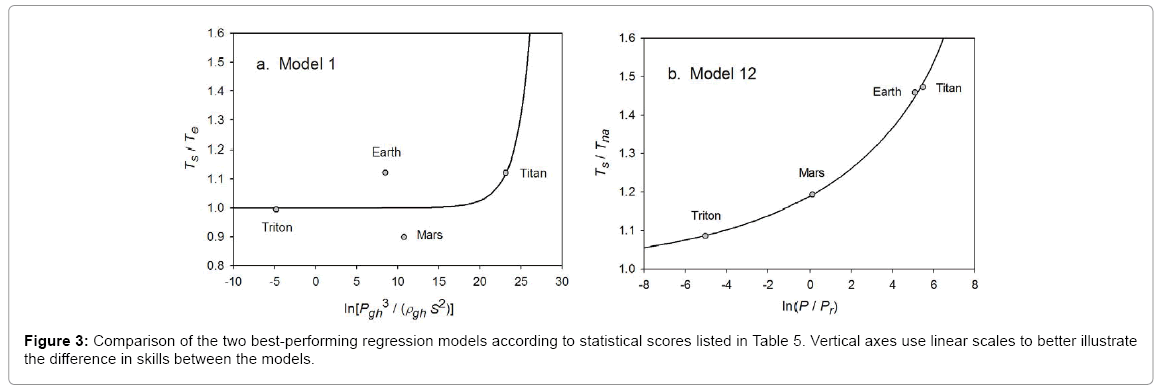
Twelve relationships (models) suggested by DA are explored via non-linear regression analyses that involve dimensionless products comprised of solar irradiance, greenhouse-gas partial pressure/density and total atmospheric pressure/density as forcing variables, and two temperature ratios as dependent variables. One non-linear regression model is found to statistically outperform the rest by a wide margin.

Venus is a furnace of a planet, with a noxious atmosphere bearing a pressure 90 times that on Earth. Courtesy NASA/JPL

Above: Venusian Atmosphere

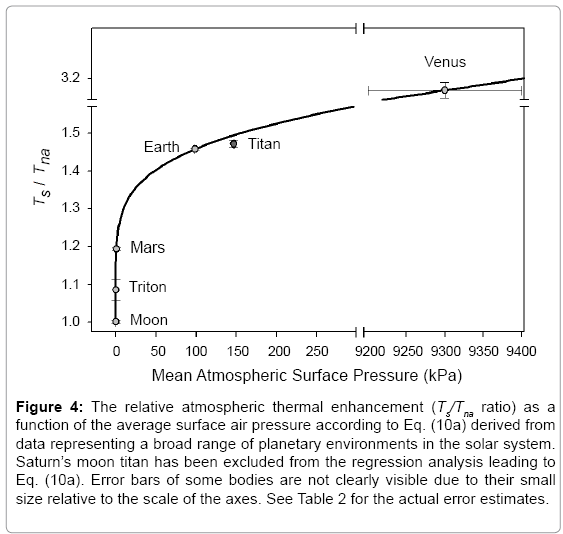
Our analysis revealed that GMATs of rocky planets with tangible atmospheres and a negligible geothermal surface heating can accurately be predicted over a broad range of conditions using only two forcing variables: top-of-the-atmosphere solar irradiance and total surface atmospheric pressure. The hereto discovered interplanetary pressure-temperature relationship is shown to be statistically robust while describing a smooth physical continuum without climatic tipping points.

This continuum fully explains the recently discovered 90 K thermal effect of Earth’s atmosphere. The new model displays characteristics of an emergent macro-level thermodynamic relationship heretofore unbeknown to science that has important theoretical implications. A key entailment from the model is that the atmospheric ‘greenhouse effect’ currently viewed as a radiative phenomenon is in fact an adiabatic (pressure-induced) thermal enhancement analogous to compression heating and independent of atmospheric composition. (my bold)

Earth Atmosphere Density and Temperature Profile

Consequently, the global down-welling long-wave flux presently assumed to drive Earth’s surface warming appears to be a product of the air temperature set by solar heating and atmospheric pressure. In other words, the so-called ‘greenhouse back radiation’ is globally a result of the atmospheric thermal effect rather than a cause for it. (my bold)

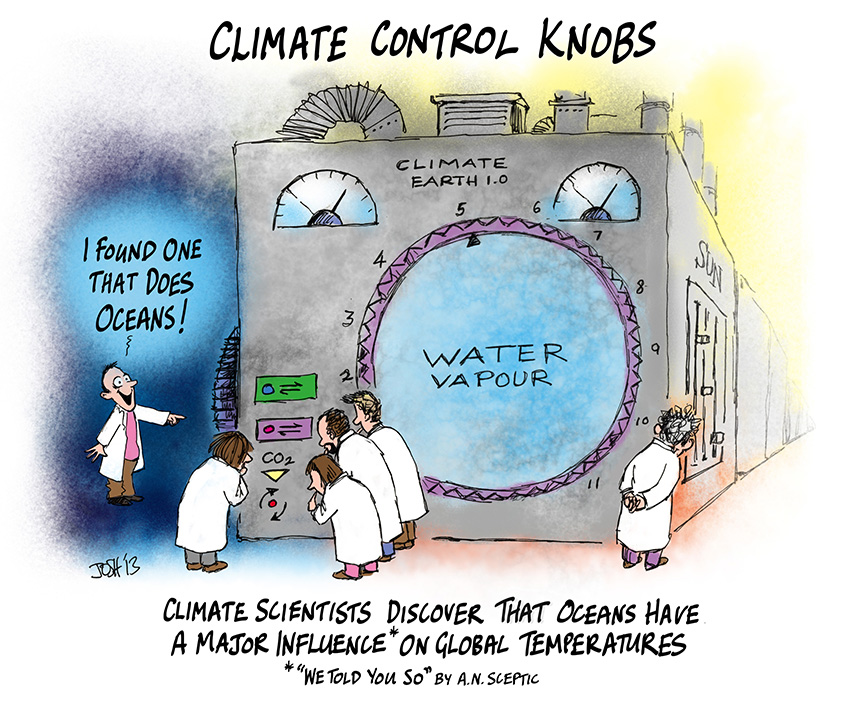
Our empirical model has also fundamental implications for the role of oceans, water vapour, and planetary albedo in global climate. Since produced by a rigorous attempt to describe planetary temperatures in the context of a cosmic continuum using an objective analysis of vetted observations from across the Solar System, these findings call for a paradigm shift in our understanding of the atmospheric ‘greenhouse effect’ as a fundamental property of climate.

The research effort demonstrates sound scientific research: data and sources are fully explained, the pattern analysis is replicable, and the conclusions set forth in a logical manner. Alternative hypotheses were explored and rejected in favor of one explaining observations to near perfection, and also showing applicability to other cases.

Equation (10a) implies that GMATs of rocky planets can be calculated as a product of two quantities: the planet’s average surface temperature in the absence of an atmosphere (Tna, K) and a nondimensional factor (Ea ≥ 1.0) quantifying the relative thermal effect of the atmosphere.

As an example of technical descriptions, consider how the paper describes issues relating to the calculation of Tna.

For bodies with tangible atmospheres (such as Venus, Earth, Mars, Titan and Triton), one must calculate Tna using αe=0.132 and ηe=0.00971, which assumes a Moon-like airless reference surface in accordance with our pre-analysis premise. For bodies with tenuous atmospheres (such as Mercury, the Moon, Calisto and Europa), Tna should be calculated from Eq. (4a) (or Eq. 4b respectively if S>0.15 W m-2 and/or Rg ≈ 0 W m-2) using the body’s observed values of Bond albedo αe and ground heat storage fraction ηe.

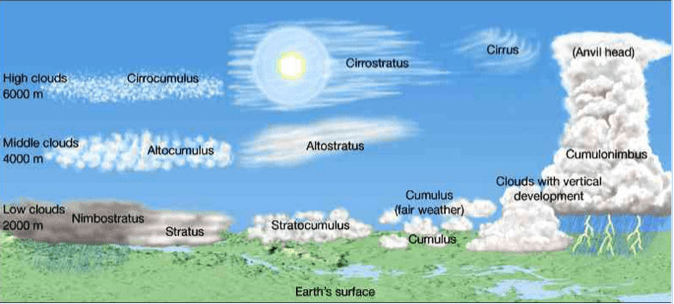
In the context of this model, a tangible atmosphere is defined as one that has significantly modified the optical and thermo-physical properties of a planet’s surface compared to an airless environment and/or noticeably impacted the overall planetary albedo by enabling the formation of clouds and haze. A tenuous atmosphere, on the other hand, is one that has not had a measurable influence on the surface albedo and regolith thermos-physical properties and is completely transparent to shortwave radiation.

The need for such delineation of atmospheric masses when calculating Tna arises from the fact that Eq. (10a) accurately describes RATEs of planetary bodies with tangible atmospheres over a wide range of conditions without explicitly accounting for the observed large differences in albedos (i.e., from 0.235 to 0.90) while assuming constant values of αe and ηe for the airless equivalent of these bodies. One possible explanation for this counterintuitive empirical result is that atmospheric pressure alters the planetary albedo and heat storage properties of the surface in a way that transforms these parameters from independent controllers of the global temperature in airless bodies to intrinsic byproducts of the climate system itself in worlds with appreciable atmospheres. In other words, once atmospheric pressure rises above a certain level, the effects of albedo and ground heat storage on GMAT become implicitly accounted for by Eq. (11). (my bold)

Significance

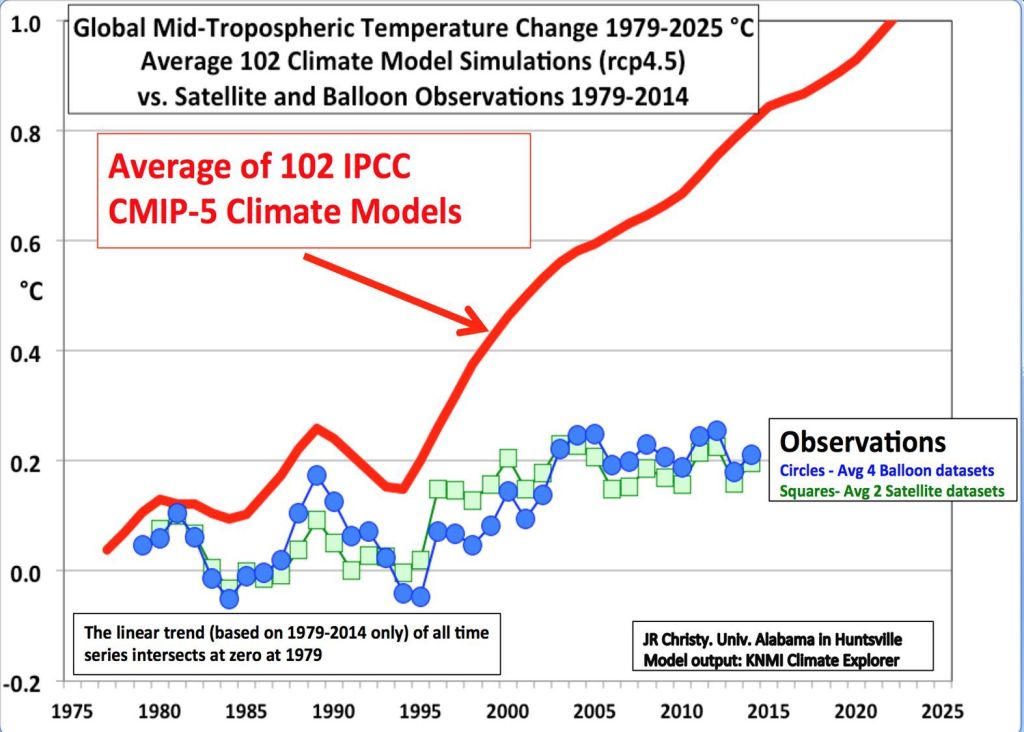
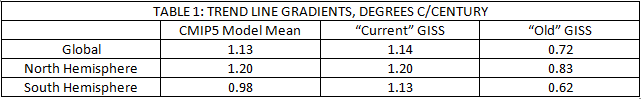
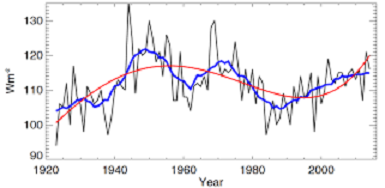
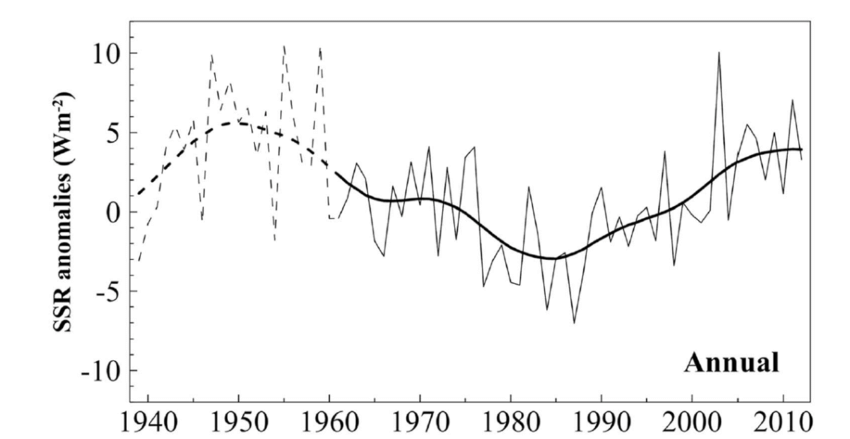
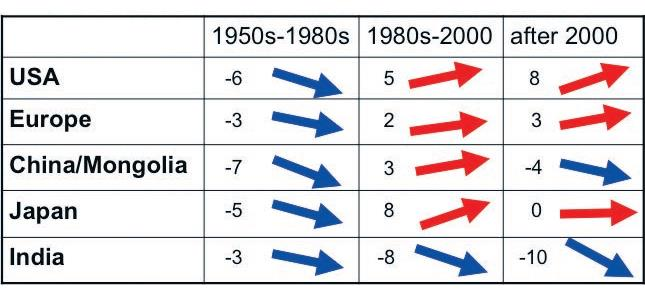
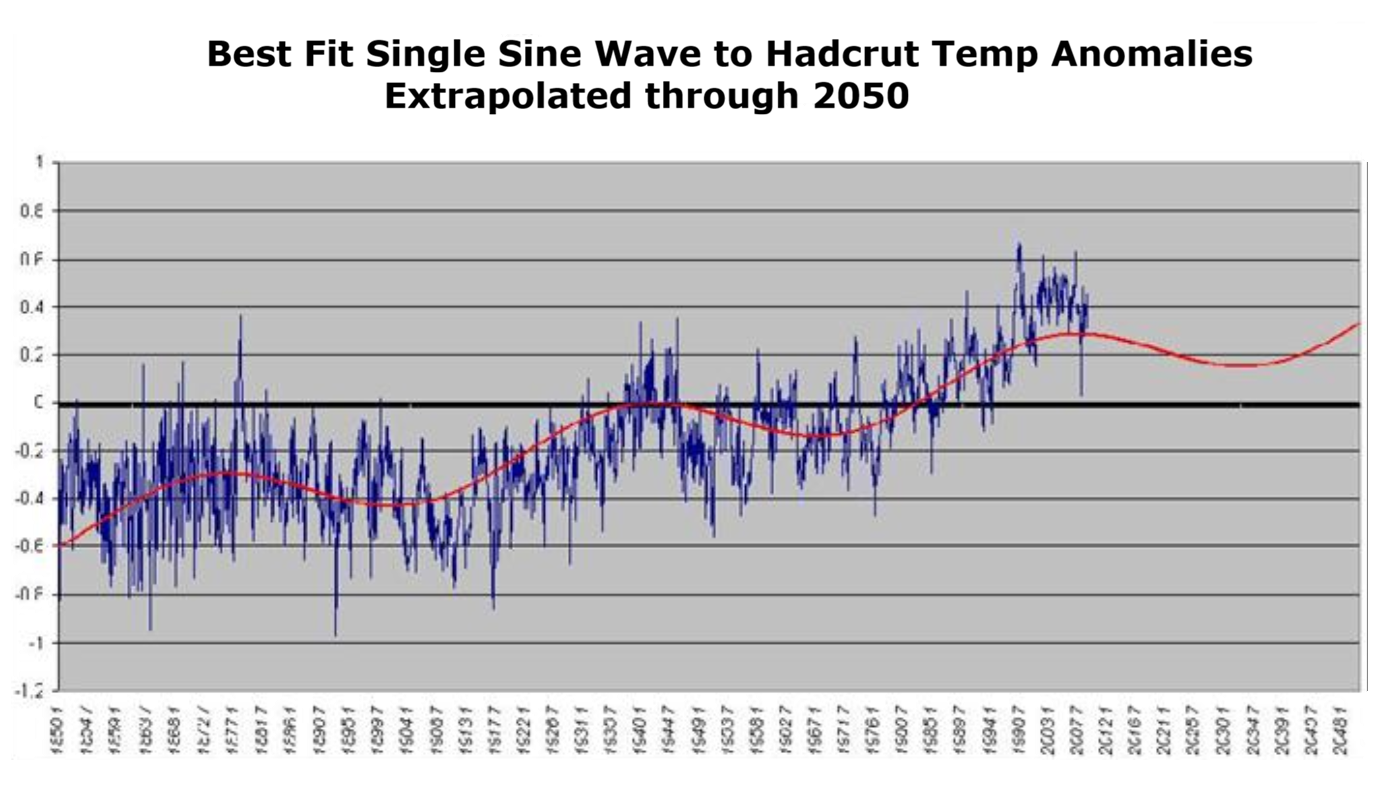
Equation (10b) describes the long-term (30 years) equilibrium GMATs of planetary bodies and does not predict inter-annual global temperature variations caused by intrinsic fluctuations of cloud albedo and/or ocean heat uptake. Thus, the observed 0.82 K rise of Earth’s global temperature since 1880 is not captured by our model, since this warming was likely not the result of an increased atmospheric pressure. Recent analyses of observed dimming and brightening periods worldwide [97-99] suggest that the warming over the past 130 years might have been caused by a decrease in global cloud cover and a subsequent increased absorption of solar radiation by the surface. Similarly, the mega shift of Earth’s climate from a ‘hothouse’ to an ‘icehouse’ evident in the sedimentary archives over the past 51 My cannot be explained by Eq. (10b) unless caused by a large loss of atmospheric mass and a corresponding significant drop in surface air pressure since the early Eocene.

Role of greenhouse gases from the new model perspective

Our analysis revealed a poor relationship between GMAT and the amount of greenhouse gases in planetary atmospheres across a broad range of environments in the Solar System (Figures 1-3 and Table 5). This is a surprising result from the standpoint of the current Greenhouse theory, which assumes that an atmosphere warms the surface of a planet (or moon) via trapping of radiant heat by certain gases controlling the atmospheric infrared optical depth [4,9,10]. The atmospheric opacity to LW radiation depends on air density and gas absorptivity, which in turn are functions of total pressure, temperature, and greenhouse-gas concentrations [9]. Pressure also controls the broadening of infrared absorption lines in individual gases. Therefore, the higher the pressure, the larger the infrared optical depth of an atmosphere, and the stronger the expected greenhouse effect would be. According to the present climate theory, pressure only indirectly affects global surface temperature through the atmospheric infrared opacity and its presumed constraint on the planet’s LW emission to Space [9,107].

The artificial decoupling between radiative and convective heat-transfer processes adopted in climate models leads to mathematically and physically incorrect solutions with regard to surface temperature. The LW radiative transfer in a real climate system is intimately intertwined with turbulent convection/advection as both transport mechanisms occur simultaneously. Since convection (and especially the moist one) is orders of magnitude more efficient in transferring energy than LW radiation [3,4], and because heat preferentially travels along the path of least resistance, a properly coupled radiative-convective algorithm of energy exchange will produce quantitatively and qualitatively different temperature solutions in response to a changing atmospheric composition than the ones obtained by current climate models. Specifically, a correctly coupled convective-radiative system will render the surface temperature insensitive to variations in the atmospheric infrared optical depth, a result indirectly supported by our analysis as well. This topic requires further investigation beyond the scope of the present study. (my bold)

The direct effect of atmospheric pressure on the global surface temperature has received virtually no attention in climate science thus far. However, the results from our empirical data analysis suggest that it deserves a serious consideration in the future.

How did Saturn’s moon Titan secure an atmosphere when no other moons in the solar system did? The answer lies largely in its size and location. Here, Titan as imaged in May 2005 by the Cassini spacecraft from about 900,000 miles away. Photo credit: Courtesy NASA/JPL/Space Science Institute

Physical nature of the atmospheric ‘greenhouse effect’

According to Eq. (10b), the heating mechanism of planetary atmospheres is analogous to a gravity-controlled adiabatic compression acting upon the entire surface. This means that the atmosphere does not function as an insulator reducing the rate of planet’s infrared cooling to space as presently assumed [9,10], but instead adiabatically boosts the kinetic energy of the lower troposphere beyond the level of solar input through gas compression. Hence, the physical nature of the atmospheric ‘greenhouse effect’ is a pressure-induced thermal enhancement independent of atmospheric composition. (my bold)

This mechanism is fundamentally different from the hypothesized ‘trapping’ of LW radiation by atmospheric trace gases first proposed in the 19th century and presently forming the core of the Greenhouse climate theory. However, a radiant-heat trapping by freely convective gases has never been demonstrated experimentally. We should point out that the hereto deduced adiabatic (pressure-controlled) nature of the atmospheric thermal effect rests on an objective analysis of vetted planetary observations from across the Solar System and is backed by proven thermodynamic principles, while the ‘trapping’ of LW radiation by an unconstrained atmosphere surmised by Fourier, Tyndall and Arrhenius in the 1800s was based on a theoretical conjecture. The latter has later been coded into algorithms that describe the surface temperature as a function of atmospheric infrared optical depth (instead of pressure) by artificially decoupling radiative transfer from convective heat exchange. Note also that the Ideal Gas Law (PV=nRT) forming the basis of atmospheric physics is indifferent to the gas chemical composition. (my bold)

Climate stability

Our semi-empirical model (Equations 4a, 10b and 11) suggests that, as long as the mean annual TOA solar flux and the total atmospheric mass of a planet are stationary, the equilibrium GMAT will remain stable. Inter-annual and decadal variations of global temperature forced by fluctuations of cloud cover, for example, are expected to be small compared to the magnitude of the background atmospheric warming because of strong negative feedbacks limiting the albedo changes. This implies a relatively stable climate for a planet such as Earth absent significant shifts in the total atmospheric mass and the planet’s orbital distance to the Sun. Hence, planetary climates appear to be free of tipping points, i.e., functional states fostering rapid and irreversible changes in the global temperature as a result of hypothesized positive feedbacks thought to operate within the system. In other words, our results suggest that the Earth’s climate is well buffered against sudden changes.

The hypothesis that a freely convective atmosphere could retain (trap) radiant heat due its opacity has remained undisputed since its introduction in the early 1800s even though it was based on a theoretical conjecture that has never been proven experimentally. It is important to note in this regard that the well-documented enhanced absorption of thermal radiation by certain gases does not imply an ability of such gases to trap heat in an open atmospheric environment. This is because, in gaseous systems, heat is primarily transferred (dissipated) by convection (i.e., through fluid motion) rather than radiative exchange.  (my bold)

If gases of high LW absorptivity/emissivity such as CO2, methane and water vapor were indeed capable of trapping radiant heat, they could be used as insulators. However, practical experience has taught us that thermal radiation losses can only be reduced by using materials of very low IR absorptivity/emissivity and correspondingly high thermal reflectivity such as aluminum foil. These materials are known among engineers at NASA and in the construction industry as radiant barriers [129]. It is also known that high-emissivity materials promote radiative cooling. Yet, all climate models proposed since 1800s were built on the premise that the atmosphere warms Earth by limiting radiant heat losses of the surface through to the action of IR absorbing gases aloft.

If a trapping of radiant heat occurred in Earth’s atmosphere, the same mechanism should also be expected to operate in the atmospheres of other planetary bodies. Thus, the Greenhouse concept should be able to mathematically describe the observed variation of average planetary surface temperatures across the Solar System as a continuous function of the atmospheric infrared optical depth and solar insolation. However, to our knowledge, such a continuous description (model) does not exist. 

Summary

The planetary temperature model consisting of Equations (4a), (10b), (11) has several fundamental theoretical implications, i.e.,
• The ‘greenhouse effect’ is not a radiative phenomenon driven by the atmospheric infrared optical depth as presently believed, but a pressure-induced thermal enhancement analogous to adiabatic heating and independent of atmospheric composition;
• The down-welling LW radiation is not a global driver of surface warming as hypothesized for over 100 years but a product of the near-surface air temperature controlled by solar heating and atmospheric pressure;
• The albedo of planetary bodies with tangible atmospheres is not an independent driver of climate but an intrinsic property (a byproduct) of the climate system itself. This does not mean that the cloud albedo cannot be influenced by external forcing such as solar wind or galactic cosmic rays. However, the magnitude of such influences is expected to be small due to the stabilizing effect of negative feedbacks operating within the system. This novel understanding explains the observed remarkable stability of planetary albedos;
• The equilibrium surface temperature of a planet is bound to remain stable (i.e., within ± 1 K) as long as the atmospheric mass and the TOA mean solar irradiance are stationary. Hence, Earth’s climate system is well buffered against sudden changes and has no tipping points;
• The proposed net positive feedback between surface temperature and the atmospheric infrared opacity controlled by water vapor appears to be a model artifact resulting from a mathematical decoupling of the radiative-convective heat transfer rather than a physical reality.

Update July 13, 2017

Michael Lewis pointed to a link on this subject in his comment below.  Reading again the discussion thread, I appreciated again this point by point response from Kristian to Tim Folkerts so I am adding it to the post. (To be clear, T_e means emission temperature (same as Tna in the article above, while T_s means surface temperature.)

Kristian says:

August 4, 2016 at 9:24 AM

Tim Folkerts says, August 3, 2016 at 3:33 PM:
“In any case, it seems we both agree that the atmosphere has some warming effect.”
That’s quite obvious. You only need to compare Earth’s T_s with the Moon’s.

“I agree that the mass itself plays a role. Mass creates thermal inertia to even out temperature swings. The mass of the atmosphere (and oceans) also allows convection to carry energy from warmer areas to cooler areas, which further reduces variations. By themselves, these could do no more than bring T_s UP TOWARD T_e.”
True.

“I see no physics that would explain mass itself raising T_s ABOVE T_e.”
Just as the radiative properties of gaseous molecules are also not able – all by themselves – to raise a planet’s T_s above its T_e. No, both mass and radiative properties are needed.

“To get above T_e we need something to change the outgoing thermal radiation, eg GHGs at a high enough altitude to be significantly cooler than the surface.”
Yes, but then we also need an air column above the solar-heated surface that can have such a “high enough altitude” in the first place. We also need that altitude to be cooler on average than the surface. IOW, we need mass. A certain gas density/pressure (molecular interaction). And we need fluid dynamics.

“So the key factor is ALTITUDE here (with some definite dependence of the concentrations of the GHGs as well).”
No. There is no dependence on the CONCENTRATION/CONTENT of IR-active constituents in an atmosphere. An atmosphere definitely needs to be IR active (although it’s evidently not enough) for a planet’s T_s to become higher than its T_e. It also needs to be IR active to be able to adequately rid itself of its absorbed energy from the surface (radiatively AND non-radiatively transferred) and directly from the Sun. But once it’s IR active, there is no dependence on the degree of activity. Because then the atmosphere has become stably convectively operative. And all that matters from then on is atmospheric MASS and SOLAR INPUT (TSI and global albedo).

“You say that atmospheric mass seems to force. Do you think that mass alone without GHGs could force temperatures higher than T_e?”
No. Just like “GHGs” alone could also not force T_s higher than T_e. You need both.
* * *
So I say: There IS a “GHE”. But it’s ultimately massively caused. The radiative properties are simply a tool. A means to an end. And there definitely ISN’T an “anthropogenically enhanced GHE” (AGW). It cannot happen.
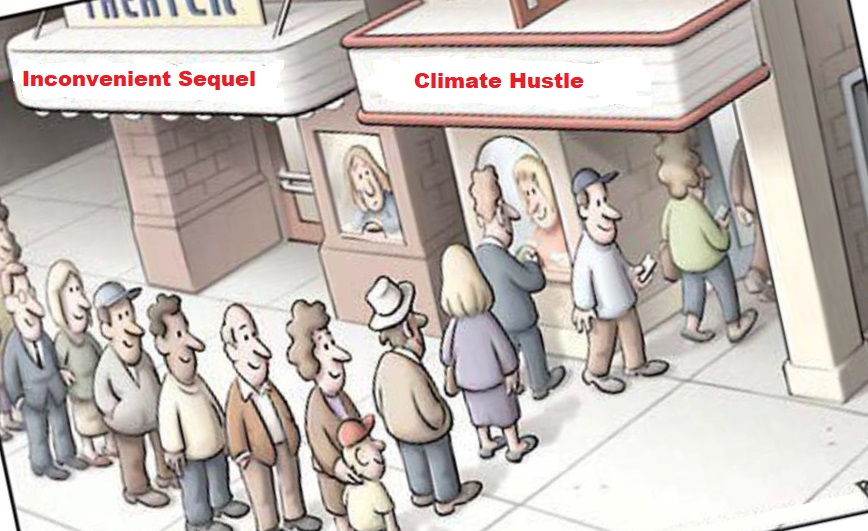


Climate Compilation II Arctic Sea Ice

The background for the compilation series is provided in the first post along with my starting point analyzing temperature records. See Climate Compilation Part I Temperatures

Compilation II Arctic Sea Ice (link to category) 

Another preoccupation has been the fluctuating Arctic Sea Ice extents. I noticed that warmists were quite focused on this issue, especially the annual minimums in September. And despite the long record of ice charts prepared by naval authorities, all the ice watchers referred almost exclusively to the satellite estimates, especially the NASA team results published as the Sea Ice Index (SII) on NSIDC.

In the past some researchers had preferred the ice charts from the NIC (US Naval Ice Center, now National Ice Center) and noted differences between operational observations from NIC and the satellite estimates that rely on passive microwave sensors. The NIC index is called MASIE (Multisensor Analyzed Sea Ice Extent), has a higher resolution, higher threshold for declaring a grid cell ice-filled, and generally shows more ice extent than SII.

MASIE: “high-resolution, accurate charts of ice conditions”
Walt Meier, NSIDC, October 2015 article in Annals of Glaciology.

My concern is to raise awareness of a high quality sea ice record that has been largely ignored by a myopic focus on satellite estimates. Periodic ice reports can be found on this blog on a bi-monthly basis.

Sometimes there are storms or other surprising events to report, such as the late additional freezing in January that trapped Russian ships shown in the image above and posted as Arctic Ice Takes Revenge.

Last year it was also interesting to follow the progress of the Polar Challenge sailing ship Northabout as well as the cruise ship Serenity passing through the Arctic seas and the Canadian Arctic Archipelago. For example see Arctic Ships Past Halfway from Aug. 29, 2016.

This category also includes several discussions of research into the Arctic climate system from lesser-known but highly regarded sources like the prestigious AARI: Arctic and Antarctic Research Institute St. Petersburg, Russia. See Arctic Sea Ice: Self-Oscillating System and The Great Arctic Ice Exchange

Over time I have learned how to use the visual files MASIE provides in Google Earth formats. For example, these images of sea ice waxing and waning in Hudson Bay.

Hudson Bay is providing a great example how ice extents can change dramatically in such a relatively shallow basin near the Arctic circle. Last December 2016 some concerns were expressed about the lack of ice in Hudson Bay, which were suddenly overcome in ten days starting December 9. Watch:

Now fast-forward to this spring 2017 when ice was persisting strongly in both Baffin and Hudson Bays. Starting ten days ago on June 18 Summer is showing us how quickly goes the opposite effect, including a major meltdown the last two days. On the right side you can see Newfoundlanders are finally rid of their ice.

For an overview of Arctic Ice Watching along with some amusement, see Ice House of Mirrors.

For a comparison of SII and MASIE see A Tale of Two Indices