Data vs. Models #4: Climates Changing

188767-004-6bde1150

Köppen climate zones as they appear in the 21st Century.

Every day there are reports like this:

An annual breach of 2 degrees could happen as soon as 2030, according to climate model simulations, although there’s always the chance that climate models are slightly underestimating or overestimating how close we are to that date. Writing with fellow meteorologist Jeff Masters for Weather Underground, Bob Henson said the current spike means “we are now hurtling at a frightening pace toward the globally agreed maximum of 2.0°C warming over pre-industrial levels.”

That abstract, mathematically averaged world, the subject of so much media space and alarm, has almost nothing to do with the world where any of us live. Because nothing on our planet moves in unison.

Start with the hemispheres:

Notice that the global temperature tracks with the seasons of the NH. The reason for this is simple. The NH has twice as much land as the Southern Hemisphere (SH). Oceans have greater heat capacity and do not change temperatures as much as land does. So every year when there is almost a 4 °C swing in the temperature of the Earth, it follows the seasons of the NH. This is especially interesting because the Earth gets the most energy from the sun in January right now. That is because of the orbit of the Earth. The perihelion is when the Earth is closest to the sun and that currently takes place in January.

Using round numbers, the Northern Hemisphere (NH) half of the total surface combines 20% land with 30% ocean, while the SH comprises 9% land with 41% ocean. With the oceans having huge heat capacities relative to the land, the NH has much more volatility in temperatures than does the SH. But more importantly, the trends in multi-decadal warming and cooling also differ.

Climates Are Found Down in the Weeds

The top-down global view needs to be supplemented with a bottom-up appreciation of the diversity of climates and their changes.

slide_4


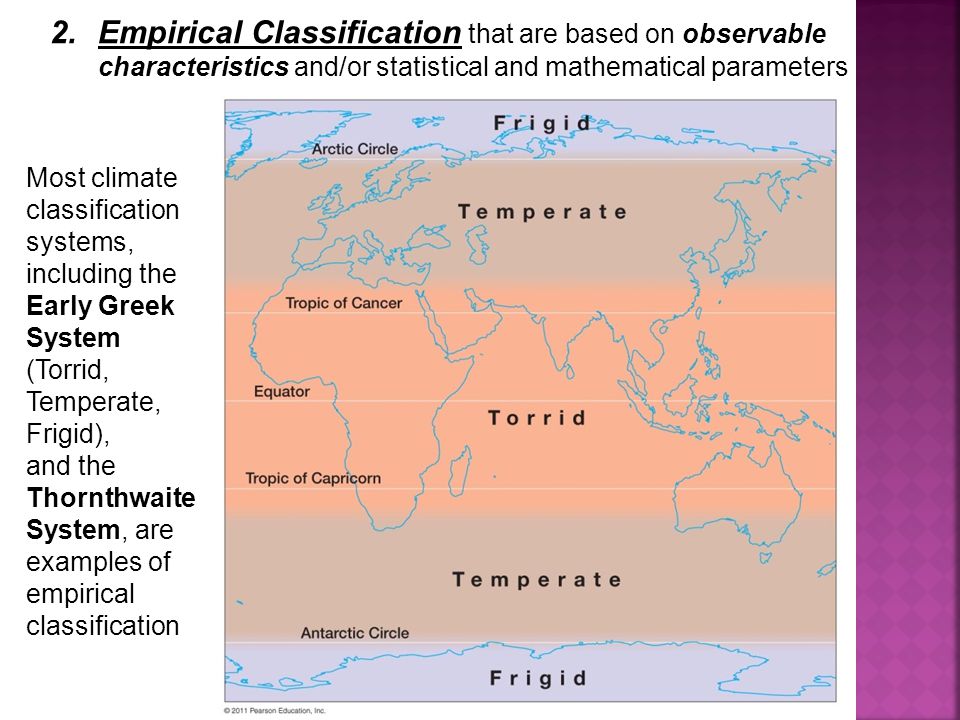
The ancient Greeks were the first to classify climate zones. From their travels and sea-faring experiences, they called the equatorial regions Torrid, due to the heat and humidity. The mid-latitudes were considered Temperate, including their home Mediterranean Sea. Further North and South, they knew places were Frigid.

Based on empirical observations, Köppen (1900) established a climate classification system which uses monthly temperature and precipitation to define boundaries of different climate types around the world. Since its inception, this system has been further developed (e.g. Köppen and Geiger, 1930; Stern et al., 2000) and widely used by geographers and climatologists around the world.

Köppen and Climate Change

The focus is on differentiating vegetation regimes, which result primarily from variations in temperature and precipitation over the seasons of the year. Now we have an interesting study that considers shifts in Köppen climate zones over time in order to identify changes in climate as practical and local/regional realities.

The paper is: Using the Köppen classification to quantify climate variation and change: An example for 1901–2010
By Deliang Chen and Hans Weiteng Chen
Department of Earth Sciences, University of Gothenburg, Sweden

Hans Chen has built an excellent interactive website (here): The purpose of this website is to share information about the Köppen climate classification, and provide data and high-resolution figures from the paper Chen and Chen, 2013: Using the Köppen classification to quantify climate variation and change: An example for 1901–2010 (pdf)

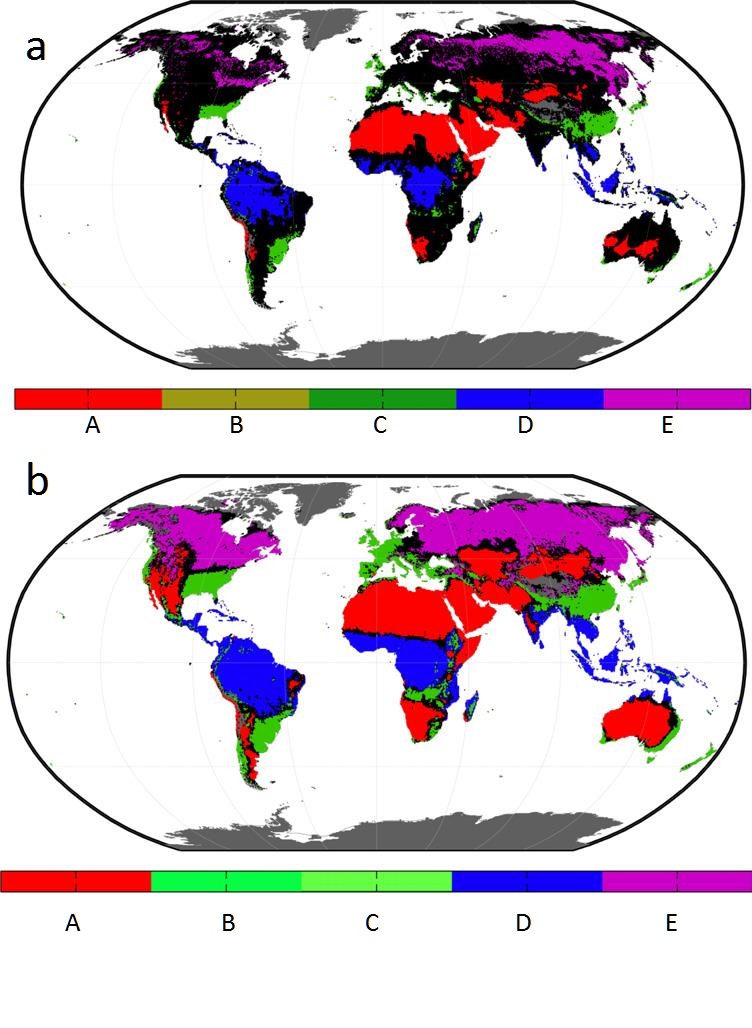
The Köppen climate classification consists of five major groups and a number of sub-types under each major group, as listed in Table 1. While all the major groups except B are determined by temperature only, all the sub-types except the two sub-types under E are decided based on the combined criteria relating to seasonal temperature and precipitation. Therefore, the classification scheme as a whole represents different climate regimes of various temperature and precipitation combinations.

Main characteristics of the Köppen climate major groups and sub-types:

Major group  Sub-types
A: Tropical Tropical rain forest: Af
Tropical monsoon: Am
Tropical wet and dry savanna: Aw, As
B: Dry Desert (arid): BWh, BWk
Steppe (semi-arid): BSh, BSk
C: Mild temperate Mediterranean: Csa, Csb, Csc
Humid subtropical: Cfa, Cwa
Oceanic: Cfb, Cfc, Cwb, Cwc
D: Snow Humid: Dfa, Dwa, Dfb, Dwb, Dsa, Dsb
Subarctic: Dfc, Dwc, Dfd, Dwd, Dsc, Dsd
E: Polar Tundra: ET
Ice cap: EF

Temporal Changes in Climate Zones

This study used a global gridded dataset with monthly mean temperature and precipitation, covering 1901–2010, which was produced and documented by Kenji Matsuura and Cort J. Willmott from Department of Geography, University of Delaware. Station data were compiled from different sources, including Global Historical Climatology Network version 2 (GHCN2) and the Global Surface Summary of Day (GSOD).The data and associated documentations can be found at http://climate.geog.udel.edu/climate/html_pages/Global2011/

In the maps below, the Köppen classification was applied on temperature and precipitation averaged over shorter time scales, from interannual to decadal and 30 year. The 30 year averages were calculated with an overlap of 20 years between each sub-period, while the interannual and decadal averages did not have overlapping years. Black regions indicate areas where the major Köppen type has changed at least once during 1901–2010 for a given time scale. Thus, the black regions are likely to be sensitive to climate variations, while the colored regions identify spatially stable regions.

Chen_and_Chen_2013fig2ab

Chen_and_Chen_2013fig2c


Major group Time scales
Interannual (%) Interdecadal (%) 30-year (%)
A                45.5                    89.0                 94.2
B                45.1                    85.2                 91.8
C                35.3                    77.4                 87.3
D                30.0                    83.3                 91.0
E                78.2                    92.8                 96.2

The table and images show that most places have had at least one entire year with temperatures and/or precipitation atypical for that climate.  It is much more unusual for abnormal weather to persist for ten years running.  At 30-years and more the zones are quite stable, such that is there is little movement at the boundaries with neighboring zones.

Over time, there is variety in zonal changes, albeit within a small range of overall variation:

Chen and Chen Conclusions

By using a global gridded temperature and precipitation data over the period of 1901–2010, we reached the following conclusions:

  • Over the whole period (1901–2010), the mean climate distributions have a comparable pattern and portion with previous estimates. The five major groups A, B, C, D, E take up 19.4%, 28.4%, 14.6%, 22.1%, and 15.5% of the total land area on Earth respectively. Since the relative changes of the areas covered by the five major groups are all small on the 30 year time scale, the agreement indicates that the climate dataset used overall is of comparable quality with those used in other studies.
  • On the interannual, interdecadal, and 30 year time scales, the climate type for a given grid may shift from one type to another and the spatial stability decreases towards shorter time scales. While the spatially stable climate regions identified are useful for conservation and other purposes, the instable regions mark the transition zones which deserve special attention since they may have implications for ecosystems and dynamics of the climate system.
  • On the 30 year time scale, the dominating changes in the climate types over the whole period are that the arid regions occupied by group B (mainly type BWh) have expanded and the regions dominated by arctic climate (EF) have shrunk along with the global warming and regional precipitation changes.

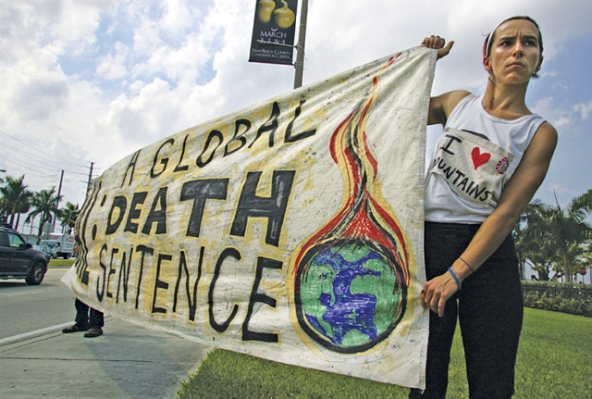
Summary: The Myth of “Global” Climate Change

Climate is a term to describe a local or regional pattern of weather. There is a widely accepted system of classifying climates, based largely on distinctive seasonal variations in temperature and precipitation. Depending on how precisely you apply the criteria, there can be from 6 to 13 distinct zones just in South Africa, or 8 to 11 zones only in Hawaii.

Each climate over time experiences shifts toward warming or cooling, and wetter or drier periods. One example: Fully a third of US stations showed cooling since 1950 while the others warmed.  It is nonsense to average all of that and call it “Global Warming” because the net is slightly positive.  Only in the fevered imaginations of CO2 activists do all of these diverse places move together in a single march toward global warming.

Dr. Arnd Bernaerts Disappeared

As happened in Soviet Russia, Climate revisionists are rewriting history. Judith Curry was one of 20 leading climate scientists according to the “Climate Council” based in Australia. But in March 2016, the list was reduced to 19, and Dr Curry disappeared (here).

Now the biography of Arnd Bernaerts has disappeared from Wikipedia, despite his obvious contributions to ocean science and law. UN Undersecretary-General Satya N. Nandan: “Mr Bernaerts has given to the international community an invaluable guide to the understanding and implementation of the 1982 United Nations Convention on the Law of the Sea.” (1988).

Most likely the revisionists are unhappy with Bernaerts’ coining of phrases such as these:

Climate is the continuation of oceans by other means.

Oceans govern climate.

And his writings are extensive and contemporary, as noted on this blog under the category Oceans Make Climate, inspired by my discovery of his work:
https://rclutz.wordpress.com/2015/04/07/oceans-matter-reflecting-on-writings-by-dr-arnd-bernaerts/

You can do something against the efforts of alarmists such as William Connolley by responding to Dr. Bernaerts here.

The Deleted Biography is here.

The Climate Fuss

Definition Fussbudget:  A person who fusses over trifles. Also called fusspot.

In the last week, Richard Lindzen has a new youtube video which explains briefly and clearly who is making a fuss about climate and why. (Hint: It is not primarily from climate physicists). The video deserves to go viral, since the presentation is brief, informative and accessible to anyone.

Why are so many people worried, indeed panic-stricken about this issue?
It’s due not so much to climate physicists, as to politicians, environmentalists and media. Global warming alarmism provides the things they most want:

  • For politicians, it’s money and power;
  • For environmentalists, it’s money for their organizations and confirmation of their near-religious devotion to the idea that man is a destructive force acting upon nature;
  • For the media, it’s ideology, money and headlines.
  • And crony capitalists have eagerly grabbed for the subsidies that governments have so lavishly provided.

Beyond the Lindzen video, we can also include lawyers who want to make money off the climate fuss. The legal attack on Big Oil (ExxonMobil, and others to follow) is modeled after the Big Tobacco campaign, and is intended to apply a defacto tax on consumers of fossil fuels. That’s what happened with the settlements by Tobacco companies, with an immediate jump in cigarette prices.

Not only is this an end run around the legislative branch, a lot of the money will be paid to lawyers working on contingency for the state AGs who are prosecuting this. To activists, lining the pockets of class-action lawyers is not a problem, as long as fossil fuels cost more, and thus will be used less. The tactic and the players are exposed here:
The Climate Change Inquisition, Part II—The Scandal Unfolds
Margaret A. Little April 20, 2016

Summary: How can we let the hot air out of the Global Warming balloon when they have so much to gain by inflating it?


Carbon Sense and Nonsense


This diagram of the fast carbon cycle shows the movement of carbon between land, atmosphere, and oceans in billions of tons per year. Yellow numbers are natural fluxes, red are human contributions, white indicate stored carbon.

Instead of delusions about CO2 as the planet’s climate “control knob”, Viv Forbes provides us a wise, sane view how the carbon cycle works, and what we know and don’t know about it. And rather than exaggerate the effects of humans recycling fossil fuels, he puts the carbon cycling sources and sinks into a sensible perspective. His recent article is entitled: Carbon Delusions and Limited Models

The IPCC models misread the positive and negative temperature feedbacks from water vapour (the main greenhouse gas) and their accounting for natural processes in the carbon cycle is based on very incomplete knowledge and numerous unproven assumptions.

The dreaded “greenhouse gases” (carbon dioxide and methane) are natural gases. Man did not create them — they occur naturally in comets and planets, and have been far more plentiful in previous atmospheres on Earth. They are abundant in the oceans and the atmosphere, and are buried in deposits of gas, oil, coal, shale, methane clathrates and vast beds of limestone. Land and sea plants absorb CO2 and micro-organisms absorb methane in the deep ocean.

Earth emits natural carbon-bearing gases in huge and largely unknown and unpredictable quantities. Carbon dioxide, carbon monoxide and various hydrocarbons such as ethane, methane and propane bubble out of the ocean floor, seep out of swamps, bubble naturally out of rivers, are released in oil seeps, water wells and bores, and are sometimes delivered via water pipes into drinking water. They are also released whenever carbon-bearing rocks such as coal and shale are eroded naturally, catch fire or are disturbed by earthquakes, construction activities or mining. The vast offshore deposits of frozen methane are released naturally when geothermal heat or volcanic intrusions melt the ice containing the methane.

Earth also entombs carbon in sediments and organic matter transported from the land by rivers and buried in swamps and deltas or swept from the land into the oceans by typhoons and tsunamis. These will eventually become limestone, shale and coal deposits, probably containing fossil evidence of a long-gone human era.

Earth’s total supply of carbon does not change, it just moves continually around the great carbon cycle residing temporarily as gases, liquids or solids in the atmosphere, oceans, biosphere and lithosphere.

Currently the supplies of carbon dioxide in the atmosphere are recovering gently from record lows. No one knows exactly where it is all coming from but limited measurements and extrapolations indicate that about 96% of the CO2 added annually to the atmosphere is from nature. The only part of the carbon cycle that is measured with reasonable accuracy is the remaining 4% of atmospheric CO2 produced through man’s recycling of coal, oil and gas.

Summary:

Note in the diagram above (from Wikipedia), that despite the huge natural fluxes of CO2 (amounts only guesstimated), a net annual increase of 4 Gt is blithely attributed to humans. Once again humans imagine that their activity is decisive and somehow more important than massive natural processes.

I think it is a kind “urban myth” adopted by people living in cities, with little experience of nature beyond green spaces within an artificial environment. Additionally, many spend their time in the virtual reality of cyberspace.

At some level nature has become the “other” to be feared.  Natural forces are presently restrained by bricks and mortar, but are always a risk to break through. Naively some think nature can be placated if we change our ways, another egoistic delusion.

Footnote from Chapter 6 IPCC WGI Fifth Assessment Report:

“The change of gross terrestrial fluxes (red arrows of Gross Photosynthesis and Total Respiration and Fires) has been estimated from CMIP5 model results (Section 6.4). The change in air-sea exchange fluxes (red arrows of ocean atmosphere gas exchange) have been estimated from the difference in atmospheric partial pressure of CO 2 since 1750 (Sarmiento and Gruber, 2006). Individual gross fluxes and their changes since the beginning of the Industrial Era have typical uncertainties of more than 20%.”
From Table 6.1 Chapter 6 IPCC WGI Fifth Assessment Report

Ocean-to-atmosphere flux  –155 ± 30
Land-to-atmosphere flux      30 ± 45
Partitioned as follows:
Net land use change     180 ± 80
Residual terrestrial flux   –150 ± 90


Climate Science Was Broken

Natural scientists have sought to understand the workings of the climate system and its various parts. But in recent decades the process of discovery has been subverted, and the science is going in circles. Richard Lindzen tells how it came to this in his essay: Climate Science: Is it Currently Designed to Answer Questions?

As you might guess, the title is a rhetorical question. From his long and deep experience with the field, Richard Lindzen can and does describe in detail how and why climatology is failing as a natural science. The machinations and convolutions bring to mind the quotation:
Laws are like sausages, it is better not to see them being made.
– Otto von Bismarck

Perhaps because the field was contaminated with political aims early on, the whole enterprise has come to resemble a legislative process:


Lindzen sets the record straight with names and maneuvers which have crippled efforts to answer questions about the functioning of earth’s climate system.

When an issue becomes a vital part of a political agenda, as is the case with climate, then the politically desired position becomes a goal rather than a consequence of scientific research. This paper will deal with the origin of the cultural changes and with specific examples of the operation and interaction of these factors. In particular, we will show how political bodies act to control scientific institutions, how scientists adjust both data and even theory to accommodate politically correct positions, and how opposition to these positions is disposed of.

By taking a few minutes to read his text (here), you can learn from Lindzen some important truths:

  • How science was perverted from a successful mode of enquiry into a source of authority;
  • What are the consequences when fear is perceived to be the basis for scientific support rather than from gratitude and the trust associated with it;
  • How incentives are skewed in favor of perpetuating problems rather than solving them;
  • Why simulation and large programs replaced theory and observation as the basis of scientific investigation;
  • How specific institutions and scientific societies were infiltrated and overtaken by political activists;
  • Specific examples where data and analyses have been manipulated to achieve desired conclusions;
  • Specific cases of concealing such truths as may call into question gobal warming alarmism;
  • Examples of the remarkable process of “discreditation” by which attack papers are quickly solicited and published against an undesirable finding;
  • Cases of Global Warming Revisionism, by which skeptical positions of prominent people are altered after they are dead;
  • Dangers to societies and populations from governments, NGOs and corporations exploiting climate change.

Summary:

Thanks to Richard Lindzen and others for putting on the record how broken is the field of climate science. It is dangerous in itself, and it also extends into other domains, threatening the scientific basis of modern civilization. Fixing such scientific perversions will be difficult and lengthy, but it can only start with acknowledging how bad it is. It truly is worse than we thought.

No matter that these contortions extend back for some years; there is no statute of limitations on crimes against science. And the bad behavior is unabated: witness the fresh Revisionism of attacks in 2016 against Exxon and other oil companies for not proclaiming warming alarms in the 1970’s.

Was there ever a field of knowledge so abused, corrupted and corrosive? Who will drain the swamp of Climate Science and contend with the alligators there?

Climate Change is a Social Science

The post What is Climate? Is it changing? explained how “Climate Change” is a double abstraction: it refers to the derivative (change) in our expectations (patterns) of weather. Thus studies of “Climate Change” are a branch of social science, not physical science.

For example, here is a typical study, without the pretense or claim to be doing physical science.

Extreme weather perceptions in your neighbourhood and beyond, Published in Environmental Sociology, by Dr Matthew J. Cutler of the University of New Hampshire, USA. (here)

The author of the study, Dr Cutler, found that although higher household earnings were negatively associated with perceptions of extreme weather, homeownership was indeed a contributing factor – stating that “homeownership and lower incomes appear to independently increase perceptions.” Age, gender, education and political persuasion were also significantly related to extreme weather perceptions. Odds were higher among younger, female, more educated, and Democratic respondents to perceive effects from extreme weather than older, male, less educated, and Republican respondents.

Summary:

Climate Science is properly identified as a branch of Environmental Sociology. Its focus on “Climate Change” aims to understand how and why people perceive weather patterns to be changing or dangerous.

For the sake of human health and prosperity, all studies pertaining to Climate Change should be appreciated as social science investigations, having nothing to do with natural science or physics. Needless to say, any public policy proposals regarding Climate Change can not be evaluated as having any beneficial effect upon the physical world. They are solely motivated by social perceptions and concerns, and should be assessed on the costs and impacts required to reduce levels of concern.

Climate Science Culture War

Climate Science Culture War


N2 is IR-Active: This Changes Everything!

E.M. Smith (Chiefio) has new post (here) presenting the evidence showing how Nitrogen, the dominant gas in the atmosphere, also radiates in the infrared, and thus participates in the “greenhouse” effect.  This information was measured and reported as long ago as 1944, but the implications have been ignored in the recent obsession with CO2.

This Changes Everything.

Footnote:  The original discovery of this effect from Nitrogen (here) attributes the IR to N atoms present in the upper atmosphere.


Facets of Ice and Climate

gallopingcamel commented recently on Flap over Arctic Ice Rebound

“Short term variations to Arctic ice were not a big deal for me, but you piqued my interest so your blog has been added to my favorites.

To date, my interest has been the long term record based on ice cores:
https://diggingintheclay.wordpress.com/2013/05/04/the-dog-that-did-not-bark/

Do you have any comments to share?”

His linked post is a tightly reasoned analysis regarding CO2, temperatures and ice cores. I appreciate greatly his summary showing that present warming is much too low if CO2 has been causing warming all along. I’d not seen the contradiction put so succinctly.

His comment causes me to reflect on several facets of ice in relation to climate, and this is the point of this post.

The immediate facet: What do Sea Ice Extents tell us about climate change?

As Peter says, my blogging on Arctic Ice extents is quite immediate and is motivated mainly by my concern to get some factual perspectives out there as a possible antidote to feverish claims the media will promote. In that sense, this facet of ice is an immediate and socio-political one. The issue: should Arctic ice extent cause us to be alarmed about the climate? My blogs on Arctic Ice Rebound provide my conclusions, but this battle for public opinion has not yet been joined in earnest. In my post on sea ice factors I make the point that among many things affecting ice extents, CO2 is the least likely. And Antarctic ice extent is another story which I have left to others.

The Longer View: The Ice Core Story of CO2 and Surface Temperatures

I am convinced as Peter is that in the ice core record, changes in CO2 follow temperature changes and are more effect than cause. The natural CO2 sources and sinks are estimated with large error bands and their behavior is likely to be dynamic, that is, changing with changing climate conditions.

This blog is like a personal journal where I try to articulate realizations that form from my engagement in climate topics. It is idiosyncratic in that I often have a new discovery, quite exciting to me, but long understood by others unknown to me. For example, John Holtquist just linked to a webpage by John Daly where he said years ago most of everything I’ve learned about Arctic ice and more.

My journey this year was marked by discovering we live on planet water, not planet earth, and it led me to read much more oceanographic material which is categorized here as Oceans Make Climate. That led me to ice, and to some theories regarding longer-term Arctic cycles summarized here.

The Big Picture: The Sun and the Earth, From Hot House to Ice House

Peter’s post has a comment thread that gets into the larger arena of climate shifts involving ice-covered ages (most of earth’s history) and the more hospitable inter-glacial periods such as we have enjoyed for the last 11,500 years. I wrote a post on how I believe the ocean’s thermal flywheel is responsible for keeping our climate so stable most of the time, until it is overwhelmed by external forces, primarily astronomical in nature.

I have not wandered far into the sun-climate controversy, and my present understanding is probably best expressed here:
https://rclutz.wordpress.com/2015/09/16/the-climates-they-are-a-changing/