Consider. The world’s largest emitter of carbon dioxide is China, which burns half of the world’s coal and is building new coal-fired plants even as the 30,000 summiteers gather in Glasgow… Neither Chinese President Xi Jinping nor Russian President Vladimir Putin will even be present in Glasgow.
“Colossal Stakes as Leaders Meet to Talk Climate,” ran the headline. They topped the lead news story in Sunday’s New York Times, the opening line of which set the tone for Glasgow: “The future is on the line.”
“As presidents and prime ministers arrive in Glasgow this week for a pivotal climate summit, the outcome will determine, to a large extent, how the world’s seven billion people will survive on a hotter planet and whether far worse levels of warming can be averted …
“Already, the failure to slow rising temperatures — brought on by the burning of oil, gas and coal — has led to deadly floods, fires, heat, and drought around the world.”
The hype is on. And the establishment media are playing their assigned role — portraying a failure at Glasgow as a guarantee of the looming apocalypse.
The theology of the climate crisis runs like this.
The planet has warmed by 1.1 degree Celsius since the Industrial Revolution. If warming rises to more than 1.5 degrees Celsius above 1900 levels, more and more terrible weather disasters will occur: wildfires, hurricanes of growing severity, droughts, coastal and river flooding, and islands sinking into the sea.
The only way to stave off “climate catastrophe” is for all nations to cut carbon emissions radically now and for the world to reach net zero emissions by midcentury.
A fast phaseout of the major emitters of carbon dioxide — the burning of coal, oil and gas to heat homes, run cars and generate power — and replacement of these fossil fuels with clean energy — solar, wind, nuclear — is a moral and political imperative.
But if such a radical transformation of national economies is the only way to avert the impending crisis, we should brace ourselves and prepare for that crisis. For there is no way the demanded changes in energy consumption are going to be made by 2030.
Consider the Facts on the Ground
The world’s largest emitter of carbon dioxide is China, which burns half of the world’s coal and is building new coal-fired plants even as the 30,000 summiteers gather in Glasgow.
China was given a license in the Paris climate accord of 2015 to burn all the coal it wishes until 2030, after which it has agreed to begin reducing carbon emissions. But the idea that China can or will convert in a few decades to wind, solar and nuclear power to run the world’s largest manufacturing plant seems preposterous.
The U.S., the world’s second largest emitter of carbon dioxide, gets 81% of its energy from oil, coal and natural gas. We depend on those fuels to heat our homes, run our vehicles and power our industry.
In his Build Back Better bill, Biden inserted a provision that would have imposed annually rising taxes on carbon producers and used the revenue to reward companies that reduced their reliance on fossil fuels. The proposal had to be pulled out, lest it drag Biden’s entire bill down to defeat. Lest we forget, Sen. Joe Manchin is from West Virginia.
India, the world’s third largest emitter of greenhouse gases, is also, like China, dependent on coal. But, though its population is as large as China’s, India is behind China industrially, and the standard of living of its 1.4 billion people is below that of China.
To demand that India begin to end its burning of coal and rely more on solar and wind is to demand that New Delhi accept a future where India’s standard of living remains lower than that of China.
As for Russia, the fourth largest emitter of carbon dioxide, it is rich in fossil fuels and the leading supplier of natural gas to Europe. But Moscow manipulates the supplies of its natural gas to its customers for reasons of both revenue and politics.
Neither Chinese President Xi Jinping nor Russian President Vladimir Putin will even be present in Glasgow.
Saudi Arabia, the Gulf states and other OPEC nationsdepend for their national income on oil exports. If fossil fuels become forbidden fuels, what is to become of these nations?
Will they accept a future where their primary natural resource is gradually outlawed by the rest of the world? Will they be content to rely on the industrialized world to provide them with windmills and solar panels to power their economies?
The world’s losers from this Glasgow summit are likely to be the billions of people who will never know the benefits of fossil fuels that produced the Industrial Revolution and created the affluent societies of the 20th century.
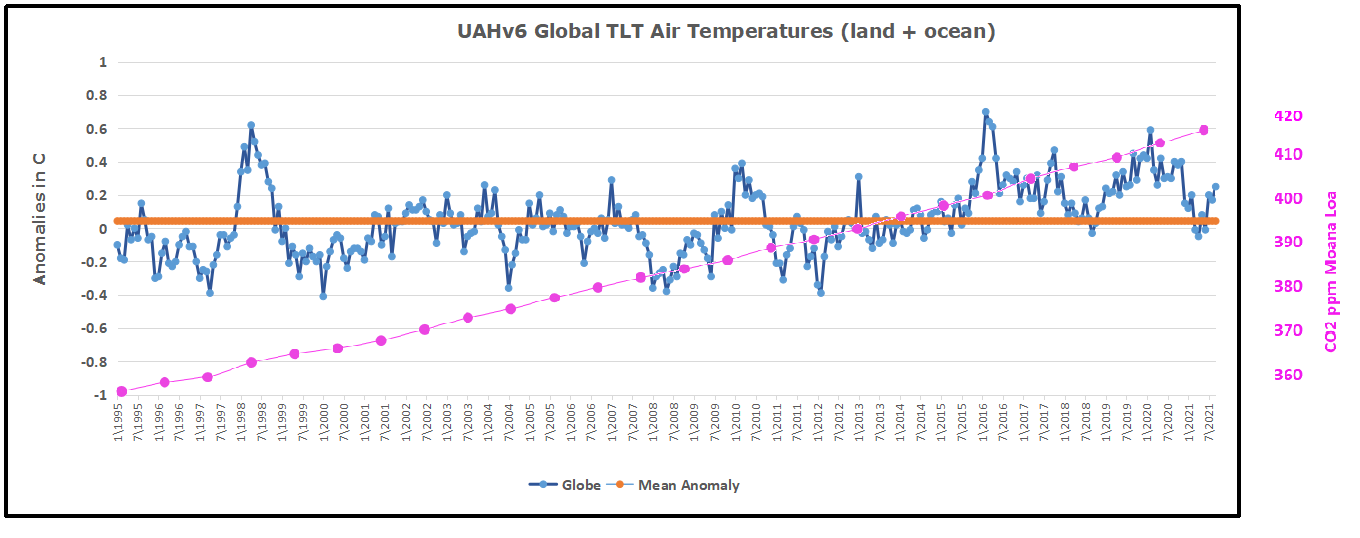
The post below updates the UAH (U. of Alabama in Huntsville) record of air temperatures over land and ocean. But as an overview consider how rapid cooling recently completely overcame the warming from the last 3 El Ninos (1998, 2010 and 2016). The UAH record shows that the effects of the last one were gone as of March 2021. (UAH baseline is now 1991-2020). For reference I added an overlay of CO2 annual concentrations as measured at Mauna Loa. While temperatures fluctuated up and down ending flat, CO2 went up steadily by ~55 ppm by 2020, a 15% increase.
Furthermore, going back to previous warmings prior to the satellite record shows that the entire rise of 0.8C since 1947 is due to oceanic, not human activity.
The animation is an update of a previous analysis from Dr. Murry Salby. These graphs use Hadcrut4 and include the 2016 El Nino warming event. The exhibit shows since 1947 GMT warmed by 0.8 C, from 13.9 to 14.7, as estimated by Hadcrut4. This resulted from three natural warming events involving ocean cycles. The most recent rise 2013-16 lifted temperatures by 0.2C. Previously the 1997-98 El Nino produced a plateau increase of 0.4C. Before that, a rise from 1977-81 added 0.2C to start the warming since 1947.
Importantly, the theory of human-caused global warming asserts that increasing CO2 in the atmosphere changes the baseline and causes systemic warming in our climate. On the contrary, all of the warming since 1947 was episodic, coming from three brief events associated with oceanic cycles.
October Update Mild Ocean and Land Air Temps
With apologies to Paul Revere, this post is on the lookout for cooler weather with an eye on both the Land and the Sea. While you will hear a lot about 2020 temperatures matching 2016 as the highest ever, that spin ignores how fast has the cooling set in. The UAH data analyzed below shows that warming from the last El Nino was fully dissipated with chilly temperatures setting in all regions. The peak NH summer month of July saw some warming most pronounced in the SH, then reversed by cooling in August and September. Now in October there is an upward tick with milder temperatures.
UAH has updated their tlt (temperatures in lower troposphere) dataset for October. Previously I have done posts on their reading of ocean air temps as a prelude to updated records from HADSST3. This month also has a separate graph of land air temps because the comparisons and contrasts are interesting as we contemplate possible cooling in coming months and years.
Note: UAH has shifted their baseline from 1981-2010 to 1991-2020 beginning with January 2021. In the charts below, the trends and fluctuations remain the same but the anomaly values change with the baseline reference shift. Data for lower troposphere is here .
Presently sea surface temperatures (SST) are the best available indicator of heat content gained or lost from earth’s climate system. Enthalpy is the thermodynamic term for total heat content in a system, and humidity differences in air parcels affect enthalpy. Measuring water temperature directly avoids distorted impressions from air measurements. In addition, ocean covers 71% of the planet surface and thus dominates surface temperature estimates. Eventually we will likely have reliable means of recording water temperatures at depth.
Recently, Dr. Ole Humlum reported from his research that air temperatures lag 2-3 months behind changes in SST. Thus the cooling oceans now portend cooling land air temperatures to follow. He also observed that changes in CO2 atmospheric concentrations lag behind SST by 11-12 months. This latter point is addressed in a previous post Who to Blame for Rising CO2?
After a technical enhancement to HadSST3 delayed updates Spring 2020, May resumed a pattern of HadSST updates toward the following month end. For comparison we can look at lower troposphere temperatures (TLT) from UAHv6 which are now posted for October. The temperature record is derived from microwave sounding units (MSU) on board satellites like the one pictured above. Recently there was a change in UAH processing of satellite drift corrections, including dropping one platform which can no longer be corrected. The graphs below are taken from the new and current dataset.
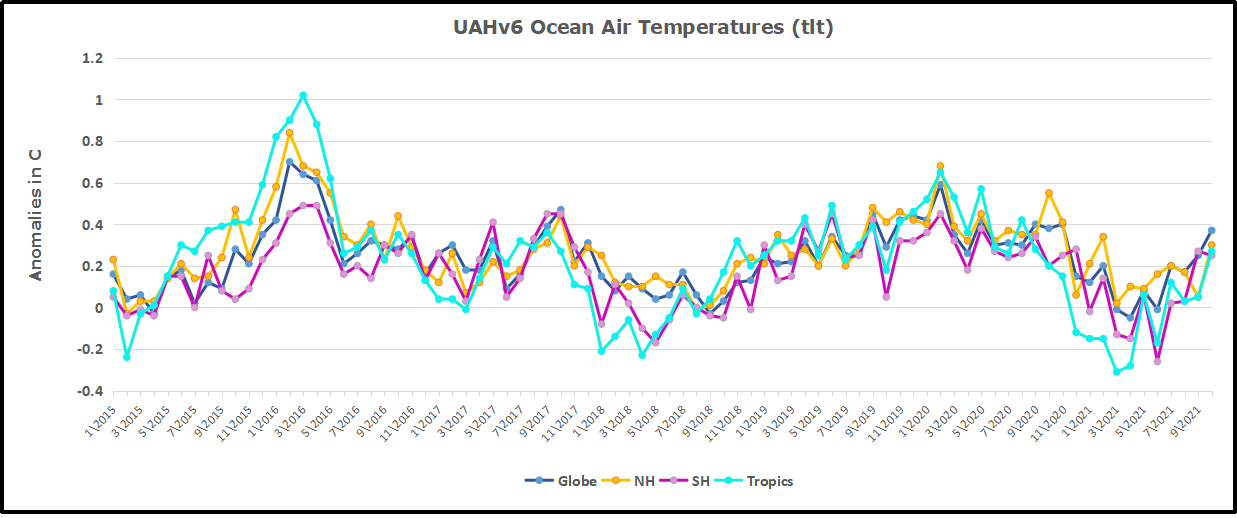
The UAH dataset includes temperature results for air above the oceans, and thus should be most comparable to the SSTs. There is the additional feature that ocean air temps avoid Urban Heat Islands (UHI). The graph below shows monthly anomalies for ocean temps since January 2015.
In Jan-March 2021 SH dropped sharply, pulling the Global anomaly down with SH matching the coldest in this period. March drops in the Tropics and NH made those regions at their coldest since 01/2015. In June 2021 despite an uptick in NH, the Global anomaly dropped back down due to a record low in SH along with a Tropical cooling. The summer warm pulse in NH was mild this year, with NH peaking in July, pulling up Global anomaly slightly with an assist from the Tropics. Now in October the Global anomaly is up due to both the Tropics and NH, though the latter is 0.3C lower than October a year ago.
Land Air Temperatures Tracking Downward in Seesaw Pattern
We sometimes overlook that in climate temperature records, while the oceans are measured directly with SSTs, land temps are measured only indirectly. The land temperature records at surface stations sample air temps at 2 meters above ground. UAH gives tlt anomalies for air over land separately from ocean air temps. The graph updated for October is below.
Here we have fresh evidence of the greater volatility of the Land temperatures, along with extraordinary departures by SH land. Land temps are dominated by NH with a 2021 spike in February, followed by cooling down to April. Then NH land warmed with a second NH spike peaking in July. Note how cold have been SH land temperatures in 2021, with two lows in Jan. and again in July. Then SH and the Tropics spiked upward, raising the Global land anomaly. And now NH has ticked upward matching its peak last October.
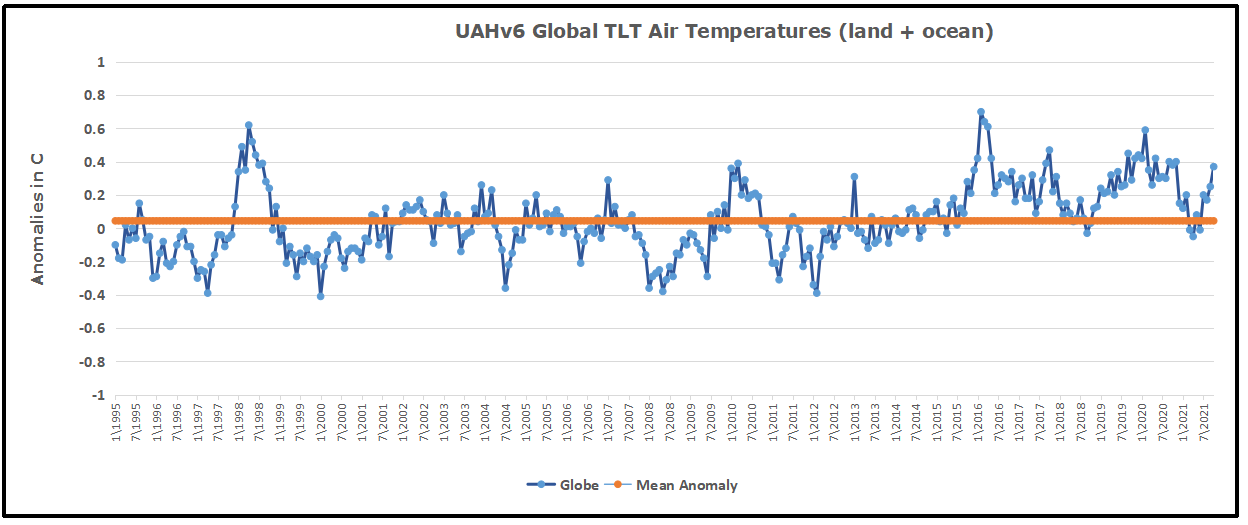
The Bigger Picture UAH Global Since 1995
The chart shows monthly anomalies starting 01/1995 to present. The average anomaly is 0.04, since this period is the same as the new baseline, lacking only the first 4 years. 1995 was chosen as an ENSO neutral year. The graph shows the 1998 El Nino after which the mean resumed, and again after the smaller 2010 event. The 2016 El Nino matched 1998 peak and in addition NH after effects lasted longer, followed by the NH warming 2019-20, with temps having returned again to the mean March-June, with an uptick in July-October.
TLTs include mixing above the oceans and probably some influence from nearby more volatile land temps. Clearly NH and Global land temps have been dropping in a seesaw pattern, more than 1C lower than the 2016 peak. Since the ocean has 1000 times the heat capacity as the atmosphere, that cooling is a significant driving force. TLT measures started the recent cooling later than SSTs from HadSST3, but are now showing the same pattern. It seems obvious that despite the three El Ninos, their warming has not persisted, and without them it would probably have cooled since 1995. Of course, the future has not yet been written.
The animation shows Arctic ice extents on day 304 (end of October) for the years 2012 through yesterday 2021. Note the variability from year to year on the CanAm (left side) with the Beaufort Sea at the top, Canadian Archipelago center left, and Baffin Bay, lower left between Greenland and Newfoundland. More noticeable are the Russian shelf seas fluctuations on the right side. Some years, like 2020, there is still open water, but this year those seas are frozen over, including from the top Chukchi, East Siberian, Laptev, and Kara Seas down to bottom right.
The graph below shows October daily ice extents for 2021 compared to 14 year averages, and some years of note.
The black line shows during October on average Arctic ice extents increase ~3.4M km2 from ~4.9M km2 up to ~8.3M km2. The 2021 cyan MASIE line started the month ~500k km2 above average and on day 304 retained a surplus of ~160k km2. The Sea Ice Index in orange (SII from NOAA) started with the same deficit, then lagged behind in the last two weeks, before ending ~100k km2 lower than MASIE. 2019 and 2020 were well below average at this stage of the ice recovery.
Why is this important? All the claims of global climate emergency depend on dangerously higher temperatures, lower sea ice, and rising sea levels. The lack of additional warming is documented in a post Adios, Global Warming
The table below shows the distribution of Sea Ice on day 304 across the Arctic Regions, on average, this year and 2020.
Region
2021304
Day 304 Average
2021-Ave.
2020304
2021-2020
(0) Northern_Hemisphere
8528046
8369146
158900
6954249
1573797
(1) Beaufort_Sea
982244
946489
35755
1044967
-62723
(2) Chukchi_Sea
659384
436299
223085
369981
289403
(3) East_Siberian_Sea
1086959
909416
177543
373761
713197
(4) Laptev_Sea
894716
831110
63606
283776
610940
(5) Kara_Sea
626536
444754
181781
269583
356952
(6) Barents_Sea
55711
77133
-21422
14206
41505
(7) Greenland_Sea
360759
415579
-54820
463525
-102766
(8) Baffin_Bay_Gulf_of_St._Lawrence
107176
269121
-161945
232788
-125611
(9) Canadian_Archipelago
557042
788762
-231720
802238
-245196
(10) Hudson_Bay
5061
82352
-77292
73773
-68712
(11) Central_Arctic
3160959
3158164
2794
3023876
137083
The overall surplus to average is 159k km2, (2%). Note large surpluses of ice in BCE (Beaufort, Chukchi and East Siberian seas). as well as in Laptev and Kara on the Russian coast. The main deficits to average are in Baffin Bay and CAA, more than offset by surpluses elsewhere. Note that 2021 ice extent exceeds that of 2020 by 1.6M km2, most of the difference being in East Siberian, Laptev and Kara Seas.
Illustration by Eleanor Lutz shows Earth’s seasonal climate changes. If played in full screen, the four corners present views from top, bottom and sides. It is a visual representation of scientific datasets measuring Arctic ice extents.
Nowadays human imagination is serving slavery and division, rather than the freedom and peace John Lennon envisioned. At the very moment when we should be celebrating so much progress over human suffering, instead elites and celebrities are mobilizing to destroy individual rights and freedoms. Michael Hart in his book preface describes the flight of imagination bringing the world to this moment of climate fear and division. Excerpts in italics with my bolds.
Imagine a movement so bent on achieving its political objectives that it is willing to corrupt science to meet them. Imagine governments around the globe, first adopting and then promoting this official science for more than two generations. Imagine that they are willing to use their regulatory power to implement a massive program of social engineering in order to “save” the planet. Imagine the United Nations leading this movement and insisting that a global effort is required.
Imagine the movement’s leaders believing that people around the globe must change their eating, heating, cooling, lighting, toilet, transportation, manufacturing, entertainment, even housing habits and reject values that are critical to their prosperity, happiness, and welfare, confident that humans can adapt and revert to simpler, more primitive, more local life-styles, have fewer children, and embrace lives presumed to be more in harmony with nature.
Imagine thousands of scientists engaged at public expense in developing a convincing rationale for this unprecedented project. Imagine that these scientists are willing to compromise their integrity in pursuit of the role of a single factor that they insist controls the most complex and chaotic earth system, a molecule–carbon dioxide–that is literally the building block of all of life. Imagine that they believe that by reducing its miniscule–.04 percent–presence in the atmosphere, the planet will cool and climate will stabilize at an optimum level, a level seen only in microseconds of geological time.
Imagine scientists who dismiss the work of hundreds of their colleagues and believe that their work must be suppressed. Imagine a scientific movement dominated by greedy grant farmers and cheered on by the media, insisting that there is no further need to study the science and that governments need to start implementing its preferred policy of worldwide social engineering.
Imagine that many leaders of this movement believe that the world’s population needs to be thinned down to a billion people within a generation or two. Imagine that some of the movement’s most revered leaders, even as they advocate that ordinary people must curb their consumption and live simpler lives, pursue lifestyles that consume more energy and other commodities in a year than an ordinary family of four would need over its lifetime.
Imagine a movement whose leaders habitually dissemble and mislead and justify this on the claimed greater good they are pursuing. Imagine politicians, civil servants, scientists,activists, and the media flying from one exotic location to another as they plan what must be done to coerce changes in our lifestyles, even to the point of sacrificing human freedom and democracy.
Most thoughtful people would conclude that only Hollywood could come up with such a bizarre plot. A little more thinking, however, and they might connect the dots. There is such a movement, and it has demanded our attention for more than thirty years. It has devoured hundreds of billions of dollars in public money and has inserted its menacing tentacles into every aspect of modern life. The UN and all its organs are the leading force behind it, but most governments of the world support it in one way or another. Elites, the media, and even religious leaders, have embraced it, even though they seem poorly informed and ignore its demands while urging others to adopt sharply reduced lifestyles.
The public face of this science, climate science, is part of a worrying new trend: the emergence of “official” or consensus science. In this perversion of real science, policy becomes the goal of scientific enquiry rather than its result. Over the last thirty years and more, public policy has focused increasingly on dealing with risks to health, safety, and the environment. Much of that policy ostensibly relies on scientific findings. In their decision making, governments increasingly look to scientists and have resorted to funding science that meets their political need for certainty.
Consensus on controversial issues is critical to governments. Ever since Rachel Carson published Silent Spring in 1962, activists have stood ready to convince governments of all manner of risks to humanity and nature, and scientists have obliged by reporting findings that satisfy activist political needs. Once governments acquiesce, it is critical that scientists not undermine their decisions with awkward new findings. Public policy is not easily reversed. The result is a potential monster spewing out more and more regulations, presumably making us safer and healthier and safeguarding the environment, but also substituting social for personal responsibility, reducing freedom and choice, and creating an ever larger, more costly, and intrusive public footprint.
For many years it seemed that the public agreed that there was a need to take action to control the globe’s climate, but that support has steadily eroded as people have begun to realize the enormity of what is being demanded, the flimsy ground on which this demand is based, and the impact of what would need to be imposed. Public support has declined further as sceptical scientists have pointed out more and more problems with the underlying scientific hypothesis, as engineers have indicated the extent to which purported energy substitutes are not up to the job, and as economists have calculated the enormous costs and minimal benefits. Only general scientific illiteracy has kept the project afloat.
While the primary movement is withering on the vine, its effects linger for generations. Governments may never meet the primary objectives of the global warming movement, but they have succeeded in embedding many of its tentacles into public regulatory policies and programs. Multiple interests have become dependent on these policies and will fight to maintain them, including thousands of officials whose careers are wedded to them. As so often happens in public policy, the unintended and harmful consequences become accepted practice, despite their costs and annoyance.
The world will be a better place: ♦ when governments agree to tame this monster and refocus their energies on issues within their competence;
♦ when religious leaders and other elites accept that they have fallen prey to a movement whose motives are much darker and more damaging than they realize;
♦ and when the media adopt a more balanced approach and provide the public with the critical assessment that is often missing from their reporting.
It is time for all three to accept that the UN is pursuing a path that can only result in a less prosperous and more divided world.
Background from previous post: On the Hubris of Climatism
The wide-ranging interview contains many insights, including this one that IMO gets at a deep, underlying motive:
Alarm over a changing climate leading to malign results is in many ways the product of the hunger for stability and direction in a post-Christian world. Humans have a deep, innate need for a transcendent authority. Having rejected the precepts of Christianity, people in the advanced economies of the West are turning to other forms of authority. Putting aside those who cynically exploit the issue for their own gain – from scientists and politicians to UN leaders and green businesses – most activists are deeply committed to a secular, statist, anti-human, earth-centric set of beliefs which drives their claims of a planet in imminent danger from human activity.
To them, a planet with fewer people is the ultimate goal, achievable only through centralized direction and control. As philosopher of science Jeffrey Foss points out, “Environmental science conceives and expresses humankind’s relationship to nature in a manner that is – as a matter of observable fact – religious.” It “prophesies an environmental apocalypse. It tells us that the reason we confront apocalypse is our own environmental sinfulness. Our sin is one of impurity. We have fouled a pure, ‘pristine’ nature with our dirty household and industrial wastes. The apocalypse will take the form of an environmental backlash, a payback for our sins. … environmental scientists tell people what they must do to be blameless before nature.”
Hart says that unfortunately society has gone a long way down the wrong road, but the outcome can be changed.
I remain cautiously optimistic. Popular support for climate change action peaked a few years ago. In Europe, which has gone furthest in implementing climate change policies, politicians are beginning to look for ways to moderate earlier initiatives. In North America, rhetoric has far outstripped actions while the Obama administration has relied on stealth to implement its climate change agenda. At the same time, climate change has added to the momentum of the broader secularization of society and the pursuit of anti-human policies and programs. We are, sadly, farther down that road than we have ever been before.
Again, it will take a determined effort by people of faith and conscience to convince our political leaders that they have been gulled by a political movement exploiting fear of climate change to push a utopian, humanist agenda that most people would find abhorrent. As it now stands, politicians are throwing money that they do not have at a problem that does not exist in order to finance solutions that make no difference. The time has come to call a halt to this nonsense and focus on real issues that pose real dangers. In a world beset by war, terrorism, and continuing third-world poverty, there are far more important things on which political leaders need to focus.
The litigation over the EPA’s authority comes to the court in a quartet of environmental cases on appeal from the U.S. Court of Appeals for the District of Columbia Circuit. The D.C. Circuit vacated both the Trump administration’s decision to repeal the 2015 Clean Power Plan, which established guidelines for states to limit carbon dioxide emissions from power plants, and the Affordable Clean Energy Rule that the Trump administration issued in its place.
Urging the justices to hear the case, one of the challengers, the North American Coal Corporation, acknowledged that the issue of climate change and how to address it has “enormous importance,” but the company stressed that “[t]hose debates will not be resolved anytime soon.” What the court should resolve, it continued, “as soon as possible is who has the authority to decide those issues on an industry-wide scale — Congress or the EPA.” Unless the justices weigh in, the company warned, “these crucial decisions will be made by unelected agency officials without statutory authority, as opposed to our elected legislators.”
The Biden administration told the justices that there was no need for them to step in now, because the Clean Power Plan “is no longer in effect and EPA does not intend to resurrect it.” Instead, the government explained, it intends to issue a new rule that takes recent changes in the electricity sector into account. “Any further judicial clarification of the scope of EPA’s authority,” the government suggested, “would more appropriately occur” after the agency has actually issued the new rule.
After considering the cases at four consecutive conferences, the justices granted review and ordered the cases to be argued together. The justices’ decision in the case, which is expected by summer 2022, could have an impact well beyond environmental law because it could impose new limits on Congress’ ability to delegate authority to all regulatory agencies.
The lead case is West Virginia v. EPA. It is consolidated with North American Coal Corp. v. EPA, Westmoreland Mining Holdings v. EPA, and North Dakota v. EPA.
My comment: I much appreciate Judge Walker’s reprise of the historical journey. After earning my degree in organic chemistry, I am still offended that a bunch of lawyers refer to CO2 as a “pollutant” as though it were an artificial chemical rather than the stuff of life. And it annoys me that the American Lung Association fronted this legal attack, as though CO2 was causing breathing problems in addition to a bit of warming during our present ice age. And that list of ailments solved by reducing CO2 emissions rivals any snake oil poster ever printed.
Observers noted that this ruling produces a kind of limbo: Obama’s Clean Power Plan is out of order, and now Trumps Affordable Clean Energy program is shot down. Likely Biden will try to return to CPP as though Trump never happened, but the same objections will still be raised. Clearly Judge Walker sees the issue headed for the Supreme Court as the stakes are too high for anyone else. After their lack of courage on the 2020 election scandal, who knows what the Supremes will do.
The roots of this poisonous tree are found in citing the famous Massachusetts v. E.P.A. (2007) case decided by a 5-4 opinion of Supreme Court justices (consensus rate: 56%). But let’s see in what context lies that reference and whether it is a quotation from a source or an issue addressed by the court. The majority opinion was written by Justice Stevens, with dissenting opinions from Chief Justice Roberts and Justice Scalia. All these documents are available at sureme.justia.com Massachusetts v. EPA, 549 U.S. 497 (2007). The linked post summarized the twisted logic that was applied.
Evidence grows of election mismanagement, illegal acts and some fraud in several states.
Cognitively impaired nursing home residents in Wisconsin and Michigan cynically exploited for votes. Election mismanagement in Atlanta. Unlawful election instructions in Wisconsin. And 50,000 questionable ballots in Arizona, plus several criminal cases for illegal ballot harvesting and inmate voting.
Eleven months after Donald Trump was ousted from office, the narrative that the 2020 election was clean and secure has frayed like a well-worn shoelace. The challenges of the COVID pandemic, the aggressive new tactics of voting activists and the desire of Democrats to make the collection and delivery of ballots by third parties legal in states where harvesting is expressly forbidden has muddied the establishment portrait and awakened the nation to the painful reality its election system — particularly in big urban areas — is far from perfection.
Nowhere has that story become more clear than the battleground state of Wisconsin, where a local sheriff on Thursday dramatically held a nationally televised news conference alleging he had found evidence of felony crimes involving ballots sent to nursing home residents.
Racine County Sheriff Christopher Schmaling said his investigators have secured evidence that eight out of 42 residents at a local nursing home had been recorded as casting absentee ballots that their families said was not possible because the residents didn’t possess the cognitive ability to vote.
The probe was prompted by one family who discovered their loved one had voted in the November 2020 election despite having died a month earlier after a long period of mental decline, authorities said.
Schmaling dramatically accused the Wisconsin Elections Commission, the state’s election bureaucracy, of creating the conditions for such voting by mailing absentee ballots to nursing home residents who didn’t request them and empowering nursing home staff to fill out ballots on behalf of the residents.
The “election statute was in fact not just broken, but shattered,” he said.
The nursing home scheme alleged by Schmaling was also found in neighboring Michigan, where Democratic Attorney General Dana Nessel earlier this month announced three women were charged with voting fraud, including one who fraudulently filled out ballots in the names of nursing home residents without their permission.
But the nursing home case is far from the only concern that has rocked Wisconsin, where Joe Biden was certified the winner over Trump with a razor-thin margin of about 20,000 votes. The non-partisan Legislative Audit Bureau released a sweeping report last month that accused election officials of engaging in “inconsistent administration” of election laws, troublesome management of new drop boxes used to collect ballots during the pandemic, ineffective investigation of fraud complaints, and other problems.
While it did not offer evidence of systemic fraud, it flagged more than 30 problems as well as many more issues that lawmakers should resolve for future elections. The report prompted the GOP leader of the Wisconsin Senate to launch an investigation into the November election, augmenting a separate probe already authorized by the Wisconsin Assembly that is being led by former state Supreme Court Justice Michael Gableman.
And those developments follow a ruling by the Wisconsin Supreme Court that concluded state election officials wrongly allowed tens of thousands of Wisconsin voters to skip voter ID requirements and file absentee ballots by declaring their concerns about COVID made them “indefinitely confined.” While the court ruled the advice was illegal, it noted there was no penalty and said it was up to voters to decide if they had an infirmity or disability that made them confined. Lawmakers are now looking to change the weaknesses in that law.
Sen. Ron Johnson (R-Wisc.) the former chairman of the Senate Homeland Security Committee, which oversees elections, said the dizzying revelations coming from his own state were a clear sign that lawmakers have far more work ahead of them to improve election administration and ensure voters are treated more evenly.
“Following the LAB report, what Sheriff Schmaling has uncovered + disclosed might only be tip of the iceberg of fraud in the 2020 election,” Johnson tweeted. “The Legislature must be given the time, resources, and cooperation of election officials to conduct a complete investigation of allegations.”
Similarly, state officials in Georgia, where Trump lost by a slim margin, have found evidence that its major urban voting center of Fulton County had significant problems administering the November election, so much so that state officials have begun the process of taking the county’s election management into receivership, removing local control for the 2022 election and beyond.
That dramatic move came after Just the News unearthed a 29-page memo from a state observer that found officials in Futon County engaged in all sorts of misconduct and mistakes, including insecure transport of ballots, double scanning of ballots and possible invasions of voter privacy.
And earlier this month, two Fulton County workers were fired for allegedly shredding ballot applications in violation of state law. Secretary of State Brad Raffensperger even asked the U.S. Justice Department to assist in the investigation.
And in nearby DeKalb County, Raffensperger has initiated a separate probe into whether ballots cast in “drop boxes” were properly handled and logged.
Meanwhile, the fallout from the Arizona Senate’s audit continues to be felt, as more than 50,000 ballots have been called into question and several matters referred to Attorney General Mark Brnovich for possible prosecution. Even before those referrals, Brnovich’s office has brought several criminal prosecutions, including prison inmates who illegally voted as well as some people accused of harvesting ballots from third parties.
The harvesting cases in Arizona as well as the nursing home cases in the Midwest are opening up a new line of inquiry that could drive the election integrity debate well into 2022. The emerging question: Is it possible that residents legally allowed to vote had their votes illegally gathered and delivered by third parties?
It’s a question several state officials told Just the News they have begun investigating, meaning the term “ballot harvesting” may become more familiar to Americans in the weeks and months ahead.
Meanwhile, the news media and state officials may have to grapple with a more difficulty reality: It doesn’t require widespread fraud for Americans to lose faith in the election system. Mismanagement, uneven application of the laws and plain old carelessness can sow deep distrust.
Given the persistent headlines about climate change over the years, it’s surprising how long it took the Nobel Committee to award the Physics prize to a climate modeler, which finally occurred earlier this month.
Indeed, Syukuro Manabe has been a pioneer in the development of so-called general circulation climate models (GCMs) and more comprehensive Earth System Models (ESMs). According to the Committee, Manabe was awarded the prize “For the physical modelling of the earth’s climate, quantifying variability, and reliably predicting global warming.”
What Manabe did was to modify early global weather forecasting models, adapting them to long-term increases in human emissions of carbon dioxide that alter the atmosphere’s internal energy balance, resulting in a general warming of surface temperatures, along with a much larger warming of temperatures above the surface over the earth’s vast tropics.
Unlike some climate modelers, like NASA’s James Hansen — who lit the bonfire of the greenhouse vanities in 1988, Manabe is hardly a publicity hound. And while politics clearly influences it (see Al Gore’s 2007 Prize), the Nobel Committee also respects primacy, as Manabe’s model was the first comprehensive GCM. He produced it at the National Oceanic and Atmospheric Administration’s Geophysical Fluid Dynamics Laboratory (GFDL) in Princeton NJ. The seminal papers were published in 1975 and 1980.
And, after many modifications and renditions, it is also the most incorrect of all the world’s GCMs at altitude over the vast tropics of the planet.
Getting the tropical temperatures right is critical. The vast majority of life-giving moisture that falls over the worlds productive midlatitude agrosystems originates as evaporation from the tropical oceans.
The major determinant of how much moisture is wafted into our region is the vertical distribution of tropical temperature. When the contrast is great, with cold temperatures aloft compared to the normally hot surface, that surface air is buoyant and ascends, ultimately transferring moisture to the temperate zones. When the contrast is less, the opposite occurs, and less moisture enters the atmosphere.
Every GCM or ESM predicts that several miles above the tropical surface should be a “hot spot,” where there is much more warming caused by carbon dioxide emissions than at the surface. If this is improperly forecast, then subsequent forecasts of rainfall over the world’s major agricultural regions will be unreliable.
That in turn will affect forecasts of surface temperature. Everyone knows a wet surface heats up (and cools down) slower than a dry one (see: deserts), so getting the moisture input right is critical.
Following Manabe, vast numbers of modelling centers popped up, mushrooms fertilized by public — and only public — money.
Every six years or so, the U.S. Department of Energy collects all of these models, aggregating them into what they call Coupled Model Intercomparison Projects (CMIPs). These serve as the bases for the various “scientific assessments” of climate change produced by the U.N.’s Intergovernmental Panel on Climate Change (IPCC) or the U.S. “National Assessments” of climate.
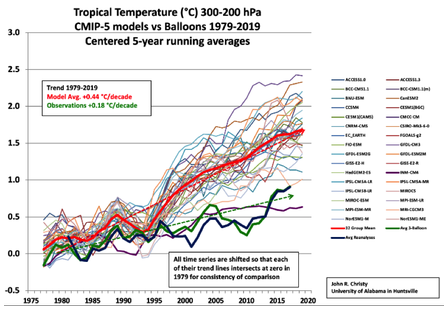
Figure 8: Warming in the tropical troposphere according to the CMIP6 models. Trends 1979–2014 (except the rightmost model, which is to 2007), for 20°N–20°S, 300–200 hPa. John Christy (2019)
In 2017, University of Alabama’s John Christy, along with Richard McNider, published a paper that, among other things, examined the 25 applicable families of CMIP-5 models, comparing their performance to what’s been observed in the three-dimensional global tropics. Take a close look at Figure 3 from the paper, in the Asia-Pacific Journal of Atmospheric Sciences, and you’ll see that the model GFDL-CM3 is so bad that it is literally off the scale of the graph. [See Climate Models: Good, Bad and Ugly]
At its worst, the GFDL model is predicting approximately five times as much warming as has been observed since the upper-atmospheric data became comprehensive in 1979. This is the most evolved version of the model that won Manabe the Nobel.
In the CMIP-5 model suite, there is one, and only one, that works. It is the model INM-CM4 from the Russian Institute for Numerical Modelling, and the lead author is Evgeny Volodin. It seems that Volodin would be much more deserving of the Nobel for, in the words of the committee “reliably predicting global warming.”
Might this have something to do with the fact that INM-CM4 and its successor models have less predicted warming than all of the other models?
Patrick J. Michaels is a senior fellow working on energy and environment issues at the Competitive Enterprise Institute and author of “Scientocracy: The Tangled Web of Public Science and Public Policy.”
The immediacy of “real-world” data in the pre-hospital treatment of Covid-19 using re-purposed drugs has been the keystone to the development of effective therapy in a pandemic situation. The sense of a “common-message database” for the therapeutic use of ivermectin (IVM) collated by clinicians over a time frame of little more than 12 months, involving patients and research workers across geographic and social lines, is extraordinary.
From over 20 countries there are 63 controlled studies accepted for meta-analysis, that have included 47,500 subjects with 625 authors.
While this compelling database on the effectiveness of IVM would not be possible without “real-life” studies, at an individual level, these trials give additional value such as information on dosage and combination therapies. They also give confidence to local doctors and regulators as they seek optimal management strategies.
Here, we report successful pre-hospital treatment of Covid-19 patients in Sydney and Melbourne, Australia, using an ivermectin-doxycycline-zinc combination with an important set of observations on symptom resolution and oximetry.
The Study
Six hundred Australian residents with positive PCR symptomatic Covid-19 were treated with a combination of ivermectin (24 mg per day), doxycycline (100 mg bd), and zinc (50mg per day), for 10 days within 48 hrs of obtaining a positive PCR test for Covid-19. The treatment period was from June to September 2021. Seven percent (7%) were given additional vitamins and nutritional supplements. Only 7% identified adverse events from the therapy, mainly minor gut symptoms of nausea, diarrhoea and heartburn. No patient stopped therapy due to adverse drug events.
A subgroup in hotel and home quarantine was available for a more detailed assessment of symptoms and oxygenation status. This cohort of 126 was assessed for 10 symptoms according to a visual analogue scale (ranging from “0” for no symptoms, to “10” for most severe symptoms). Descriptive statistics are summarised in Table 1. P-Values were calculated using Wilcoxon matched-pairs signed-rank t-tests. Chi Squared analysis was used to analyse rates of hospitalization in the 600-patient cohort.
The Outcome
A total of 600 patients with positive PCR tests were treated with the ten-day course of “Ivermectin Triple Therapy” (ITT), which was fully completed in over 90% of those treated. None discontinued therapy as a result of drug side effects. Two visited the hospital for less than 24 hours following a transient arrhythmia and then went home, while five were admitted to hospital (0.83%). There were no deaths.
In an equivalent control group of 600, not treated with triple therapy, 70 were admitted to hospital (11.5%), with 6 deaths (1%). Chi-squared analysis of hospitalisation rate shows a significant decrease (P<0.001) in the presence of ivermectin triple therapy intervention. The control data was from contemporary infected subjects in Australia obtained from published Covid Tracking Data.
The subgroup of 126 in quarantine had more detailed documentation. They had an average age of 42 (range: 17-94). The results of symptom analysis are in Table 1. For the 10 symptoms analysed, 98% had a total symptom score severity reduction by the end of the treatment period (P< 0.0001). Symptoms that were most persistent were loss of taste and smell, cough, and fatigue. Oximetry readings in 71 subjects were consistent with mild disease in most (Table 1), though the range extended to the low 70’s indicating severe disease in some individuals. At the completion of the 10 -day treatment programme, all subjects had normal oximetry readings.
Comment
This successful study of 600 consecutive subjects treated within 2 days of testing positive on PCR for Covid-19 infection, emphasises the value of early treatment. The results are consistent with the study by Hazan et al, further supporting the value of ITT therapy (ivermectin, doxycycline and zinc).1 The current study differs from that of Hazan et al who successfully used lower doses of IVM and a shorter treatment duration. The current study also confirms the value of oximetry in monitoring response to therapy, with all hypoxic patients having normal oximetry levels following the treatment protocol. Few become hypoxic in the first 48 hours of symptoms. The rapid increase in oximetry values following IVM, noted by Hazan1, confirms significant hypoxia was likely avoided in this treated group. Combining oximetry with visual analogue scales to monitor symptoms, is suggested as a valuable tool for future studies.
Visual analogue scale monitoring of symptoms of Covid-19 infection showed a fall from a median total symptom severity score of 37 (range: 0-100) at the onset of treatment to 3 (range: 0-62) at the conclusion of treatment (P<0.0001). The main persistent symptoms were loss of smell/taste, cough and fatigue, recognised to persist for longer periods, however, all displayed significant severity score reductions during the treatment period (P<0.0001). The impact of early treatment with ITT on subsequent “long Covid” will be an important question to pursue. Symptom resolution with untreated Covid-19 is generally 2-4 weeks, emphasising the value of visual analogue scale assessment.
The major differences in admission to hospital and death following ITT therapy compared to contemporary controls is consistent with the large and increasing body of data measuring the impact of ivermectin-combination therapy.1–3 The results from this study invites comparison with recently announced data by Merck from a study of their re-cycled antiviral polymerase inhibitor, Molnupiravir. The Merck study with 385 treated patients involved a similar group to that treated in the current Australian study judged by near-identical hospital admission and mortality rates in both control groups. In the Merck study, the hospital admission rate was halved (7.3% of treated patients) with no deaths, similar to data for the “first cousin” of Molnupiravir, Favipiravir, which is used extensively in Russia. The important point is that the admission rate in the Merck study is 8-fold greater than the 90% reduction in hospital admissions recorded in the current ITT study (P<0.0001).
The public health impact of these findings with a cheap, safe and available therapy, in terms of reduction of load on a health system that will be further stressed as country borders are re-opened, cannot be ignored.
The current study included “real-life” data on consecutive patients thus avoiding selection bias. Therapy was given in two states of Australia, involving over 30 front-line doctors. This compelling data reinforces the value of information from a range of sources and trial methodologies in assessing treatment options, especially in a pandemic situation. The number of patients in this report was capped at 600, as the Australian regulatory body (the TGA) intervened in the middle of Australia’s third Covid wave, to prohibit further prescription of ivermectin for Covid-19 by General Practitioners.
Regarding strategies in the development of combination therapies, intracellular coronavirus replication requires several active drugs to inhibit viral replication. IVM, doxycycline and zinc all individually inhibit coronavirus replication and, although there are other candidates, we have proposed the above combination based on efficacy, component safety profiles, inexpensive nature, and lack of drug-drug interaction. The combination of IVM and doxycycline has also been demonstrated to act in synergy against COVID-19 [33]. This combination also appears to overcome the need for high doses of IVM identified by Caly and colleagues when used alone[34]. Further, given that zinc plays a key role in antiviral activity [34536] it would combine well with the ionophores (IVM and doxycycline) to increase its intracellular concentration and expedite viral clearance [37].
We have also assessed drug-drug interactions and found that the combination of zinc with IVM and doxycycline has no reported interactions. Additionally, each of these drugs has a low adverse side effects profile and no QT prolongation as reported with azithromycin.
Overall, based on the current literature, a 10-day combination therapy of IVM, doxycycline and zinc will not only improve symptoms [6,7] but also accelerate recovery from COVID-19. We have chosen a safe IVM dosage approved for parasites of 36mg over 10 days, and this dose has been shown to be both effective and safe in COVID-19 treatments [38]. The staggered IVM dosage over 10 days is proposed based on the half-life clearance of the drug in plasma (up to 66 hrs.)[39]. The proposed duration would allow constant availability of adequate plasma level IVM to facilitate zinc entry into the cells. Hence, the above rationale explains why some publications have already shown that IVM alone is not adequate to cure COVID-19 [6,18,19] while a multidrug regimen is likely to be more efficacious [40].
Green hydrogen is making headlines around the world as many consider it a cornerstone of a successful energy transition
The Netherlands is ready to spend billions in its attempt to become a global green hydrogen hub, but some observers are becoming increasingly skeptical
The economic viability of this new investment is unclear and a growing number of critics see these investments as the government gambling with billions of euros
The future of green hydrogen looks very bright, with the renewable energy source becoming something of a media darling in recent months. The global drive to invest in green or blue hydrogen is picking up steam and investment levels are staggering. Realism and economics, however, seem to be lacking when it comes to planning new green hydrogen projects in NW Europe, the USA, and Australia.
At the same time, blue hydrogen, potentially an important bridge fuel, is being largely overlooked. The Netherlands, formerly a leading natural gas producer and NW-European gas trade and transportation hub, is attempting to establish itself as a main pillar of the European hydrogen economy. According to the Dutch government, the Netherlands is ready to provide whatever is needed to support the set-up of a new green hydrogen hub and transportation network. During the presentation of the 2021-2022 government plans in September (Prinsjesdag), Dutch PM Mark Rutte committed himself to this green hydrogen future.
Without any real assessments of the risks and potential economic threats, plans are being discussed and implemented for a multibillion spending spree on green hydrogen, involving not only the refurbishment of the Dutch natural gas pipeline infrastructure but also the building of major new offshore wind parks, targeting the construction of hundreds of additional windmills. These wind parks are going to be set up and owned by international consortia, such as the NorthH2, involving Royal Dutch Shell, Gasunie (owned by the government), and others.
The optimism about these projects is now being questioned, not only by skeptics but increasingly by parties, such as Gasunie, that are part of the deals.
Dutch public broadcaster NOS reported yesterday that questions are popping up about the feasibility and commercial aspects of these large-scale plans as well as the potential risks of a new “cartel” of offshore wind producers. The multibillion-dollar investment plans, supported by the government, are even being questioned by experts of the Dutch ministry of economy, as it is not clear at all if green hydrogen production in the Netherlands, such as the NorthH2 project in Groningen (formerly known as the Dutch natural gas province), will ever be feasible or take-off.
The commercial viability of green hydrogen is a major issue as it still needs large-scale technical innovation and scaling up of electrolyzers. At the same time, there is uncertainty over demand as industry (the main client) does not appear to be interested at present. Dutch parties are also asking themselves if the current set up of the planned offshore wind parks are not a precursor to a new wind-energy cartel in the making. Some Dutch political parties and even insiders from Gasunie are worried about a monopoly position of the likes of Shell in the future.
The increased criticism by some, such as Gasunie and political parties, with regards to the power position of commercial parties, is also very strange. Some could argue that the current hydrogen strategy of Shell and others is what society and Dutch judges have forced them to do. Shell could and should argue a very simple position “we are doing what the Dutch legal system is forcing us to do”. For parties such as Shell, at least in the Netherlands or the EU, taking up green hydrogen strategies is a new License to Operate. International energy giants such as Shell do not want to be minor players in this market. For an international player, a pivotal position in any market is a must.
In the coming weeks, especially after COP26, as criticism is now being muted by most, a potential storm could be brewing.
If assessments are pointing out that the risks being taken by the Dutch government are too high in light of the benefits, and potential higher bills for customers, potential opposition to green hydrogen plans could be growing. At the same time, the Dutch hydrogen plans are seen by most as pivotal, even in light of the EU Commission’s Green Deal plans. A full-scale backlash to hydrogen could be a reality if Dutch political parties are going to constrain implementation, while other European countries will be more skeptical about their own plans. Billions, or potentially trillions, of euros will be at risk if this new hydrogen infrastructure turns out not to be economically viable. Without the power and technology of existing energy players, especially Shell, Total, BP, or ENI, behind the set-up, the future of this new power source will remain uncertain.
Comment on Hydrogen Fundamentals
What’s Not to Love About Green Hydrogen Energy? Let us count the ways.
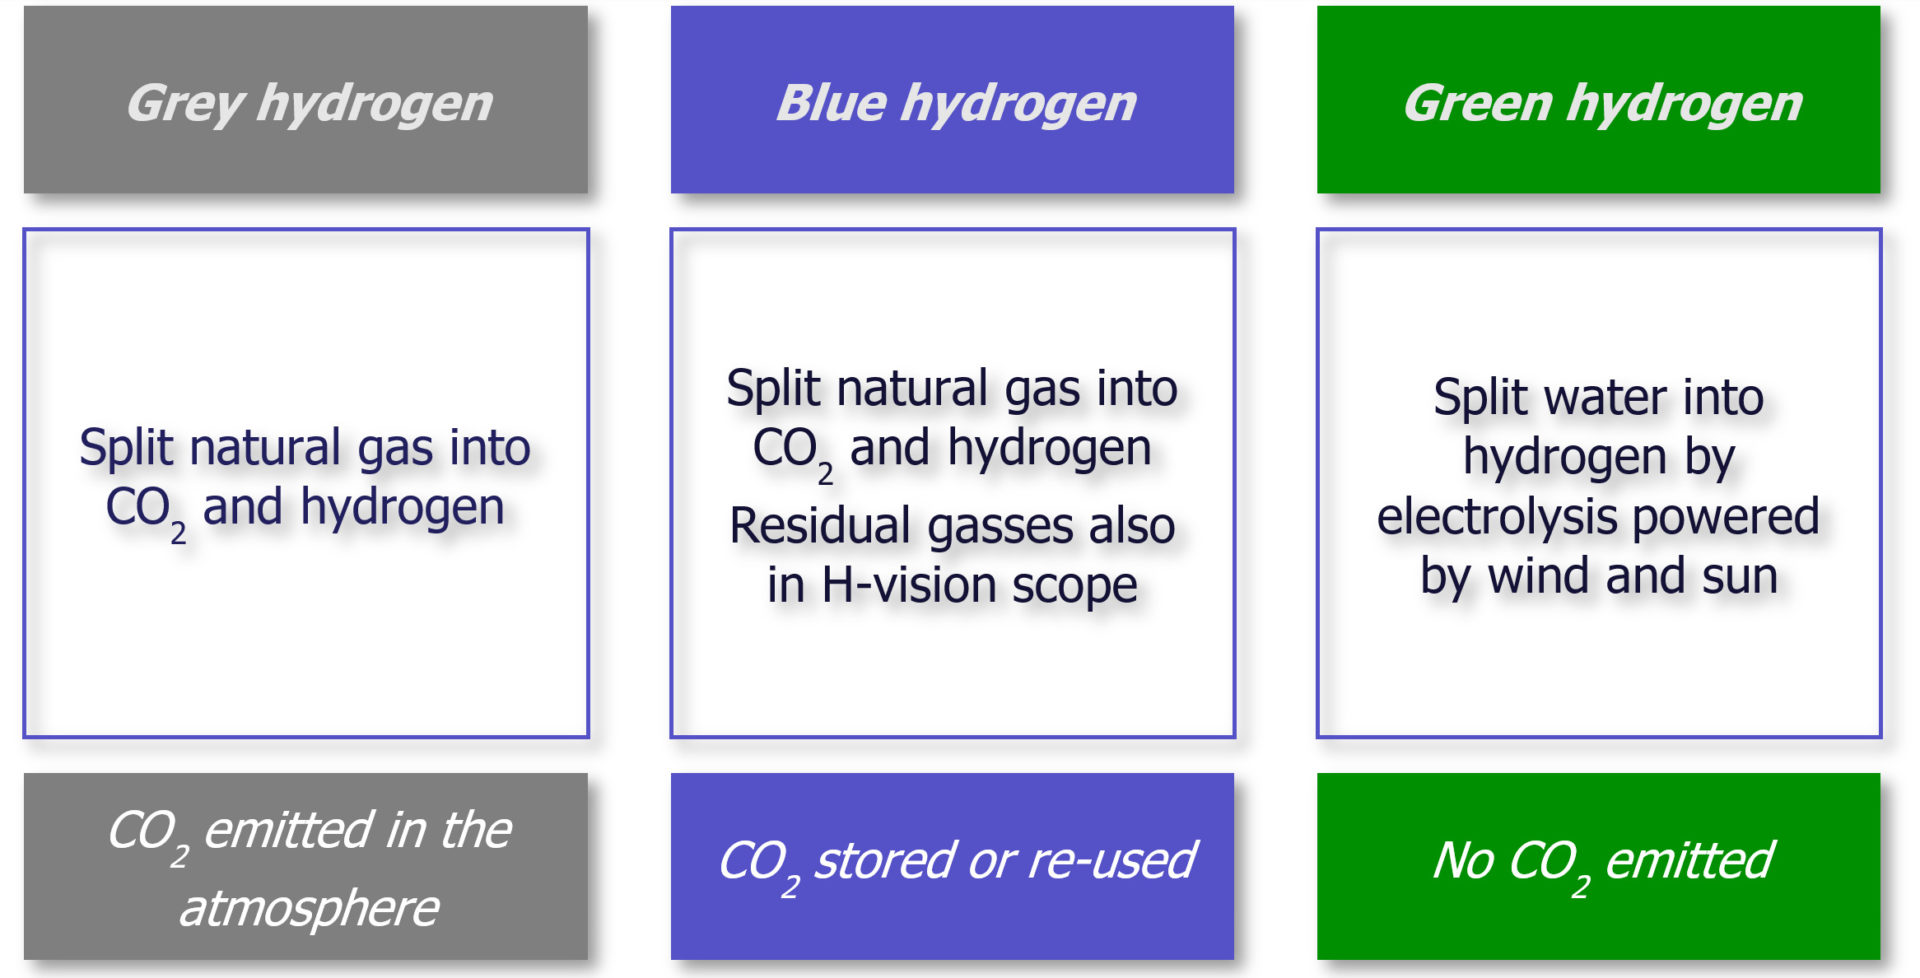
The only cost-efficient way to produce H2 presently is electrolysis of H2O, powered by natural gas. This is called grey hydrogen. Objections: Burning the CH4 to generate the electricity gives off CO2, albeit less emissions than coal would. But because of energy losses in the process, the resulting H2 put into fuel cells delivers less energy than the CH4 that was burned. Better to run the cars using CH4 as fuel directly.
To lower the carbon footprint, some propose blue hydrogen, defined as H2 produced with fossil fuels, but including carbon capture to use or bury the CO2 emitted. Objections: Carbon Capture has not yet been scaled to be commercially viable, and in any case increases the cost of the resulting H2. And it is still less energy output than was input.
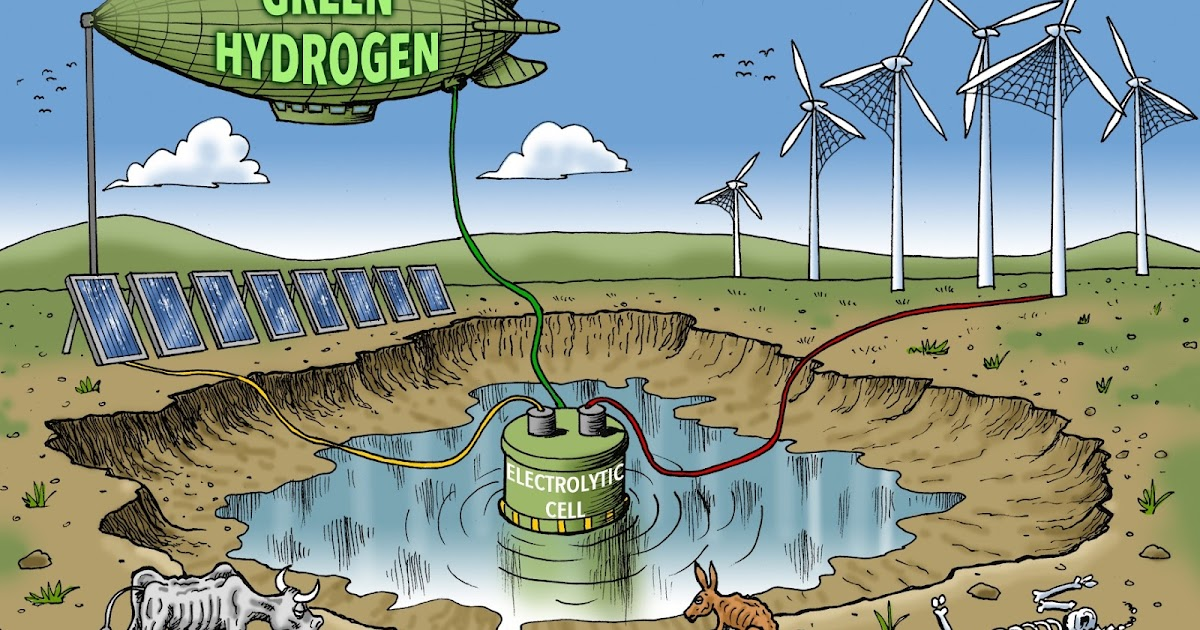
The latest dream is green hydrogen, which is H2 produced by electrolysis powered by wind or solar farms. Some proposed that this is a clean way to store intermittent renewable energy for use on demand. Objections: Wind and solar power is not clean or cheap, but involves high tech machinery requiring the extraction, transportation and refining of rare metals. Extensive tracts of land must be allocated to these installations, or else locating them offshore. Transmission lines must be built and maintained, and the panels or windmills depreciate rapidly. As well, the highly flammable H2 must be transported and stored prior to making fuel cells.
And the elephant in the room: Water is a precious resource.
One industry source told Oilprice that the production of one ton of hydrogen through electrolysis required an average of nine tons of water. But to get these nine tons of water, it would not be enough to just divert a nearby river. The water that the electrolyzer breaks down into constituent elements needs to be purified
The process of water purification, for its part, is rather wasteful. According to the same source, water treatment systems typically require some two tons of impure water to produce one ton of purified water. In other words, one ton of hydrogen actually needs not nine but 18 tons of water.
Accounting for losses, the ratio is closer to 20 tons of water for every 1 ton of hydrogen.
Speaking of water purification, organic chemists explain that the simplest way to do this is by distilling it. This method is cheap because it only needs electricity, but it is not fast. Regarding the electricity cost, distilling a liter of water requires 2.58 megajoules of energy, which translates into 0.717 kWh, on average.
So, providing the right kind of water for hydrolysis costs money, and while $2,400 per ton of hydrogen may not sound like much, the cost of purifying water is not the only water-related expense in the technology that seeks to make hydrogen from renewable sources. Besides being pure, the water to be fed into an electrolyzer has to be transported to it.
Transporting tons upon tons of water to the site of an electrolyzer means more expenses for the logistics. To cut these, it would make sense to pick a site where water is abundant, such as by a river or the sea, or, alternatively, close to a water treatment facility. This puts a limit on the choice of locations suitable for large-scale electrolyzers. But since an electrolyzer, to be green, needs to be powered by renewable energy, it would also need to be in proximity to a solar or a wind farm. These, as we know, cannot be built just anywhere; solar farms are most cost-effective in places with a lot of sunshine, and wind farms perform best in places where there is sufficient wind.
Not all costs associated with the production of hydrogen from renewable energy sources are the costs of those renewable energy sources. Water is the commodity that the process needs, and it is a little odd that nobody seems willing to discuss the costs of water, including the European Commission’s Green Deal Team.
Summary: We now know it was a big mistake to divert corn from food production into biofuel. Will we make an even worse mistake converting drinking water into hydrogen fuel?


 The table below shows the distribution of Sea Ice on day 304 across the Arctic Regions, on average, this year and 2020.


 Patrick J. Michaels reports at Real Clear Policy