Wither the GOP?

Daniel Gelernter has some interesting ideas about where things may be headed in this turbulent time in US politics.  His article is Why Is the GOP Glad Trump Lost?  Excerpts in italics with my bolds and images.

Establishment Republicans will learn the hard way how very much they have lost in helping Joe Biden win the way he did.

A little after 2 p.m. Eastern time on Wednesday, protesters crashed into the U.S. Capitol and forced a halt in the certification of the electoral vote. As the Senate reconvened that night, Senate Majority Leader Mitch McConnell (R-Ky.), speaking as though he had just survived 9/11, condemned the “thugs” waving flags who had forced them to run away for a few hours. Man of the People Mitt Romney, who probably will not repeat his mistake of flying commercial, called the Capitol storm “an insurrection, incited by the president of the United States.”

If you wonder where these big politicians were last year when people were having their businesses closed down by government mandates or watching their cars torched by Antifa with Molotov cocktails, the answer is they were most likely in incredibly comfortable homes, enjoying taxpayer-guaranteed salaries and genuinely insane expense accounts, secure in the knowledge that, whatever happens—whether they return to Capitol Hill for the rest of their lives or are forced one day into semi-retirement on K Street—they will never again have to live like “normal people.”

And when they blame President Trump for the Capitol protest, they are doubly foolish and doubly deceived.

First, they implicitly deny that these protestors had any reason to be upset. Even the CHAZ protestors who demolished central Seattle were granted the presumption that they might have had reasons, however misguided.  But the Capitol Hill protestors had already been told, repeatedly, by the news media, social media, and their political leaders, to shut up and go home. And yet they didn’t—so it must be Trump’s fault.

The idea that a large part of America genuinely could be infuriated by the behavior of our elected officials has not dawned on them. When they get yelled at on planes, they think, “Why don’t my constituents believe me? Why don’t they trust me? It’s Trump’s fault!”

But they never ask themselves if they might have given their constituents legitimate reasons not to trust them. Did they ever, for example, vote to send a $10 million check to Pakistan and a $600 check to some Americans? Would that upset anyone?

Today, these politicians are breathing a sigh of relief—their second mistake: “My constituents trusted me before Trump came,” they think. “Now that he’s on the way out the door, they will trust me again!” They believe that Trump not being president means that they can go back to vacuuming up money and power just as before. They think Trump is finished.

In reality, they are finished.

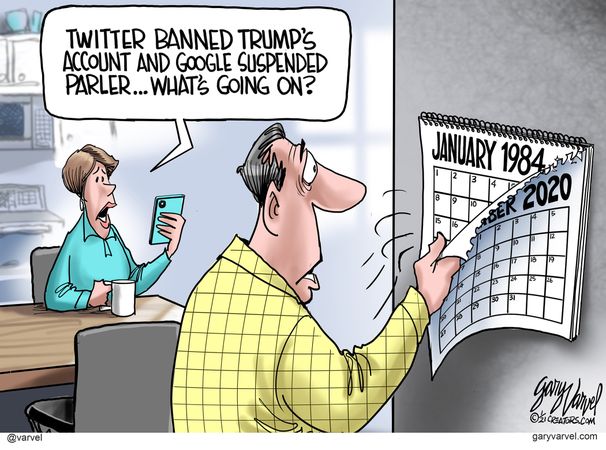
Trump could have announced the formation of a new political party. A majority of Republican voters probably would have followed him. Eventually, after a few election cycles of mutual destruction, the rest of the GOP reluctantly would acquiesce in a new party which would likely have many of the same ills as the old. Instead, Trump has made clear his intention of primarying every Republican who opposed airing election fraud claims in court.

Career GOP politicians will spend the next several years watching “their” party rapidly remade in what they mistakenly believe to be Trump’s image. But it is actually the image of a large part of America that feels totally ignored.

The principals that Trump represents do not start and end with Trump. Limited regulation, limited government, low taxes, fair trade, stricter immigration laws, belief in God and in the earnest goodness of the average American, a weariness of foreign wars and entanglements: You might call it George Washington conservatism. These ideas have been absent from politics for at least 30 years, as voters had a choice between the party of big government and the party that claims to prefer limited government but also embraces big government.

These are the ideas Trump has expressed and on which he governed.. America First: You mind your business and we’ll mind ours.

If a politician rolls his eyes at that suggestion, he’ll never understand why the people don’t want him. He’ll never understand why those angry Americans were at the Capitol the other day. He’ll never understand why he lost his seat and had to become a highly paid consultant instead of a highly paid public servant.

When Trump tells his supporters that the journey is only beginning, the leftist media and conservative elite bite their collective nails—Does this mean Trump will come back? Not necessarily. It means that the movement Trump has started will go on no matter what—it means that America will come back.

We’ve been terribly governed for large parts of the last century, and before. How would you feel if one day the government told you you weren’t allowed to buy or drink alcohol, and that if you owned a distillery you’d just lost your livelihood? Of course that happened in 1920, and most Americans responded by quietly disobeying the law. Most politicians also disobeyed the law, but in much greater comfort and with the tacit approval of their friends in law enforcement. The arrival of organized crime in America was an unintended consequence.

How would you feel if the government declared that employers couldn’t raise wages? That happened in 1942. Employers skirted the law by creating the concept of “health benefits,” which did not count as wages. That had the unintended consequence of spawning a monster health insurance industry that destroyed private medical care in America.

One day in the future Americans might be told that their guns are illegal and must be turned in—and the government would probably discover that Americans somehow own vastly fewer guns than was thought. And that might have the unintended consequence of all those missing guns showing up one day in the hands of a well-regulated and very displeased militia.

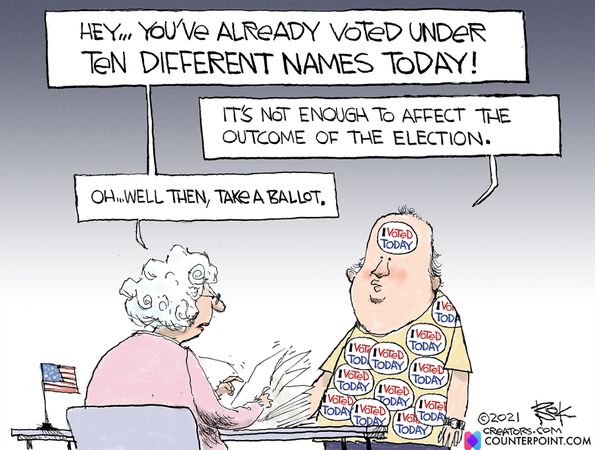
Americans will not submit themselves to laws that they, on a large scale, think unjust. Nor will they submit themselves to be governed by leaders whom they, on a large scale, do not believe are elected. In 1960, Nixon decided it would be best to hush up his having been cheated out of the presidency. He was well-intentioned, but he was wrong. Trump knows that stealing an election isn’t a personal affront—it’s an attack on every American who casts a ballot. Precisely the opposite of the media’s demented obsession, Trump is one of the very few people in politics who understand that it isn’t just about him.

By pretending that it is all about him, our big-shot politicians have an excuse to ignore the Americans whom Trump has represented.

But the George Washington conservatives are awake now, and they will find other voices, and more voices. Trump will be with them, but they will find new leaders as well. They don’t want much—put in a single phrase their demands boil down to “Leave us alone!” A Biden Administration, unelected though it may be, can survive if it listens to that very basic demand. But the GOP will learn the hard way how very much they have lost in helping Biden win the way he did.

See also posts by David Gelernter (Daniel’s father?):

The Real Reason They Hate Trump

How Science Is Losing Its Humanity


Guess Who’s Kicking the Pandemic? (it’s not EU, US or Canada)

TrialSiteNews gives the answer in article An Unlikely Nation Is Kicking This Pandemic. Guess Which. Then Why. Excerpts in italics with my bolds.

She is a gynecologist. He is a surgeon. They are married and both 77 years old.

In mid-November, they were diagnosed with COVID-19, first her, then him. Their paths diverge at this point, but not to worry.

She took the drug hydroxychloroquine. He took ivermectin. They are both well now – walking, golfing, doing yoga — seven weeks later.

The couple’s brush with COVID might have ended very differently. In the United States, patients 75 to 84 years old die at 220 times the rate of adults under 30. But these two elderly, otherwise healthy physicians live in India. They were able to get early home treatment that is virtually, and unconscionably, unheard of in many western countries.

“Without any treatment, we know that the virus enters the cells and replicates there,” Dr. Makarand Paranjpe told me by phone from his home in Pune, where he had quarantined through a fever and other symptoms. “They can create disease that gets much more severe.” Which, of course, is the point of treating early. Stop the progression. ASAP.

From the outset, India, a nation of both economic vigor and poverty, knew it had to act decisively. It did. India locked down early and long; it promoted masks, tested millions, and, as with the Pune couple, treated the infected early.

Ten months into its battle with the SARS-CoV-2 virus, India is on track to become an unexpected warrior in the fight against this global pandemic. Although the densely populated nation has four times the population of the U.S., India has less than half the U.S. COVID deaths. And India isn’t just beating the poorly performing U.S. In all, 98 nations have higher death rates than India.

It may be tempting to attribute this startling news to imperfect data from a developing country. But doctors in India, Indian press reports, and even the Wall Street Journal have taken note of a sea change in COVID there. “In September, India was reporting almost 100,000 COVID-19 cases a day, with many predicting it would soon pass the U.S. in overall cases,” the WSJ wrote on Dec. 30. “Instead, its infections dropped and are now at one-fourth that level.”

Dr. Anil K. Chaurasia, a physician in Lucknow, in the state of Uttar Pradesh, watched this trend unfold. Starting about mid-September, “a clear decline in COVID cases and fatalities in India was noticeable,” he told me in a text message. The “steep decline in cases and fatalities is still continuing.”

Like a lot of western reporting, the WSJ article held fast to an accepted COVID theme. The Indian miracle was due to masks, it asserted, since they are worn by 88 to 95 percent of a population “bombarded” with public-service reminders. The article cited German research that showed masks work.

Fair enough. However, many factors are likely at play in India, including its painful yet supported national shutdown and individual state efforts at contact tracing and testing. But a pivotal role in any illness is surely the availability of treatments to resolve illness before crisis.

Late last March, as the U.S. argued over the merits of Trump-endorsed hydroxychloroquine and studies failed in late-stage patients, India decided to recommend the drug in its national guidelines. HCQ “should be used as early in the disease course as possible…and should be avoided in patients with severe disease,” the directives wisely state. As a precaution, authorities suggested an EKG to monitor for a rare heart arrhythmia that several COVID studies have since shown to be minimal.

But a crucial turn for India may have come in August when the Indian state of Uttar Pradesh recommended use of another drug: Ivermectin, which is coming on fast as a leading COVID treatment — without the baggage of at-turns effective but vilified hydroxychloroquine.

This was no small move. Were it a country, U.P.’s more than 230 million citizens would rank it fifth worldwide. As India’s largest state, its embrace of ivermectin may have changed the treatment landscape across India.

“This authentication of ivermectin revived the faith of people,” Dr. Chaurasia told me, “and net result was a massive inclination to take these drugs” — both ivermectin and hydroxychloroquine.

By the end of 2020, Uttar Pradesh — which distributed free ivermectin for home care — had the second-lowest fatality rate in India at 0.26 per 100,000 residents in December. Only the state of Bihar, with 128 million residents, was lower, and it, too, recommends ivermectin.

See Also:  Why Pandemic Responses Fail


Trump Takeaways

It was always fashionable to trash talk Trump, but to my surprise it has only grown in political correctness post election this year.  For those who wonder why they are so consumed with the need to disparage him, Conrad Black explains in his article today: Establishment’s Threat of Impeachment a Confession of Failure.  An excerpt below is in italics with my bolds and images.

It all begs the question of why Trump’s enemies are still so fanatical in their efforts to separate him from his huge following and destroy him politically, in Stalinist fashion. In part, the Democrats seem now to be addicted to the practice of distracting the public from the political unacceptability of their own program and record by a febrile defamation of the president.

He is not and never in his adult life was a racist or sexist. He has a number of annoying mannerisms. They can be seen by everyone and voters decide for themselves whether they outweigh the president’s better qualities and achievements.

The obsessive desire to destroy Trump even as he leaves the presidency cannot be based on anything but fear of a man who has successfully defied the political establishment, exposed it as substantially a failure, and exploited the fact that the pre-Trump status quo was despised by a majority of Americans.

The logical and creditable response to the collapse in the prestige of the country’s orthodox leaders is to raise their game, put up better candidates in both the parties (not the dismal selection of senatorial candidates available to Georgia’s voters last week), and produce some original policies. Instead, they have just tried to stone to death the person who did produce original policies.

Serving the Country Well

The political establishment has tragically missed the point: if it had been serving the country well Trump would not have been elected four years ago.  If he had not been a capable president most of his policies would not have been effectively endorsed in the congressional and state elections across the country. Those whom he displaced would not have had to resort to such extremes to evict him from the White House.

Polls indicate uniformly that barely 10 percent of Americans respect the legislators in the Congress and no more than 15 percent of Americans believe their media. Even the questionable election revealed that 48 percent of Americans preferred Trump to the candidate of Wall Street, Silicon Valley, Hollywood, academia and the media and social media, despite the Democrats’ huge financial advantage and wall-to-wall media defamation of the incumbent.

The pre-Trump decades brought endless, fruitless war in the Middle East, with an accompanying humanitarian disaster; the greatest economic crisis in the world in 80 years; more than ten million unskilled illegal migrants flooding across the southern border; immense trade deficits; alarming advances by China at America’s expense; and Trump’s predecessors were swindled by North Korea and Iran.

Trump addressed these problems; the dire predictions of his dangerous incompetence came to nothing, his vote total grew by 20 percent between elections, and his party did well in congressional and state elections.

Yet his opponents didn’t respond with better candidates or policies, they exhumed the defeated candidates Joe Biden and Kamala Harris and set them atop a Sanders-Warren far-left program, ignored the worst rioting in the country for over fifty years, apart from defunding police and engineering huge spikes in violent crime, and exploited the COVID crisis to adopt election laws that incite the inference that the election has been stolen.

And they got a free pass when the Supreme Court declined to hear the complaint from Texas supported by eighteen other states that four states had failed to assure a fair presidential election. Trump’s 74 million supporters were left with nothing to do except protest.

Only Alternative

In falsely accusing Trump of inciting insurrection, they have again ignored the public desire for better government and have effectively confirmed Donald Trump as the only alternative to the present familiar source of poor government. Joe Biden’s response to the outrages at the Capitol were that Trump had deliberately incited it, that the motives of the rioters were racist, that the Capitol Police were racists, that Trump was reminiscent of Nazi propaganda minister Josef Goebbels, and then Biden called for national unity.

Trump made a serious mistake in imagining and publicly asking that Vice President Pence reject the determination by the Senate of the Electoral College vote. Pence had no authority to do anything of the kind. But Pence’s election was as much violated as Trump’s and if he attends the inauguration now, Pence will be choosing the Democratic antics over this own party and needlessly compromise his political future.

Impeachment is nonsense, Trump won’t resign and an inept government won’t be able to use defamation and dirty tricks as a substitute for public service for long.

If Trump is the only person who can defend the people against incompetent administration, cowardly legislators and jurists, and a system that has become largely rotten and doesn’t run honest elections or even fair trials, (98 percent conviction rate and a quarter of the world’s prison population), while a totalitarian woke media and dictatorial censors of social media silence dissent, his influence will rise and not be dissipated.


Oceans Confirm Global Cooling Year End 2020


The best context for understanding decadal temperature changes comes from the world’s sea surface temperatures (SST), for several reasons:

  • The ocean covers 71% of the globe and drives average temperatures;
  • SSTs have a constant water content, (unlike air temperatures), so give a better reading of heat content variations;
  • A major El Nino was the dominant climate feature in recent years.

HadSST is generally regarded as the best of the global SST data sets, and so the temperature story here comes from that source, the latest version being HadSST3.  More on what distinguishes HadSST3 from other SST products at the end.

The Current Context

The year end report below shows 2020 is rapidly cooling in all regions.  The anomalies have been dropping sharply and are now well below the averages since 1995.  This Global Cooling was also evident in the UAH Land and Ocean air temperatures (See Big Chill Over Land and Sea with 2020 End )

The chart below shows SST monthly anomalies as reported in HadSST3 starting in 2015 through December 2020. After three straight Spring 2020 months of cooling led by the tropics and SH, NH spiked in the summer.  Now temps everywhere are dropping the last four months, with SH the lowest in this period, and Global and Tropical anomalies below average since 2015.

A global cooling pattern is seen clearly in the Tropics since its peak in 2016, joined by NH and SH cycling downward since 2016.  In 2019 all regions had been converging to reach nearly the same value in April.

Then  NH rose exceptionally by almost 0.5C over the four summer months, in August 2019 exceeding previous summer peaks in NH since 2015.  In the 4 succeeding months, that warm NH pulse reversed sharply. Then again NH temps warmed to a 2020 summer peak, matching 2019.  This has now been reversed with all regions pulling the Global anomaly downward sharply.

Note that higher temps in 2015 and 2016 were first of all due to a sharp rise in Tropical SST, beginning in March 2015, peaking in January 2016, and steadily declining back below its beginning level. Secondly, the Northern Hemisphere added three bumps on the shoulders of Tropical warming, with peaks in August of each year.  A fourth NH bump was lower and peaked in September 2018.  As noted above, a fifth peak in August 2019 and a sixth August 2020 exceeded the four previous upward bumps in NH.

And as before, note that the global release of heat was not dramatic, due to the Southern Hemisphere offsetting the Northern one.  The major difference between now and 2015-2016 is the absence of Tropical warming driving the SSTs, along with SH anomalies reaching nearly the lowest in this period. Presently both SH and the Tropics are quite cool, with NH coming off its summer peak.  Note the tropical temps descending into La Nina levels.  At this point, the 2016 El Nino and its NH after effects have dissipated completely.

A longer view of SSTs

The graph below  is noisy, but the density is needed to see the seasonal patterns in the oceanic fluctuations.  Previous posts focused on the rise and fall of the last El Nino starting in 2015.  This post adds a longer view, encompassing the significant 1998 El Nino and since.  The color schemes are retained for Global, Tropics, NH and SH anomalies.  Despite the longer time frame, I have kept the monthly data (rather than yearly averages) because of interesting shifts between January and July.

To enlarge image, double-click or open in new tab.

1995 is a reasonable (ENSO neutral) starting point prior to the first El Nino.  The sharp Tropical rise peaking in 1998 is dominant in the record, starting Jan. ’97 to pull up SSTs uniformly before returning to the same level Jan. ’99.  For the next 2 years, the Tropics stayed down, and the world’s oceans held steady around 0.2C above 1961 to 1990 average.

Then comes a steady rise over two years to a lesser peak Jan. 2003, but again uniformly pulling all oceans up around 0.4C.  Something changes at this point, with more hemispheric divergence than before. Over the 4 years until Jan 2007, the Tropics go through ups and downs, NH a series of ups and SH mostly downs.  As a result the Global average fluctuates around that same 0.4C, which also turns out to be the average for the entire record since 1995.

2007 stands out with a sharp drop in temperatures so that Jan.08 matches the low in Jan. ’99, but starting from a lower high. The oceans all decline as well, until temps build peaking in 2010.

Now again a different pattern appears.  The Tropics cool sharply to Jan 11, then rise steadily for 4 years to Jan 15, at which point the most recent major El Nino takes off.  But this time in contrast to ’97-’99, the Northern Hemisphere produces peaks every summer pulling up the Global average.  In fact, these NH peaks appear every July starting in 2003, growing stronger to produce 3 massive highs in 2014, 15 and 16.  NH July 2017 was only slightly lower, and a fifth NH peak still lower in Sept. 2018.

The highest summer NH peak came in 2019, only this time the Tropics and SH are offsetting rather adding to the warming. Since 2014 SH has played a moderating role, offsetting the NH warming pulses. Now September 2020 is dropping off last summer’s unusually high NH SSTs. (Note: these are high anomalies on top of the highest absolute temps in the NH.)

What to make of all this? The patterns suggest that in addition to El Ninos in the Pacific driving the Tropic SSTs, something else is going on in the NH.  The obvious culprit is the North Atlantic, since I have seen this sort of pulsing before.  After reading some papers by David Dilley, I confirmed his observation of Atlantic pulses into the Arctic every 8 to 10 years.

But the peaks coming nearly every summer in HadSST require a different picture.  Let’s look at August, the hottest month in the North Atlantic from the Kaplan dataset.
The AMO Index is from from Kaplan SST v2, the unaltered and not detrended dataset. By definition, the data are monthly average SSTs interpolated to a 5×5 grid over the North Atlantic basically 0 to 70N. The graph shows August warming began after 1992 up to 1998, with a series of matching years since, including 2020.  Because the N. Atlantic has partnered with the Pacific ENSO recently, let’s take a closer look at some AMO years in the last 2 decades.

This graph shows monthly AMO temps for some important years. The Peak years were 1998, 2010 and 2016, with the latter emphasized as the most recent. The other years show lesser warming, with 2007 emphasized as the coolest in the last 20 years. Note the red 2018 line is at the bottom of all these tracks. The black line shows that 2020 began slightly warm, then set records for 3 months. then dropped below 2016 and 2017, peaked in August and is now below 2016.

Summary

The oceans are driving the warming this century.  SSTs took a step up with the 1998 El Nino and have stayed there with help from the North Atlantic, and more recently the Pacific northern “Blob.”  The ocean surfaces are releasing a lot of energy, warming the air, but eventually will have a cooling effect.  The decline after 1937 was rapid by comparison, so one wonders: How long can the oceans keep this up? If the pattern of recent years continues, NH SST anomalies may rise slightly in coming months, but once again, ENSO which has weakened will probably determine the outcome.

Footnote: Why Rely on HadSST3

HadSST3 is distinguished from other SST products because HadCRU (Hadley Climatic Research Unit) does not engage in SST interpolation, i.e. infilling estimated anomalies into grid cells lacking sufficient sampling in a given month. From reading the documentation and from queries to Met Office, this is their procedure.

HadSST3 imports data from gridcells containing ocean, excluding land cells. From past records, they have calculated daily and monthly average readings for each grid cell for the period 1961 to 1990. Those temperatures form the baseline from which anomalies are calculated.

In a given month, each gridcell with sufficient sampling is averaged for the month and then the baseline value for that cell and that month is subtracted, resulting in the monthly anomaly for that cell. All cells with monthly anomalies are averaged to produce global, hemispheric and tropical anomalies for the month, based on the cells in those locations. For example, Tropics averages include ocean grid cells lying between latitudes 20N and 20S.

Gridcells lacking sufficient sampling that month are left out of the averaging, and the uncertainty from such missing data is estimated. IMO that is more reasonable than inventing data to infill. And it seems that the Global Drifter Array displayed in the top image is providing more uniform coverage of the oceans than in the past.

uss-pearl-harbor-deploys-global-drifter-buoys-in-pacific-ocean

USS Pearl Harbor deploys Global Drifter Buoys in Pacific Ocean


Big Chill Over Land and Sea with 2020 End

banner-blog

With apologies to Paul Revere, this post is on the lookout for cooler weather with an eye on both the Land and the Sea.  While you will hear a lot about 2020 temperatures matching 2016 as the highest ever, that spin ignores how fast is the cooling setting in.  The UAH data analyzed below shows that warming from the last El Nino is now fully dissipated with all regions heading down.

UAH has updated their tlt (temperatures in lower troposphere) dataset for December.  Previously I have done posts on their reading of ocean air temps as a prelude to updated records from HADSST3. This month also has a separate graph of land air temps because the comparisons and contrasts are interesting as we contemplate possible cooling in coming months and years.

Presently sea surface temperatures (SST) are the best available indicator of heat content gained or lost from earth’s climate system.  Enthalpy is the thermodynamic term for total heat content in a system, and humidity differences in air parcels affect enthalpy.  Measuring water temperature directly avoids distorted impressions from air measurements.  In addition, ocean covers 71% of the planet surface and thus dominates surface temperature estimates.  Eventually we will likely have reliable means of recording water temperatures at depth.

Recently, Dr. Ole Humlum reported from his research that air temperatures lag 2-3 months behind changes in SST.  He also observed that changes in CO2 atmospheric concentrations lag behind SST by 11-12 months.  This latter point is addressed in a previous post Who to Blame for Rising CO2?

After a technical enhancement to HadSST3 delayed March and April updates, May resumed a pattern of HadSST updates mid month.  For comparison we can look at lower troposphere temperatures (TLT) from UAHv6 which are now posted for December. The temperature record is derived from microwave sounding units (MSU) on board satellites like the one pictured above. Recently there was a change in UAH processing of satellite drift corrections, including dropping one platform which can no longer be corrected. The graphs below are taken from the new and current dataset.

The UAH dataset includes temperature results for air above the oceans, and thus should be most comparable to the SSTs. There is the additional feature that ocean air temps avoid Urban Heat Islands (UHI).  The graph below shows monthly anomalies for ocean temps since January 2015.

Note 2020 is warmed mainly by a spike in February in all regions, and secondarily by an October spike in NH alone. Now in 2020 November and December ocean temps are plummeting in NH and the Tropics, while SH is little changed. Both NH and the Tropics are now as cold as any time in the last five years, and all regions are comparable to to 2015 prior to the 2016 El Nino event.

Land Air Temperatures Tracking Downward in Seesaw Pattern

We sometimes overlook that in climate temperature records, while the oceans are measured directly with SSTs, land temps are measured only indirectly.  The land temperature records at surface stations sample air temps at 2 meters above ground.  UAH gives tlt anomalies for air over land separately from ocean air temps.  The graph updated for December is below.

Here we have fresh evidence of the greater volatility of the Land temperatures, along with an extraordinary departure by SH land.  Land temps are dominated by NH with a spike in February, followed by cooling down to July.  Then NH land warmed with a second spike in November.  Note the mid-year spikes in SH winter months. Now in December all of that has been wiped out. All regions are comparable to early 2015, prior to the 2016 El Nino.

The Bigger Picture UAH Global Since 1995

The chart shows monthly anomalies starting 01/1995 to present.  The average anomaly is 0.18, which was typical after the 1998 El Nino ended, and again after the smaller 2010 event. The 2016 El Nino matched 1998 with NH after effects lasting longer, followed by the NH warming 2019-20, with temps now returning again to the mean.

TLTs include mixing above the oceans and probably some influence from nearby more volatile land temps.  Clearly NH and Global land temps have been dropping in a seesaw pattern, more than 1C lower than the 2016 peak.  Since the ocean has 1000 times the heat capacity as the atmosphere, that cooling is a significant driving force.  TLT measures started the recent cooling later than SSTs from HadSST3, but are now showing the same pattern.  It seems obvious that despite the three El Ninos, their warming has not persisted, and without them it would probably have cooled since 1995.  Of course, the future has not yet been written.

How Washington Was Lost, What to Do Now

John Solomon writes with perspective about what happened along with advice for the future of the republic in his article How the GOP lost control of Washington, and what comes next.  Excerpts in italics with my bolds.

News Analysis: Democrats owned the narrative and rules of the 2020 election. Will Republicans learn from it?

The November election (and Tuesday’s Georgia curtain call) wasn’t won and lost by the tactics, spending, individual players and messaging in the weeks before Nov. 3, according to interviews conducted with more than three dozen frontline players.

Rather, its outcome was cemented long before Labor Day 2020 by a Democratic machinery of former Barack Obama proteges, like David Plouffe, John Podesta, David Axelrod and Stacey Abrams, who worried far less about the tactics of ads, travel (Joe Biden hardly did!) and fundraising and far more about the strategy of how to control the narrative and the rules that would shape the outcome.

They even told the Republicans and the public what they planned to do. Just read Plouffe’s book, “A Citizen’s Guide to Beating Donald Trump.” They even boastfully predicted days before how the vote count would roll out on election night and for several days later. Trump would lead early, and Biden would surpass late, they said.  They were right. Why?

Change the Rules in Your Favor

First and foremost, they usurped the powers of GOP-controlled state legislatures in the five battleground states and rewrote the rules of how votes would be cast and counted, using the pandemic as an excuse.

Mail ballots could be sent to everyone, even if they didn’t ask for one, and wide swaths of Americans could vote by mail. Voter ID requirements could be suspended for those who felt homebound by COVID’s wrath. Mobile ballot boxes could be deployed. Spoiled ballots that legally were supposed to be discarded could be “cured” by election clerks. Legally required voter roll purges could be skipped. And a single billionaire could donate $350 million directly to the election clerks, judges and vote counters in the states, requiring them in some cases to register voters, and create more poll locations in Democratic strongholds.

And Republicans — who controlled the legislatures in Wisconsin, Michigan, Pennsylvania, Georgia and Arizona and the constitutional right to set the rules — hardly put up a fight. Instead, they urged their voters not to take advantage of the loosened rules and to vote the old-fashioned way. They, in the words of the Trump-loving Georgia Democrat Vernon Jones, simply unilaterally disarmed.

Democrats understood that in a pandemic and in an America with millions of new millennial, urban and minority voters, the easier you make casting a ballot the more likely a low-propensity voter is to vote. Send it to them, help them register, make easy drop-off locations or the mailbox the final destination, and voters will vote a lot more willingly.

In other words, the liberal brain trust engaged in cutting-edge warfare, while Republicans tossed their comfortable set of horseshoes from the 1980s, hoping the good old recipe of evangelical GOTV, direct mail, talk radio and Fox News would deliver yet another election win as it had done for decades.

It didn’t.

To be fair, Donald Trump mustered — by a mile — the largest national vote ever assembled by a Republican at 75 million-plus voters and barnstormed the country, risking COVID and criticism without fear. Kevin McCarthy picked an all-star slate of candidates and picked up seats. Mitch McConnell raised a ton of money, and Ronna McDaniel put together one of the most impressive get-out-the-vote efforts ever assembled.

But all that could not overcome the advantage of a rewired electoral system in the five battlegrounds, as the Georgia runoffs showed Tuesday, said Tom Price, a former congressman and Trump Cabinet secretary.

Democrats “leap-frogged Republicans’ process, strategy, technology and tactics, and that is to the credit of folks on the Democratic side,” Price told Just the News. “They have perfected harvesting, I believe it is harvesting, of absentee ballots, and I think the numbers will show in these runoff races, the same as they did in November, that Republicans who lost by close margins won the vote on Election Day, won on early voting in person and lost heavily in absentee ballots.”

Control the Narrative by Means of Media Allies

Secondly, liberals spent two decades building an alliance with the mainstream media, the social giants and the search giants and the permanent government bureaucracy until they could control the narrative, even when it wasn’t true. They had it perfected by the time Donald Trump took office.

Those who objected were canceled and shamed. Intelligence and law enforcement and private investigators were misused to create false realities. True facts and legally protected speech were outright censored long enough to create the narrative needed to win.

Trump colluded with Russia, and bribed Ukraine to investigate his political opponents … though he didn’t. The Hunter Biden corruption story was Russian-fed conspiracy theory …. though it is really true, and he was under criminal investigation the last two years … American towns could be burned to the ground and police defunded because a Kenosha, Wisc., officer shot an unarmed man … who turned out to be wanted by police and armed with a knife.

Owning the information superhighway of the 21st century, like the rules of the election, was far more powerful than choosing where to run ads, campaign in person or spend money.

Liberal Donors Contracted Returns on Their Investments

Finally, the liberal oligarchs club — George Soros, Mark Zuckerberg, Mike Bloomberg et al — spent more than ever to win. But they also transformed the way political donations were spent by imposing corporate governance and specific returns on investment.

Every recipient had to deliver very specific outcomes to keep getting money, governed by lengthy contract-like documents. And the outcomes and deliverables were mapped to the two larger goals of controlling the narrative and the rules of the election.

Advice:  Act Now to Change the Rules and Own the Narrative

That’s what interviews with three dozen experts revealed. So what do those same experts advise Republicans do to change their fortunes?  Exactly what the Democrats did. Don’t point fingers, change the rules, and own the narrative, they said.

Reset Rules for Fair Elections

Phill Kline, the former Kansas attorney general, led the Amistad Project’s efforts to challenge some of the Democrats rule changes. He said the the GOP legislatures in the key battlegrounds must reassert their constitutional right to set the rules of election.

Universal mail ballots can be ended, limited only to those who absolutely need it. Voter IDs can be mandated. Exemptions and legal settlements could, by law, be required to be approved by the legislature. Setting the rules of the election are easy if there is a will, Kline added.

“I think the discipline of the party should be all about de-powering Washington and empowering the states, especially the state legislatures,” Kline told Just the News.

Secondly, conservatives need to build their own information ecosystem that rivals what liberals have: a vibrant press that covers conservatives honestly, and powerful delivery channels that can rival YouTube, Twitter and Facebook.

New services like Rumble, Parler, Real America’s Voice, Citizen Free Press and CloutHub are incubating and attracting millions. They need to be grown and spread to tens of millions along with trusted news sources so conservatives have as big a bullhorn to the next generation of GenZ, millennials and cable-cutters as they have had to Boomers, talk radio and Fox News fans, the experts said.

“We are just playing to a draw,” Price explained. “We are not reaching a lot of folks. And we have to be creative about how we reach them, and I think we’ve got to be able to control a lot of that messaging, and right now we just don’t.”

Finally, conservative donors need to have a new approach, stolen from the ROI model of the Soros and Bloomberg NGOs, so their millions don’t just enrich consultants but have measurable outcomes in setting the rules and narratives that win the next elections. Everything from civic education and empowerment for state legislators to media-platform building needs to be funded, the experts said.

“Funding on the left seems much more strategic than funding on the right, which is predominantly tactical,” explained Steve Hantler, who advises several high-net-worth conservative donors. “Liberal elites have for decades controlled the levers of power in education, media and entertainment and have used that power to indoctrinate generations of Americans against America’s founding values.

“Now is not the time for for hand-wringing and finger-pointing. Now is the time for honest, critical self-evaluation.”

SCOTUS Game Over for Climate Lawsuits?

Guy Caruso writes at Real Climate Energy Supreme Court Hearing Should Signal Shift From Baseless Lawsuits to Realistic Climate Solutions  Excerpts in italics with my bolds.

For years, energy manufacturers have helped drive down U.S. carbon emissions by unleashing a flood of home-grown, low-carbon natural gas, reducing America’s carbon footprint even as we use more energy. At the same time, despite emissions reduction progress, a handful of cities and counties including Baltimore, New York City, and Washington, DC among others have sued energy manufacturers in the name of climate change, spurred on by ambitious trial attorneys and imaginative legal theories.

Federal law is clear, though, with the Supreme Court clearly ruling in American Electric Power v. Connecticut in 2011 that it’s EPA’s job to regulate carbon emissions. That’s why trial attorneys have fought so hard to move climate lawsuits to state courts and that’s why a January 19th Supreme Court hearing could be so important.

Major energy firms have asked justices to send Baltimore’s climate lawsuit to federal court, creating a potential legal precedent that could effectively sink the climate lawsuit cottage industry.

Let’s be honest. Climate lawsuits aren’t really about climate anyway. For example, while attorneys argue publicly that such lawsuits are about reducing fossil fuel use in the name of climate, their filings seek only damages, not regulation of emissions or other policies that would actually help our climate. And the so-called damages? While cities like Oakland claim billions in climate change damages in legal filings, they sing a different tune in bond offerings, with Oakland officials saying they are “unable to predict” climate change’s impact on the city. The Manufacturers’ Accountability Project examined the motivations driving these lawsuits in a recent report. The report found that University of Oregon School of Law Professor Mary Christina Wood, who is involved in advancing climate lawsuit strategies stated,

“Building sea walls and repairing roads won’t do anything to fix our global climate system, but it will drain the profits of the fossil fuel companies.”

It’s not just hypocrisy that’s the problem. Climate lawsuits are actually counterproductive when you consider that energy manufacturers have made great strides in reducing emissions, addressing climate change, and pursuing clean energy technology and innovative solutions. In fact, increased energy supplies are driving climate gains. A new Energy Information Administration report says natural gas hydraulic fracturing and competitive energy markets are to credit for reducing U.S. carbon emissions, not government regulation. A switch from coal to natural gas has accounted for more than half the nation’s emissions reductions since 2010, with energy-related carbon emissions in the U.S. dropping 2.8% last year alone. Energy supplies, not government mandates, are why the International Energy Agency has credited the U.S. for achieving the largest absolute decline in carbon emissions of any nation since 2000.

Another major driver in these climate gains? The very manufacturing sector targeted with lawsuits. American manufacturers have reduced their carbon footprint 21 percent over the past decade while their economic value has increased 18 percent. For example, ExxonMobil is cutting greenhouse gas emissions to support Paris Agreement climate change goals. In December the energy firm announced plans for aggressive reductions in emissions, notably methane, over the next five years to help meet global net zero emissions goals. Chevron is taking action to reduce GHG emissions by about 5 million metric tons per year, while ConocoPhillips, Shell, and BP all have similar plans to use ingenuity and best practices to be part of the climate solution. Working together with industry could be a major path to net zero carbon emissions by 2050. [My comment: See post Why Net Zero CO2 is Social Suicide]

Climate lawsuits are legally flimsy and impractical. These suits are infused with the inherent danger of targeting the very energy manufacturers who are active and leading participants in reducing carbon emissions to lower global temperatures. Instead of taking us farther down this counterproductive path, public officials should seek real solutions instead of more lawsuits. U.S. Supreme Court justices have an important opportunity in January to pull the plug on unhelpful climate lawsuits and allow us all to focus instead on the monumental challenges that face our planet.

Background from previous post on Frivolous Climate Lawsuits

Craig Richardson writes at Real Clear Energy The Supreme Court Is Taking Critical Step Towards Resolving Frivolous Climate Suits. Excerpts in italics with my bolds.

Sometimes the most important Supreme Court decisions are overlooked because of their technical nature. That is the case with the Supreme Court’s choice to hear jurisdictional claims in B.P. P.L.C., et al. v. Mayor and City Council of Baltimore.

The Court’s ruling will either allow cities to pursue superfluous nuisance claims against energy companies in state courts or limit the suits to federal courts that are less prone to accept broad liability claims.

These jurisdictional claims are significant because they set the appropriate scope of appellate review for these suits. Lawsuits predicated on federal laws and involving federal officers’ actions should be decided at the federal level. By agreeing to hear arguments in the Baltimore case, the Supreme Court is taking a crucial step towards setting a consistent legal playing field.

The Supreme Court will not rule on the merits of Baltimore’s claims. Instead, they will decide whether the defendants can appeal a jurisdictional claim after a federal court rejects it.

Under existing law, it is clear the defendant can appeal aspects of the decision, but not whether the whole claim is fair game. A ruling in favor of the defendants would force multiple Circuit Courts to reevaluate their previous rulings and rehear jurisdictional claims by the energy companies.

Even though the justices won’t decide on the merits, the key is the context of Baltimore’s lawsuit. For years, city and state officials have been – in partnership with trial lawyers and leftist environmental groups – twisting the meaning of public nuisance laws to sue energy companies for their alleged contributions to climate change, even though these companies aren’t breaking the law. In recent months, localities have filed even more suits, making it especially important that lower courts know whether these cases should be resolved at the federal or state level.

These suits aren’t about helping the environment but are filed by leftist politicians and their backers hoping to score political points as they desperately attempt to fill their city or state coffers.

A senior Rhode Island official said the state’s climate lawsuit was designed to create a “sustainable funding stream” for Rhode Island. The state is desperate for funding because decades of big-spending policies have left Rhode Island officials with a budget deficit approaching $160 million.

In another instance, San Mateo County filed a lawsuit claiming there was a 93% risk of deadly floods by 2050 while telling municipal investors they had nothing to worry about. The S.E.C. is now investigating the county for fraud, and it is clear its lawsuit is motivated by politics, not science.

Instead of addressing climate change or working to build a sustainable future, leftist officials are trying to profit off energy companies, which would drive up the cost for all Americans. Given the clear political undertones of these cases, and the potential devastating impact on the U.S. economy, they must receive a fair hearing in a neutral venue.

It shouldn’t be surprising that state and city officials are fighting to have the cases heard in the state courts, the most favorable jurisdictions possible for them. Local officials are confident they can find a state judge who will issue a broad ruling against the energy companies, which would be difficult to overturn on appeal, regardless of the merits.

This outcome would be a disaster for energy companies and their customers, who would have to worry about individual state judges’ whims. These judges could create a mishmash of legal rulings that ends up being totally incoherent. It is easy to imagine a scenario where the defendants prevail in most of these frivolous lawsuits but lose a few in unfriendly jurisdictions and all of us will pay the price monetarily.

Additionally, state courts shouldn’t be addressing national political issues, especially on climate change, an issue that in the past the Supreme Court ruled should be handled by Congress and the president, not state courts. If laws need to be changed, Congress should change them, instead of having individual judges legislate from the bench. Some courts have already dismissed similar climate suits for this very reason.

Allowing state courts to decide debates of global importance is a recipe for disaster.

Generally, federal courts “are far less likely, as a whole and with some exceptions, to be willing to entertain expansive theories of liability than state courts,” according to George Mason University law professor Donald Kochan. This means federal courts are unlikely to perform legal gymnastics to try and hold energy companies accountable when it is clear they are operating within the law and have permits from the government.

Why Pandemic Responses Fail

Fig. 1. The four pillars of pandemic response to COVID-19. The four pillars of pandemic response to COVID-19 are:
1) contagion control or efforts to reduce spread of SARS-CoV-2,
2) early ambulatory or home treatment of COVID-19 syndrome to reduce hospitalization and death,
3) hospitalization as a safety net to prevent death in cases that require respiratory support or other invasive therapies,
4) natural and vaccination mediated immunity that converge to provide herd immunity and ultimate cessation of the viral pandemic.

As reported in the journal Reviews in Cardiovascular Medicine, Top US medics recommend ‘sequenced multidrug therapy’ including HCQ & Ivermectin, for early high-risk COVID-19 infections (source Palmer Foundation).  Bureaucratic public health officials obsessed with top-down, high-tech solutions have failed to provide citizens with the most important pillar: advice and the means to treat themselves and take charge of their own health care.  Excerpts in italics with my bolds.

The pandemic of SARS-CoV-2 (COVID-19) is advancing unabated across the world with each country and region developing distinct epidemiologic patterns in terms of frequency, hospitalization, and death. There are four pillars to an effective pandemic response:
1) contagion control,
2) early treatment,
3) hospitalization, and
4) vaccination to assist with herd immunity (Fig. 1).

Additionally, when feasible, prophylaxis could be viewed as an additional pillar since it works to reduce the spread as well as the incidence of acute illness.

Many countries have operationalized all four pillars including the second pillar of early home-based treatment with distributed medication kits of generic medications and supplements as shown in Table 1.

In the US, Canada, United Kingdom, Western European Union, Australia, and some South American Countries there have been three major areas of focus for pandemic response:
1) containment of the spread of infection (masking, social distancing, etc.,
2) late hospitalization and delayed treatments (remdesivir, convalescent plasma, antiviral antibodies), and
3) vaccine development (Bhimraj et al., 2020; COVID-19 Treatment Guidelines, 2020).

Thus the missing pillar of pandemic response is early home-based treatment (as seen in Fig. 1).

The current three-pronged approach has missed the predominant opportunity to reduce hospitalization and death given the practice of directing patients to self-isolation at home. Early sequential multidrug therapy (SMDT) is the only currently available method by which hospitalizations and possibly death could be reduced in the short term (McCullough et al., 2020a).

Innovative SMDT regimens forCOVID-19 utilize principles learned from hospitalized patients as well as data from treated ambulatory patients.

For the ambulatory patient with recognized signs and symptoms of COVID-19 on the first day (Fig. 2), often with nasal real-time reverse transcription or oral antigen testing not yet performed, the following three therapeutic principles apply (Centers for Disease Control and Prevention, 2020) :

1) combination anti-infective therapy to attenuate viral replication,
2) corticosteroids to modulate cytokine storm, and
4) antiplatelet agent/antithrombotic therapy to prevent and manage micro- or overt vascular thrombosis.

For patients with cardinal features of the syndrome (fever, viral malaise, nasal congestion, loss of taste and smell, dry cough, etc) with pending or suspected false negative testing, therapy is the same as those with confirmed COVID-19.

Fig. 3. Sequential multidrug treatment algorithm for ambulatory acute COVID-19 like and confirmed COVID-19 illness in patients in self-quarantine. Yr = year, BMI = body mass index, Dz = disease, DM = diabetes mellitus, CVD = cardiovascular disease, chronic kidney disease, HCQ = hydroxychloroquine, IVM = ivermectin, Mgt = management, Ox = oximetry, reproduced with permission from reference.

Summary

The SARS-CoV-2 outbreak is a once in a hundred-year pandemic that has not been addressed by rapid establishment of infrastructure amenable to support the conduct of large, randomized trials in outpatients in the community setting.

The early flu-like stage of viral replication provides a therapeutic window of tremendous opportunity to potentially reduce the risk of more severe sequelae in high risk patients. Precious time is squandered with a “wait and see” approach in which there is no anti-viral treatment as the condition worsens, possibly resulting in unnecessary hospitalisation, morbidity, and death.

Once infected, the only means of preventing a hospitalization in a high-risk patient is to apply treatment before arrival of symptoms that prompt paramedic calls or emergency room visits. Given the current failure of government support for randomized clinical trials evaluating widely available, generic, inexpensive therapeutics, and the lack of instructive out-patient treatment guidelines (U.S., Canada, U.K., Western EU, Australia, some South American Countries), clinicians must act according to clinical judgement and in shared decision making with fully informed patients.

Early SMDT developed empirically based upon pathophysiology and evidence from randomized data and the treated natural history of COVID-19 has demonstrated safety and efficacy.

In newly diagnosed, high-risk, symptomatic patients with COVID-19, SMDT has a reasonable chance of therapeutic gain with an acceptable benefit-to-risk profile.

Until the pandemic closes with population-level herd immunity potentially augmented with vaccination, early ambulatory SMDT should be a standard practice in high risk and severely symptomatic acute COVID-19 patients beginning at the onset of illness.

Authors:

Peter A. McCullough, Paul E. Alexander, Robin Armstrong, Cristian Arvinte, Alan F. Bain, Richard P. Bartlett, Robert L. Berkowitz, Andrew C. Berry, Thomas J. Borody, Joseph H. Brewer, Adam M. Brufsky, Teryn Clarke, Roland Derwand, Alieta Eck, John Eck, Richard A. Eisner, George C. Fareed, Angelina Farella, Silvia N. S. Fonseca, Charles E. Geyer Jr., Russell S. Gonnering, Karladine E. Graves, Kenneth B. V. Gross, Sabine Hazan, Kristin S. Held, H. Thomas Hight, Stella Immanuel, Michael M. Jacobs, Joseph A. Ladapo, Lionel H. Lee, John Littell, Ivette Lozano, Harpal S. Mangat, Ben Marble, John E. McKinnon, Lee D. Merritt, Jane M. Orient, Ramin Oskoui, Donald C. Pompan, Brian C. Procter, Chad Prodromos, Juliana Cepelowicz Rajter, Jean-Jacques Rajter, C. Venkata S. Ram, Salete S. Rios , Harvey A. Risch, Michael J. A. Robb, Molly Rutherford, Martin Scholz, Marilyn M. Singleton, James A. Tumlin, Brian M. Tyson, Richard G. Urso, Kelly Victory, Elizabeth Lee Vliet, Craig M. Wax, Alexandre G. Wolkoff, Vicki Wooll, Vladimir Zelenko. Multifaceted highly targeted sequential multidrug treatment of early ambulatory high-risk SARS-CoV-2 infection (COVID-19). Reviews in Cardiovascular Medicine, 2020, 21(4): 517-530.


Arctic Ice Year-End 2020

At  the bottom is a discussion of statistics on year-end Arctic Sea Ice extents.  The values are averages of the last five days of each year.  End of December is a neutral point in the melting-freezing cycle, midway between September minimum and March maximum extents.

Background from Previous Post Updated to Year-End

Some years ago reading a thread on global warming at WUWT, I was struck by one person’s comment: “I’m an actuary with limited knowledge of climate metrics, but it seems to me if you want to understand temperature changes, you should analyze the changes, not the temperatures.” That rang bells for me, and I applied that insight in a series of Temperature Trend Analysis studies of surface station temperature records. Those posts are available under this heading. Climate Compilation Part I Temperatures

This post seeks to understand Arctic Sea Ice fluctuations using a similar approach: Focusing on the rates of extent changes rather than the usual study of the ice extents themselves. Fortunately, Sea Ice Index (SII) from NOAA provides a suitable dataset for this project. As many know, SII relies on satellite passive microwave sensors to produce charts of Arctic Ice extents going back to 1979.  The current Version 3 has become more closely aligned with MASIE, the modern form of Naval ice charting in support of Arctic navigation. The SII User Guide is here.

There are statistical analyses available, and the one of interest (table below) is called Sea Ice Index Rates of Change (here). As indicated by the title, this spreadsheet consists not of monthly extents, but changes of extents from the previous month. Specifically, a monthly value is calculated by subtracting the average of the last five days of the previous month from this month’s average of final five days. So the value presents the amount of ice gained or lost during the present month.

These monthly rates of change have been compiled into a baseline for the period 1980 to 2010, which shows the fluctuations of Arctic ice extents over the course of a calendar year. Below is a graph of those averages of monthly changes during the baseline period. Those familiar with Arctic Ice studies will not be surprised at the sine wave form. December end is a relatively neutral point in the cycle, midway between the September Minimum and March Maximum.

The graph makes evident the six spring/summer months of melting and the six autumn/winter months of freezing.  Note that June-August produce the bulk of losses, while October-December show the bulk of gains. Also the peak and valley months of March and September show very little change in extent from beginning to end.

The table of monthly data reveals the variability of ice extents over the last 4 decades.

The values in January show changes from the end of the previous December, and by summing twelve consecutive months we can calculate an annual rate of change for the years 1979 to 2019.

As many know, there has been a decline of Arctic ice extent over these 40 years, averaging 40k km2 per year. But year over year, the changes shift constantly between gains and losses.

Moreover, it seems random as to which months are determinative for a given year. For example, much ado has been printed about October 2020 being slower than expected to refreeze and add ice extents. As it happens in this dataset, October has the highest rate of adding ice. The table below shows the variety of monthly rates in the record as anomalies from the 1980-2010 baseline. In this exhibit a red cell is a negative anomaly (less than baseline for that month) and blue is positive (higher than baseline).

Note that the  +/ –  rate anomalies are distributed all across the grid, sequences of different months in different years, with gains and losses offsetting one another.  Yes, October 2020 recorded a lower than average gain, but higher than 2016. The loss in July 2020 was the largest of the year, during the hot Siberian summer.  Note November 2020 ice gain anomaly exceeded the October deficit anomaly by more than twice as much.  December added more surplus so that the anomaly for the year was nothing. The bottom line presents the average anomalies for each month over the period 1979-2020.  Note the rates of gains and losses mostly offset, and the average of all months in the bottom right cell is virtually zero.

A final observation: The graph below shows the Yearend Arctic Ice Extents for the last 30 years.

Note: SII daily extents file does not provide complete values prior to 1988.

Year-end Arctic ice extents (last 5 days of December) show three distinct regimes: 1989-1998, 1998-2010, 2010-2019. The average year-end extent 1989-2010 is 13.4M km2. In the last decade, 2009 was 13.0M km2, and ten years later, 2019 was 12.8M km2. So for all the the fluctuations, the net loss was 200k km2, or 1.5%. Talk of an Arctic ice death spiral is fanciful.

These data show a noisy, highly variable natural phenomenon. Clearly, unpredictable factors are in play, principally water structure and circulation, atmospheric circulation regimes, and also incursions and storms. And in the longer view, today’s extents are not unusual.


Illustration by Eleanor Lutz shows Earth’s seasonal climate changes. If played in full screen, the four corners present views from top, bottom and sides. It is a visual representation of scientific datasets measuring Arctic ice extents.


Ocean Temps Plunging Nov. 2020


The best context for understanding decadal temperature changes comes from the world’s sea surface temperatures (SST), for several reasons:

  • The ocean covers 71% of the globe and drives average temperatures;
  • SSTs have a constant water content, (unlike air temperatures), so give a better reading of heat content variations;
  • A major El Nino was the dominant climate feature in recent years.

HadSST is generally regarded as the best of the global SST data sets, and so the temperature story here comes from that source, the latest version being HadSST3.  More on what distinguishes HadSST3 from other SST products at the end.

The Current Context

The chart below shows SST monthly anomalies as reported in HadSST3 starting in 2015 through November 2020. After three straight Spring months of cooling led by the tropics and SH, NH spiked in the summer.  Now temps everywhere are dropping the last three months, with SH the lowest in this period, and Global anomalies below average since 2015.

A global cooling pattern is seen clearly in the Tropics since its peak in 2016, joined by NH and SH cycling downward since 2016.  In 2019 all regions had been converging to reach nearly the same value in April.

Then  NH rose exceptionally by almost 0.5C over the four summer months, in August 2019 exceeding previous summer peaks in NH since 2015.  In the 4 succeeding months, that warm NH pulse reversed sharply. Then again NH temps warmed to a 2020 summer peak, matching 2019.  This has now been reversed with SH and Tropics pulling the Global anomaly downward sharply.

Note that higher temps in 2015 and 2016 were first of all due to a sharp rise in Tropical SST, beginning in March 2015, peaking in January 2016, and steadily declining back below its beginning level. Secondly, the Northern Hemisphere added three bumps on the shoulders of Tropical warming, with peaks in August of each year.  A fourth NH bump was lower and peaked in September 2018.  As noted above, a fifth peak in August 2019 and a sixth August 2020 exceeded the four previous upward bumps in NH.

And as before, note that the global release of heat was not dramatic, due to the Southern Hemisphere offsetting the Northern one.  The major difference between now and 2015-2016 is the absence of Tropical warming driving the SSTs, along with SH anomalies reaching nearly the lowest in this period. Presently both SH and the Tropics are quite cool, with NH coming off its summer peak.  Note the tropical temps descending into La Nina levels.

A longer view of SSTs

The graph below  is noisy, but the density is needed to see the seasonal patterns in the oceanic fluctuations.  Previous posts focused on the rise and fall of the last El Nino starting in 2015.  This post adds a longer view, encompassing the significant 1998 El Nino and since.  The color schemes are retained for Global, Tropics, NH and SH anomalies.  Despite the longer time frame, I have kept the monthly data (rather than yearly averages) because of interesting shifts between January and July.

1995 is a reasonable (ENSO neutral) starting point prior to the first El Nino.  The sharp Tropical rise peaking in 1998 is dominant in the record, starting Jan. ’97 to pull up SSTs uniformly before returning to the same level Jan. ’99.  For the next 2 years, the Tropics stayed down, and the world’s oceans held steady around 0.2C above 1961 to 1990 average.

Then comes a steady rise over two years to a lesser peak Jan. 2003, but again uniformly pulling all oceans up around 0.4C.  Something changes at this point, with more hemispheric divergence than before. Over the 4 years until Jan 2007, the Tropics go through ups and downs, NH a series of ups and SH mostly downs.  As a result the Global average fluctuates around that same 0.4C, which also turns out to be the average for the entire record since 1995.

2007 stands out with a sharp drop in temperatures so that Jan.08 matches the low in Jan. ’99, but starting from a lower high. The oceans all decline as well, until temps build peaking in 2010.

Now again a different pattern appears.  The Tropics cool sharply to Jan 11, then rise steadily for 4 years to Jan 15, at which point the most recent major El Nino takes off.  But this time in contrast to ’97-’99, the Northern Hemisphere produces peaks every summer pulling up the Global average.  In fact, these NH peaks appear every July starting in 2003, growing stronger to produce 3 massive highs in 2014, 15 and 16.  NH July 2017 was only slightly lower, and a fifth NH peak still lower in Sept. 2018.

The highest summer NH peak came in 2019, only this time the Tropics and SH are offsetting rather adding to the warming. Since 2014 SH has played a moderating role, offsetting the NH warming pulses. Now September 2020 is dropping off last summer’s unusually high NH SSTs. (Note: these are high anomalies on top of the highest absolute temps in the NH.)

What to make of all this? The patterns suggest that in addition to El Ninos in the Pacific driving the Tropic SSTs, something else is going on in the NH.  The obvious culprit is the North Atlantic, since I have seen this sort of pulsing before.  After reading some papers by David Dilley, I confirmed his observation of Atlantic pulses into the Arctic every 8 to 10 years.

But the peaks coming nearly every summer in HadSST require a different picture.  Let’s look at August, the hottest month in the North Atlantic from the Kaplan dataset.
The AMO Index is from from Kaplan SST v2, the unaltered and not detrended dataset. By definition, the data are monthly average SSTs interpolated to a 5×5 grid over the North Atlantic basically 0 to 70N. The graph shows August warming began after 1992 up to 1998, with a series of matching years since, including 2020.  Because the N. Atlantic has partnered with the Pacific ENSO recently, let’s take a closer look at some AMO years in the last 2 decades.

This graph shows monthly AMO temps for some important years. The Peak years were 1998, 2010 and 2016, with the latter emphasized as the most recent. The other years show lesser warming, with 2007 emphasized as the coolest in the last 20 years. Note the red 2018 line is at the bottom of all these tracks. The black line shows that 2020 began slightly warm, then set records for 3 months. then dropped below 2016 and 2017, peaked in August and is now below 2016.

Summary

The oceans are driving the warming this century.  SSTs took a step up with the 1998 El Nino and have stayed there with help from the North Atlantic, and more recently the Pacific northern “Blob.”  The ocean surfaces are releasing a lot of energy, warming the air, but eventually will have a cooling effect.  The decline after 1937 was rapid by comparison, so one wonders: How long can the oceans keep this up? If the pattern of recent years continues, NH SST anomalies may rise slightly in coming months, but once again, ENSO which has weakened will probably determine the outcome.

Footnote: Why Rely on HadSST3

HadSST3 is distinguished from other SST products because HadCRU (Hadley Climatic Research Unit) does not engage in SST interpolation, i.e. infilling estimated anomalies into grid cells lacking sufficient sampling in a given month. From reading the documentation and from queries to Met Office, this is their procedure.

HadSST3 imports data from gridcells containing ocean, excluding land cells. From past records, they have calculated daily and monthly average readings for each grid cell for the period 1961 to 1990. Those temperatures form the baseline from which anomalies are calculated.

In a given month, each gridcell with sufficient sampling is averaged for the month and then the baseline value for that cell and that month is subtracted, resulting in the monthly anomaly for that cell. All cells with monthly anomalies are averaged to produce global, hemispheric and tropical anomalies for the month, based on the cells in those locations. For example, Tropics averages include ocean grid cells lying between latitudes 20N and 20S.

Gridcells lacking sufficient sampling that month are left out of the averaging, and the uncertainty from such missing data is estimated. IMO that is more reasonable than inventing data to infill. And it seems that the Global Drifter Array displayed in the top image is providing more uniform coverage of the oceans than in the past.

uss-pearl-harbor-deploys-global-drifter-buoys-in-pacific-ocean

USS Pearl Harbor deploys Global Drifter Buoys in Pacific Ocean