EPA Plans for a Bright Environmental Future

EPA Administrator Andrew Wheeler delivered an address laying out the agency vision for fulfilling its mission.  Excerpts in italics with my formatting and bolds.

EPA’s mission has been straight forward since its founding. Protect human health and the environment. Doing this ensures that all Americans – regardless of their zip code – have clean air to breathe, clean water to drink, and clean land to live, work, and play upon. Under President Trump, we have done this as well, if not better, than any recent administration.  This is great news, and like most great news, you rarely read about it in the press.

  • During the first three years of the Trump Administration, air pollution in this country fell 7 percent.
  • Last year, EPA delisted 27 Superfund sites, the most in a single year since 2001.
  • And agency programs have contributed more than $40 billion dollars to clean water infrastructure investment during President Trump’s first term.

For much of the latter part of the 20th century, there was bipartisan understanding on what environmental protection meant. Some of it was captured in legislation and some it by established practice. These principles formed a consensus about how the federal government did its job of protecting the environment.

But unfortunately, in the past decade or so, some members of former administrations and progressives in Congress have elevated single issue advocacy – in many cases focused just on climate change – to virtue-signal to foreign capitals, over the interests of communities within their own country. Communities deserve better than this, but in the recent past, EPA has forgotten important parts of its mission. It’s my belief that we misdirect a lot of resources that could be better used to help communities across this country.

So, if this is where we are – with misdirected policies, misused resources, and a more partisan political environment – and we want an EPA for the next 50 years – how do we get there? One way to do this – and I’ve spent more than 25 years thinking about this problem – is to focus on helping communities become healthier in a more comprehensive manner.

Communities that deal with the worst pollution in this country – and tend to be low-income and minority – face multiple environmental problems that need solving.  Many of the sites EPA has responsibility for are in some of the most disadvantaged communities in this country. And I will point out a truism. Neglect is a form of harm, and it’s not fair for these communities to be abandoned just because they don’t have enough political power to stop the neglect.

So where does this put us as a country in 2020? The truth is this country is facing a lot of environmental and social problems that have not been dealt with the right way up until now. And while the focus of the next 50 years should not be like the last 50, it should be informed by it.

Many towns and cities in the United States are using the same water infrastructure they’ve used for over 100 years, and many schools use lead water pipes long after such pipes were banned from new buildings. The American public views our pesticide program through the lens of the trial lawyers who advertise on television instead of the way we manage the program. And the Superfund Program – which celebrates its 40th anniversary this year, has become focused on process, rather than project completion.

These issues are challenging and would be difficult for any administration in office. But they would be easier to solve if people in power were more aware of the consequences of poor environmental policies.

It’s very disappointing to see governors on the East Coast, such as Governor Cuomo, unilaterally block pipelines that would take natural gas from Pennsylvania to New York and New England. These poor choices subject Americans to imports of gas from places like Russia, even in the face of evidence that U.S. natural gas has a much cleaner emissions profile than imported gas from Europe. Governor Cuomo is doing this in the name of climate change, but the carbon footprint of natural gas to New England through pipeline is much smaller than transporting it across the ocean. It also forces citizens in Vermont, New Hampshire and Maine to use more polluting wood and heating oil to heat their homes because of gas shortages in the winter months, which in turn creates very poor local air quality.

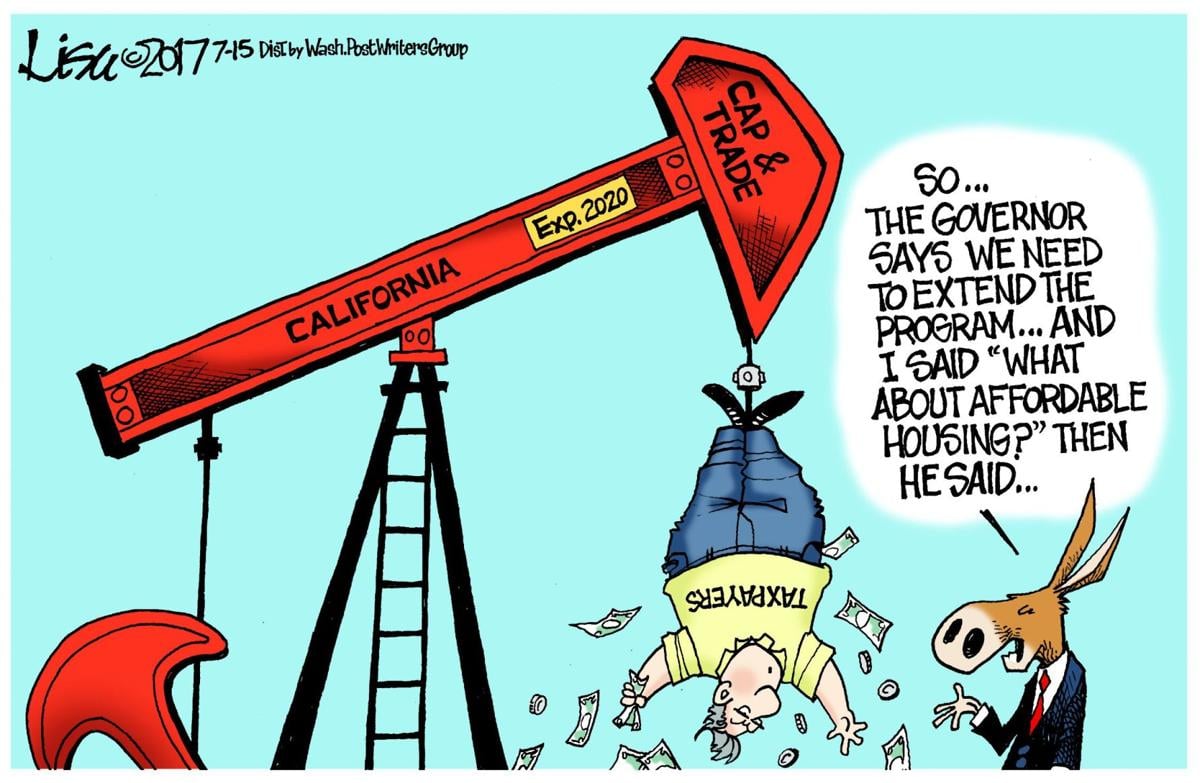
And there are many examples of poor environmental outcomes here in California, despite its environmental reputation. It should go without saying that dumping sewage into San Francisco Bay without disinfection, indeed without any chemical or biological treatment, is a bad idea, but that’s what been happening for many years, against federal law.

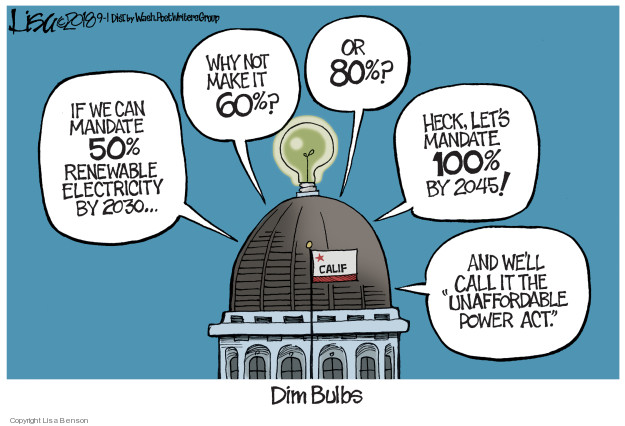
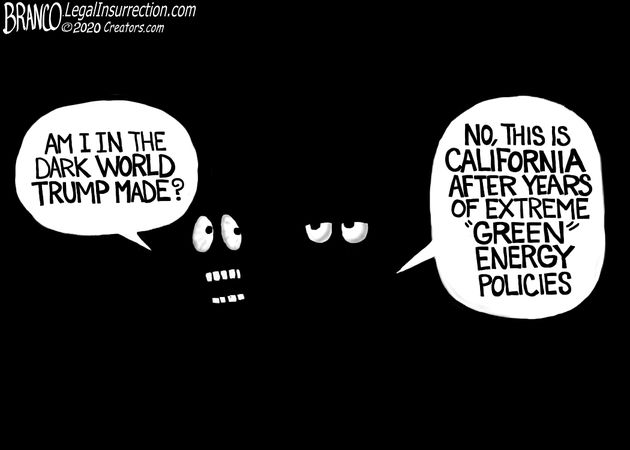
And just last month, the rolling blackouts created by California’s latest electricity crisis – the result of policies against power plants being fueled by natural gas – spilled 50,000 gallons of raw sewage into the Oakland Estuary when back-up wastewater pumps failed. As state policymakers push more renewables onto the grid at times of the day when renewables aren’t available, these environmental accidents will happen more often. CARB seems to have no appreciation for baseload power generation. Or at least their regulations don’t.

Instead of confusing words with actions, and choosing empty symbolism over doing a good job, we can focus our attention and resources on helping communities help themselves. Doing this will strengthen this country from its foundation up – and start to solve the environmental problems of tomorrow. We could do a lot of good if the federal government, through Congress, puts resources to work with a fierce focus on community-driven environmentalism that promotes community revitalization on a greater scale.

This will do more for environmental justice than all the rhetoric in political campaigns.

Over the next four years the Trump Administration is going to reorganize how it approaches communities so it can take action and address the range of environmental issues that need to be addressed for people and places in need. In President Trump’s second term, we will help communities across this country take control and reshape themselves through the following five priorities.

  • Creating a Community-Driven Environmentalism that Promotes Community Revitalization.
  • Meeting the 21st Century Demands for Water.
  • Reimagining Superfund as a Project-Oriented Program.
  • Reforming the Permitting Process to Empower States. And,
  • Creating a Holistic Pesticide Program for the Future.

For communities, traditionally, EPA has focused on environmental issues in a siloed manner that only looks at air, water and land separately, and states and local communities end up doing the same. We will change this, and look at Brownfields grants, environmental justice issues, and air quality in each community at the same time and encourage them to do the same.

Since EPA’s Brownfields Program began in 1995, nearly $1.6 billion dollars in grants have been spent to clean-up contaminated sites and return blighted properties to productive reuse. To date, communities participating in the Program have been able to attract an additional $33.3 billion dollars in cleanup and redevelopment funding after receiving Brownfields funds.

And when combined with the Opportunity Zones created in the landmark 2017 Trump tax bill, economic development, job creation and environmental improvements can truly operate together at the same time. A study published last month found that Opportunity Zones, which have only been in existence since 2018, have attracted about $75 billion dollars in private investment, which in turn has lifted about one million people out of poverty through job creation in a very short time. While all the economic data isn’t available yet for 2019, it’s possible that Opportunity Zones are one of the biggest reasons black unemployment in this country fell to its lowest recorded levels ever in 2019.

One other way we are going to help communities is by creating one consolidated grant program that combines several smaller grants from multiple programs. It will help focus local communities to view environmental problems holistically, and it will help refocus EPA.

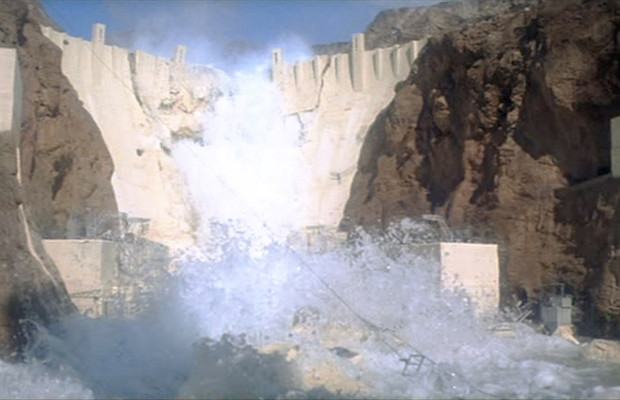
We can meet the 21st Century Demands for Clean Water by creating an integrated planning approach using WIFIA loans, our Water Reuse Action Plan, and our Nutrient Trading Initiative to improve water quality and modernize legal frameworks that have been around since the 19th Century. Over 40 percent of water utility workers are eligible to retire. We need to do a better job recruiting and training for 21st century threats to the water utilities industry.

And we can reinvigorate the Superfund Program. Roughly 16 percent of the U.S. population lives within 3 miles of a Superfund site today. That’s over 50 million Americans. EPA has allowed litigation and bureaucracy to dictate the pace of Superfund projects, instead of focusing on improving the environmental indicators and moving sites to completion. We need to fully implement the recommendations of the 2018 Superfund Task Force and reimagine the approach to clean up sites using the latest technologies and best practices.

We can improve the way we handle pesticide regulation. We do a good job approving pesticides on an individual basis, but we have not excelled in explaining to the public our holistic approach to pesticide management. The media and the courts tend to view our individual pesticide decisions in a one-off fashion, which has left the American public uninformed on our science-based process.

We will take into account biotech advances and better examinations of new active ingredients. Just this week, we announced a proposed rule that would remove onerous and expensive regulation of gene-edited plant protectants. We will safeguard pollinators to support the agriculture industry. And we can decrease reliance on animal testing to a point where no animal testing takes place for any of the agency’s programs by 2035.

Here are five things EPA is doing – five new pillars that have gone largely unnoticed by the public – that are changing the way the agency operates today.

The first pillar is our Cost-Benefit Rulemaking.
We are creating cost-benefit rules for every statute that governs EPA. The American public deserves to know what the costs and the benefits are for each of our rules. We are starting with the Clean Air Act, which will provide much better clarity to local communities, industry and stakeholders. And we will implement a cost-benefit regulation for all our environmental statutes by 2022.

Our second major pillar is Science Transparency.

The American public has a right to know the scientific justification behind a regulation. We are creating science transparency rules that are applied consistently. This will bring much needed sunlight into our regulatory process. Some people oppose it, calling it a Secret Science rule. Those who oppose it want regulatory decisions to be made behind closed doors. They are the people who say, “Trust us, we know what’s best for you.” I want to bring our environmental decision-making process out of the proverbial smoke-filled back room. The Cost-Benefit and Science Transparency rules will go a long way in delivering that. After finalizing the Science Transparency rule later this year, EPA will conduct a statute by statue rulemaking, much like the Cost-Benefit rule.

Guidance documents are the third pillar of agency change, and it’s an area we’ve made a lot of progress, and we have shined even more light.

The agency for years was criticized for not making guidance documents – which have almost the force of law – available for public review. The costs involved to uncover guidance documents became a major barrier for anyone wanting to improve their communities. Last year, EPA went through all our guidance documents from the agency’s beginnings, and we put all 10,000 documents onto a searchable database. We also rescinded 1,000 guidance documents. Now all our guidance documents are available to the public, for the first time. This is a huge change in administrative procedures at EPA, perhaps the biggest change in at least a generation.

The fourth pillar is our reorganization of all 10 of our regional offices to mirror our headquarters structure.

All the regional offices across the country now have an air division, a water division, a lands division, and a chemical division. This was a change that was needed for decades.

As the fifth pillar of EPA fundamental change, we have implemented a Lean Management System that tracks real metrics with which the agency can measure success or failure.

There is a lot of good news in these changes, but the best news is this: the problems I’ve highlighted are structural, and when a problem is structural or organizational, an agency can be changed. Until the Trump administration, EPA was not able to track how long it took to complete a permit, a grant process, or a state implementation plan, or really any meaningful task the agency had before it. Organizations do change; it can be hard, but they do change, and when they change, it’s usually for the better.

Conclusion:
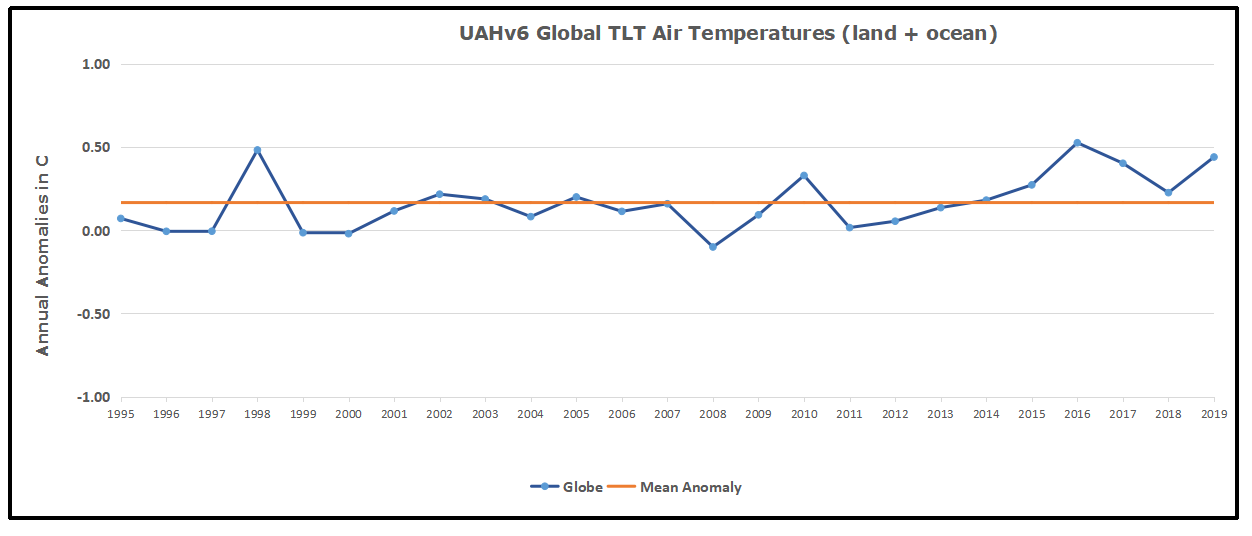
As I said at the beginning, EPA data points to 2020 air quality being the best on record. Here in California, where the modern environmental movement began – and from where President Nixon brought it to the rest of the country – it’s important to acknowledge the role states have in being laboratories for democracy, and in this case, laboratories for environmental policy.

But for environmental policy to work nationally, the federal government and states must work together as partners, not as adversaries. To do this involves a new vision, and for a country searching for a new consensus, on the environment as well as on many other things, this can seem tough. But I believe we can find a new consensus, if we strive to.

I believe that by focusing EPA toward communities in the coming years, our agency can change the future for people living in this country who have been left behind simply for living in polluted places. We are a nation made up of communities, and communities are the foundation of this nation, not the other way around.

If we can do the work before us – break down the silos between us as an agency and elsewhere – I believe we can both protect the places we love and bring back the places that have been hurt by pollution – and make them even better than they were before.

I see EPA beginning its second half century with big challenges, but ones that can be overcome with the same skill and tenacity that helped this agency, and this country, overcome the challenges of the last 50 years.  I hope everyone can support our agency as we work to deliver this vision of a great environmental future for all Americans – regardless of where they live.

Thank you.”

August Land and Ocean Air Temps Stay Cool

banner-blog
With apologies to Paul Revere, this post is on the lookout for cooler weather with an eye on both the Land and the Sea.  UAH has updated their tlt (temperatures in lower troposphere) dataset for August 2020.  Previously I have done posts on their reading of ocean air temps as a prelude to updated records from HADSST3. This month also has a separate graph of land air temps because the comparisons and contrasts are interesting as we contemplate possible cooling in coming months and years.

Presently sea surface temperatures (SST) are the best available indicator of heat content gained or lost from earth’s climate system.  Enthalpy is the thermodynamic term for total heat content in a system, and humidity differences in air parcels affect enthalpy.  Measuring water temperature directly avoids distorted impressions from air measurements.  In addition, ocean covers 71% of the planet surface and thus dominates surface temperature estimates.  Eventually we will likely have reliable means of recording water temperatures at depth.

Recently, Dr. Ole Humlum reported from his research that air temperatures lag 2-3 months behind changes in SST.  He also observed that changes in CO2 atmospheric concentrations lag behind SST by 11-12 months.  This latter point is addressed in a previous post Who to Blame for Rising CO2?

HadSST3 results were delayed with February and March updates only appearing together end of April.  For comparison we can look at lower troposphere temperatures (TLT) from UAHv6 which are now posted for August. The temperature record is derived from microwave sounding units (MSU) on board satellites like the one pictured above.

The UAH dataset includes temperature results for air above the oceans, and thus should be most comparable to the SSTs. There is the additional feature that ocean air temps avoid Urban Heat Islands (UHI). In 2015 there was a change in UAH processing of satellite drift corrections, including dropping one platform which can no longer be corrected. The graphs below are taken from the latest and current dataset, Version 6.0.

The graph above shows monthly anomalies for ocean temps since January 2015. After all regions peaked with the El Nino in early 2016, the ocean air temps dropped back down with all regions showing the same low anomaly August 2018.  Then a warming phase ensued with NH and Tropics spikes in February and May 2020. As was the case in 2015-16, the warming was driven by the Tropics and NH, with SH lagging behind. Since the peak in January 2020, all ocean regions have trended downward in a sawtooth pattern, returning to a neutral anomaly in June, close to the 0.4C average for the period. July and August are little changed with NH and SH offsetting slight bumps.

Land Air Temperatures Showing Volatility

We sometimes overlook that in climate temperature records, while the oceans are measured directly with SSTs, land temps are measured only indirectly.  The land temperature records at surface stations sample air temps at 2 meters above ground.  UAH gives tlt anomalies for air over land separately from ocean air temps.  The graph updated for August 2020 is below.


Here we see the noisy evidence of the greater volatility of the Land temperatures, along with extraordinary departures, first by NH land with SH often offsetting.   The overall pattern is similar to the ocean air temps, but obviously driven by NH with its greater amount of land surface. The Tropics synchronized with NH for the 2016 event, but otherwise follow a contrary rhythm.  SH seems to vary wildly, especially in recent months.  Note the extremely high anomaly last November, cold in March 2020, and then again a spike in April. In June 2020, all land regions converged, erasing the earlier spikes in NH and SH, and showing anomalies comparable to the 0.5C average land anomaly this period.

After an upward bump In July SH, land air temps in August returned to the same flat result from the prior month.

The longer term picture from UAH is a return to the mean for the period starting with 1995.  2019 average rose and caused 2020 to start warmly, but currently lacks any El Nino or NH warm blob to sustain it.

These charts demonstrate that underneath the averages, warming and cooling is diverse and constantly changing, contrary to the notion of a global climate that can be fixed at some favorable temperature.

TLTs include mixing above the oceans and probably some influence from nearby more volatile land temps.  Clearly NH and Global land temps have been dropping in a seesaw pattern, NH in July more than 1C lower than the 2016 peak.  TLT measures started the recent cooling later than SSTs from HadSST3, but are now showing the same pattern.  It seems obvious that despite the three El Ninos, their warming has not persisted, and without them it would probably have cooled since 1995.  Of course, the future has not yet been written.

ESG Investing Fails Both Activists and Pensioners

Robert Armstrong wrote at the Financial Times The Dubious Appeal Of ESG Investing Is For Dupes Only.  Excerpts in italics with my bolds.

Environmental, social and governance investing is ascendant. Its mirror image, stakeholder capitalism, is now the standard mantra on boards and in executive suites. This is not cause for celebration.

Both rest on weak conceptual foundations and should be viewed suspiciously by investors who seek adequate returns, and by citizens who want real rather than cosmetic change.

The business and financial establishments endorse the new consensus. BlackRock, the world’s largest asset manager, released an open letter warning companies that it would “be increasingly disposed” to vote against boards moving too slowly on sustainability. The World Economic Forum in Davos says that companies exist to create value not just for shareholders but “employees, customers, suppliers, local communities and society”. A letter from the Business Roundtable, signed by prominent chief executives, promised to “commit to deliver value to all” stakeholders.

Investors have responded. In the first half of 2020, net inflows into ESG funds hit $21bn, according to Morningstar, almost matching last year’s record total.

But behind ESG and stakeholderism lies a dangerous idea: that shareholders’ economic interests and the social good always harmonise over the long run.

It is true that when companies subordinate everything to maximisation of shareholder value, it backfires. When IBM, a company that long prioritised technological excellence, shifted its focus in 2012 to a target of hitting $20 in earnings per share a few years later, it was the beginning of the end for both IBM’s industry leadership and its rising share price. General Electric has never recovered from its decision to chase “easy” profits by turning into a finance company in the 1990s. The list goes on.  So ESG supporters are right that companies cannot always maximise long-term profit by aiming to do so.

They have to shoot instead to deliver excellent products, which creates profit as a side effect.

In many cases, excellence creates good stakeholder outcomes too, from investment in employees to lower carbon emissions. But this does not mean shareholder returns and the social good can always align. And there is one important way in which the two must come apart.

Part of the justification for ESG investing is that divesting from certain industries (fossil fuels or tobacco, say) creates economic pressure for change, in the way that boycotting a company’s products might. Divestment increases a company’s cost of capital: when fewer investors line up to buy its shares or bonds, it must sell them for less. This makes it more expensive for it to invest in socially destructive projects.

The necessary corollary? ESG-friendly companies’ cost of capital goes down, as dollars are channelled their way instead. Their shares and bonds become more expensive, meaning lower returns. If ESG investors’ returns are not lower, their choices have not affected corporate incentives.

Given that this is so, many ESG advocates take a different tack. They argue that the point is not to change corporate incentives but to invest in companies that will thrive financially precisely because they take ESG seriously.

There may be a distant and ideal future when this will be achieved. But even the best corporate leaders cannot look out to the end of days. They make choices about what they can foresee with a degree of confidence. At that range, it is obvious that shareholders’ and stakeholders’ interests can conflict. If they did not, there would be far fewer lay-offs announced and far fewer oil wells drilled. If stakeholder capitalism means anything, it is that corporate leaders must sometimes make choices that benefit stakeholders at the cost of shareholders.

The financial mandarins’ manifestos ignore such trade-offs, and say nothing about how they might be managed. They merely repeat that, in BlackRock’s phrase, social purpose “is the engine of long-term profitability”.

If corporate leaders are silent it is because they know how they will choose when such conflicts arise. They are paid in stock, and if monetary incentives are not enough, there are legal ones. Most US companies are incorporated in states where the law requires them to put shareholders first. Promises of virtue do not change this. As Aneesh Raghunandan and Shivaram Rajgopal of Columbia Business School point out, corporate signatories to the Business Roundtable letter have worse ESG records than industry peers.

Is the answer, then, a top-to-bottom change in executive pay packages, and indeed corporate law? No. Rewriting the internal rules of corporate capitalism would put at risk a system that has served us well in its remit: to create wealth. At the same time, do we want more of the power and responsibility for solving our most pressing problems, from inequality to climate change, to be pressed into the hands of corporations, which will still be run and owned by the richest among us? No again.

Shareholder capitalism is an excellent way to manage our corporate economy and we should stick with it.

We also have a very good, if presently neglected, set of tools to ensure that everyone shares in the fruits of economic progress. They are democratic action and the rule of law, which allow us to, for example, set minimum wages, tax carbon emissions and change campaign finance laws. Let’s use the right tools for the right purposes.

Anti-fossil fuel activists storm the bastion of Exxon Mobil, here seen without their shareholder disguises.

Dr. Fauci’s Hydroxychloroquine Denial

The commentary comes from Mikko Paunio’s article Dr. Fauci’s Hydroxychloroquine Denial.  Excerpts in italics with my bolds.

As an epidemiologist, I believe that America has been profoundly ill-served by the contribution of its public health authorities to the debate on the efficacy of treating vulnerable COVID-19 patients with hydroxychloroquine (HCQ). It is a debate with a direct link to whether America’s schools should reopen next month. Even those who reject the World Health Organization’s misleading comparison of COVID-19 with the horrendous 1918 Spanish flu pandemic and its presumption that humans lack any immunity against SARS-CoV-2 would welcome improvements in our ability to treat patients with COVID-19, in order to reduce the risk in reopening schools.

Distinguished Yale epidemiologist Harvey Risch has written extensively on the meticulous research demonstrating the efficacy of the early administration of HCQ in combination with the antibiotic azithromycin and zinc. Conclusions from this research are based on criteria developed by British epidemiologist Sir Bradford Hill and Sir Richard Doll, two of the first scientists to discover the causal link between tobacco smoking and lung cancer, criteria that laid the foundations of modern epidemiology and that are used to this day to determine whether an observed association can be ascribed to causation.  

Far from exploring this potential breakthrough in the treatment of COVID-19, the National Institutes of Health and the Food and Drug Administration (FDA) were both dismissive, condemning early outpatient treatment with the HCQ triple therapy as ineffective and dangerous. Instead, these agencies state that the only permissible way to determine its efficacy and safety is with randomized clinical trials (RCTs). Virologist Steven Hatfill has described a circle of self-reinforcing media commentary based on flawed, fraudulent, and withdrawn studies and the FDA’s mistaken decision to withdraw its HCQ Emergency Use Authorization, costing thousands of American lives.  See The Real HCQ Story: What We Now Know

Demanding proof when time is short and when there is highly suggestive observational evidence has been condemned by Drs. George Fareed, Michael Jacobs, and Donald Pompan in an open letter to Dr. Fauci. They point out that the FDA has approved many drugs without RCTspenicillin was so efficacious in treating pneumonia that there was no need for RCTs. Moreover, RCTs are not designed to test the efficacy of a therapy in high-risk outpatient settings before a patient is notified of the results of a test for COVID-19. It cannot be ethical for public health bodies to demand impossible standards of proof for potential lifesaving therapies.

To require an RCT for the HCQ triple therapy is indeed unethical; evidence supporting its use comes from large patient series, controlled trials, and even a natural experiment in the Brazilian state of Pará. In assessing ongoing patient outcomes, keep in mind that observations might be affected should the SARS-CoV-2 virus lose virulence. Spanish authorities report that fatality rates have fallen, even among elderly patients, which would be consistent with reduced SARS-CoV-2 virulence. This, too, should be considered by public authorities in assessing the risks associated with reopening schools.  See Death toll mounts as FDA denies HCQ for outpatient therapy

Yet rather than engage in proper debate, Dr. Fauci has resorted to name-calling. “The pushback has been furious,” Risch writes. Dr. Fauci “has implied that I am incompetent, notwithstanding my hundreds of highly regarded, methodologically relevant publications in peer-reviewed scientific literature.” Dr. Fauci’s position calls to mind that of English statistician Ronald A. Fisher, who in the 1950s vehemently argued against Hill and Doll and their finding that smoking causes lung cancer, on very similar grounds to those used by Dr. Fauci to dispute the efficacy of HCQ—that observational data cannot prove causality. This is an extraordinary position for America’s leading health official to adopt; by the same logic, Dr. Fauci would deny the evidence that tobacco smoking kills.  See  Hydroxychloroquine: A Morality Tale

Dr. Fauci has also waded into the debate on reopening schools, arguing that they should remain closed where the virus is circulating. While the effect of reopening schools on community transmission is uncertain, we know that keeping them closed harms children, especially those in poorer communities. This should not be a matter of politics, left or right. In Britain, chief medical officers have issued a statement on the benefits of school to children and the “exceptionally small risk” of children dying from COVID-19. In my country, Finland, Prime Minister Sanna Marin, a left-of-center Social Democrat, decided in May that Finnish children should return to school, despite opposition from the teachers’ union.

It would be a needless calamity for America’s schools not to reopen at the start of the new school year—and a calamity not to protect the vulnerable with the most efficacious therapies we have.

Clinical evidence strongly supports the use of the HCQ triple therapy at an early stage for the elderly and those with comorbidities. I earnestly hope that Dr. Fauci reconsiders his opposition to HCQ and restores his hitherto considerable reputation.  See HCQ Proven First Responder to SARS CV2

Dr. Mikko Paunio, an epidemiologist, has held positions at the University of Helsinki, Johns Hopkins Bloomberg School of Public Health, the European Commission, the World Bank, and the Ministry of Social Affairs and Health in Finland.

Footnote:  Excerpt below from COVID-19, Orwell, and the media by Samar Razaq writing at the British Journal of General Practice.

The power of the numbers was immense; a nation paralysed despite being unable to put the numbers into any context. Telling patients that on average 10 000 people die every week in the UK2 (approximately 1500 every day) had little impact on them. The incessant 24-hour media coverage had everyone spooked by an invisible enemy, much like the Eurasian army that had spooked the inhabitants of London in Orwell’s novel.

As a degree of normality has begun to be restored, thanks to the persistently low prevalence levels of COVID-19, mundane chats with my patients often end up discussing the ‘second wave’. There seems to be a general preparedness among everyone for the ‘inevitable second wave’. Reading and hearing about the second wave often reminds me of Orwell’s masterful creation. There is a general agreement that there is no scientific consensus on what a second wave actually is; yet it is on the tongue of every doctor and patient I speak to. At what point does one declare that a second wave has begun?

The figure of 120 000 expected deaths in a winter peak makes the headlines,3 but the fact that the number could be as low as 1300 fails to get a mention in some news outlets.4 The Office for National Statistics reported a prevalence of 0.09% on 25 June 20205 (a non-significant rise from the 0.06% reported in the prior week due to overlapping confidence intervals).6 This was picked up by one media outlet as a cause for pessimism and a sign of a probable impending second wave.7 The prevalence dropped to 0.04% the following week.8 I noticed an amendment in the article a few days later, acknowledging this drop in terms of halving the number of cases.7 This received barely two lines hidden in the middle of the article, with no change to the pessimistic title of the article predicting the second wave. Data released on 17 July revealed a persistently low prevalence at 0.04%.9

Well-respected epidemiologists predicted, from the outset, that the societal, economic, and psychological harm from the unprecedented lockdowns were likely to be far greater than the perceived risk of death. However, such views were lost in the narrative of fear that predominated the early discussions on the matter and treated like an Orwellian Thoughtcrime.

As GPs we should reassure our patients and encourage their active participation in bringing forward other health worries that they may have been ignoring over the last few months.

It is important that as the collateral damage of the steps taken in the last few months to curb the virus becomes clearer and the lower than initially expected fatality rate emerges, a sense of responsibility is demonstrated by those charged with informing the public.

Postscript: This update from CDC (here)  H/T William Briggs (here)

Table 3 shows the types of health conditions and contributing causes mentioned in conjunction with deaths involving coronavirus disease 2019 (COVID-19). For 6% of the deaths, COVID-19 was the only cause mentioned. For deaths with conditions or causes in addition to COVID-19, on average, there were 2.6 additional conditions or causes per death. The number of deaths with each condition or cause is shown for all deaths and by age groups. 

Comment by William Briggs:

Six percent.

The other number of interest is the official coronadoom death total, which as of Sunday night is 167,558. Math is easy: 167,558 * 0.06 = 10,054. Rounded up, to be fair.

The remaining 157,504 died of other things—an average 2.6 other things!—with the presence of coronadoom. Some fraction of these poor people, considering false positives, died of just other things.

How many times, early on, did we scream, rant, and, yes, rave about juicing the numbers? The answer is a large positive number. Alas, the screams hit the ears of bureaucrats and politicians, our dumbest and evilest classes.

It must be recalled that many deaths were caused by the unnecessary lockdowns themselves. Lockdowns killed. This is not hyperbole or a guess. It is fact.


Covid Burnout in Canada August 28

The map shows that in Canada 9108 deaths have been attributed to Covid19, meaning people who died having tested positive for SARS CV2 virus.  This number accumulated over a period of 210 days starting January 31. The daily death rate reached a peak of 177 on May 6, 2020, and is down to 6 as of yesterday.  More details on this below, but first the summary picture. (Note: 2019 is the latest demographic report)

Canada Pop Ann Deaths Daily Deaths Risk per
Person
2019 37589262 330786 906 0.8800%
Covid 2020 37589262 9108 43 0.0242%

Over the epidemic months, the average Covid daily death rate amounted to 5% of the All Causes death rate. During this time a Canadian had an average risk of 1 in 5000 of dying with SARS CV2 versus a 1 in 114 chance of dying regardless of that infection. As shown later below the risk varied greatly with age, much lower for younger, healthier people.

Background Updated from Previous Post

In reporting on Covid19 pandemic, governments have provided information intended to frighten the public into compliance with orders constraining freedom of movement and activity. For example, the above map of the Canadian experience is all cumulative, and the curve will continue upward as long as cases can be found and deaths attributed.  As shown below, we can work around this myopia by calculating the daily differentials, and then averaging newly reported cases and deaths by seven days to smooth out lumps in the data processing by institutions.

A second major deficiency is lack of reporting of recoveries, including people infected and not requiring hospitalization or, in many cases, without professional diagnosis or treatment. The only recoveries presently to be found are limited statistics on patients released from hospital. The only way to get at the scale of recoveries is to subtract deaths from cases, considering survivors to be in recovery or cured. Comparing such numbers involves the delay between infection, symptoms and death. Herein lies another issue of terminology: a positive test for the SARS CV2 virus is reported as a case of the disease COVID19. In fact, an unknown number of people have been infected without symptoms, and many with very mild discomfort.

August 7 in the UK it was reported (here) that around 10% of coronavirus deaths recorded in England – almost 4,200 – could be wiped from official records due to an error in counting.  Last month, Health Secretary Matt Hancock ordered a review into the way the daily death count was calculated in England citing a possible ‘statistical flaw’.  Academics found that Public Health England’s statistics included everyone who had died after testing positive – even if the death occurred naturally or in a freak accident, and after the person had recovered from the virus.  Numbers will now be reconfigured, counting deaths if a person died within 28 days of testing positive much like Scotland and Northern Ireland…

Professor Heneghan, director of the Centre for Evidence-Based Medicine at Oxford University, who first noticed the error, told the Sun:

‘It is a sensible decision. There is no point attributing deaths to Covid-19 28 days after infection…

For this discussion let’s assume that anyone reported as dying from COVD19 tested positive for the virus at some point prior. From the reasoning above let us assume that 28 days after testing positive for the virus, survivors can be considered recoveries.

Recoveries are calculated as cases minus deaths with a lag of 28 days. Daily cases and deaths are averages of the seven days ending on the stated date. Recoveries are # of cases from 28 days earlier minus # of daily deaths on the stated date. Since both testing and reports of Covid deaths were sketchy in the beginning, this graph begins with daily deaths as of April 24, 2020 compared to cases reported on March 27, 2020.

The line shows the Positivity metric for Canada starting at nearly 8% for new cases April 24, 2020. That is, for the 7 day period ending April 24, there were a daily average of 21,772 tests and 1715 new cases reported. Since then the rate of new cases has dropped down, now holding steady at ~1% since mid-June. Yesterday, the daily average number of tests was 45,897 with 427 new cases. So despite more than doubling the testing, the positivity rate is not climbing.  Another view of the data is shown below.

The scale of testing has increased and now averages over 45,000 a day, while positive tests (cases) are hovering at 1% positivity.  The shape of the recovery curve resembles the case curve lagged by 28 days, since death rates are a small portion of cases.  The recovery rate has grown from 83% to 99% steady over the last 2 weeks, so that recoveries exceed new positives. This approximation surely understates the number of those infected with SAR CV2 who are healthy afterwards, since antibody studies show infection rates multiples higher than confirmed positive tests (8 times higher in Canada).  In absolute terms, cases are now down to 427 a day and deaths 6 a day, while estimates of recoveries are 437 a day.

The key numbers: 

99% of those tested are not infected with SARS CV2. 

99% of those who are infected recover without dying.

Summary of Canada Covid Epidemic

It took a lot of work, but I was able to produce something akin to the Dutch advice to their citizens.

The media and governmental reports focus on total accumulated numbers which are big enough to scare people to do as they are told.  In the absence of contextual comparisons, citizens have difficulty answering the main (perhaps only) question on their minds:  What are my chances of catching Covid19 and dying from it?

A previous post reported that the Netherlands parliament was provided with the type of guidance everyone wants to see.

For canadians, the most similar analysis is this one from the Daily Epidemiology Update: :

The table presents only those cases with a full clinical documentation, which included some 2194 deaths compared to the 5842 total reported.  The numbers show that under 60 years old, few adults and almost no children have anything to fear.

Update May 20, 2020

It is really quite difficult to find cases and deaths broken down by age groups.  For Canadian national statistics, I resorted to a report from Ontario to get the age distributions, since that province provides 69% of the cases outside of Quebec and 87% of the deaths.  Applying those proportions across Canada results in this table. For Canada as a whole nation:

Age  Risk of Test +  Risk of Death Population
per 1 CV death
<20 0.05% None NA
20-39 0.20% 0.000% 431817
40-59 0.25% 0.002% 42273
60-79 0.20% 0.020% 4984
80+ 0.76% 0.251% 398

In the worst case, if you are a Canadian aged more than 80 years, you have a 1 in 400 chance of dying from Covid19.  If you are 60 to 80 years old, your odds are 1 in 5000.  Younger than that, it’s only slightly higher than winning (or in this case, losing the lottery).

As noted above Quebec provides the bulk of cases and deaths in Canada, and also reports age distribution more precisely,  The numbers in the table below show risks for Quebecers.

Age  Risk of Test +  Risk of Death Population
per 1 CV death
0-9 yrs 0.13% 0 NA
10-19 yrs 0.21% 0 NA
20-29 yrs 0.50% 0.000% 289,647
30-39 0.51% 0.001% 152,009
40-49 years 0.63% 0.001% 73,342
50-59 years 0.53% 0.005% 21,087
60-69 years 0.37% 0.021% 4,778
70-79 years 0.52% 0.094% 1,069
80-89 1.78% 0.469% 213
90  + 5.19% 1.608% 62

While some of the risk factors are higher in the viral hotspot of Quebec, it is still the case that under 80 years of age, your chances of dying from Covid 19 are better than 1 in 1000, and much better the younger you are.

August 29, 2020 Arctic Ice Returns to Mean


To enlarge, open image in new tab.

The melting season this year showed ice extents much below the 13-year average, but the decline moderated in August and presently is close to the mean and to 2007.

As discussed below, the daily minimum on average occurs on day 260, but a given year may be earlier or later.  The 2020 minimum on day 239 will not likely stand, but stranger things have happened.  For now, MASIE is showing a jump of almost 300k km2 bringing yesterday very close to the 13-year average (-3.5%).  SII also stopped declining, but as is often the case, started 11 days ago showing less ice than MASIE.  The table below shows the distribution of ice in the various regions of the Arctic Ocean.

Region 2020241 Day 241 Average 2020-Ave. 2007241 2020-2007
 (0) Northern_Hemisphere 4839354 5017305 -177952 4916182 -76829
 (1) Beaufort_Sea 806154 554434 251720 707135 99019
 (2) Chukchi_Sea 354686 257290 97396 142656 212030
 (3) East_Siberian_Sea 235822 363889 -128067 311 235511
 (4) Laptev_Sea 7420 192875 -185455 279554 -272133
 (5) Kara_Sea 31679 46675 -14996 112935 -81256
 (6) Barents_Sea 0 23436 -23436 10037 -10037
 (7) Greenland_Sea 262773 189236 73536 332635 -69863
 (8) Baffin_Bay_Gulf_of_St._Lawrence 7586 32270 -24684 39777 -32191
 (9) Canadian_Archipelago 342594 317798 24795 271603 70991
 (10) Hudson_Bay 23922 26315 -2393 51493 -27571
 (11) Central_Arctic 2766030 3012169 -246139 2966791 -200761

The extent numbers show that this year’s melt is dominated by the surprisingly hot Siberian summer, leading to major deficits in all the Eurasian shelf seas–East Siberian, Laptev, Kara.  As well, the bordering parts of the Central Arctic show a sizeable deficit to average. These deficits are partly offset by surpluses on the CanAm side: Beaufort, Chukchi, Greenland Sea and CAA.

It is also the case that many regions have already registered their 2020 minimums.  And as discussed below, the marginal basins have little ice left to lose.

Background from Previous Post Outlook for Arctic Ice Minimum

The annual competition between ice and water in the Arctic ocean is approaching the maximum for water, which typically occurs mid September.  After that, diminishing energy from the slowly setting sun allows oceanic cooling causing ice to regenerate. Those interested in the dynamics of Arctic sea ice can read numerous posts here.  The image at the top provides a look at mid August from 2007 to 2020 as a context for anticipating this year’s annual minimum.  Note that for climate purposes the annual minimum is measured by the September monthly average ice extent, since the daily extents vary and will go briefly lower on or about day 260.

The Bigger Picture 

We are close to the annual Arctic ice extent minimum, which typically occurs on or about day 260 (mid September). Some take any year’s slightly lower minimum as proof that Arctic ice is dying, but the image above shows the Arctic heart is beating clear and strong.

Over this decade, the Arctic ice minimum has not declined, but since 2007 looks like fluctuations around a plateau. By mid-September, all the peripheral seas have turned to water, and the residual ice shows up in a few places. The table below indicates where we can expect to find ice this September. Numbers are area units of Mkm2 (millions of square kilometers).

Day 260 13 year
Arctic Regions 2007 2010 2012 2014 2015 2016 2017 2018 2019 Average
Central Arctic Sea 2.67 3.16 2.64 2.98 2.93 2.92 3.07 2.91 2.97 2.93
BCE 0.50 1.08 0.31 1.38 0.89 0.52 0.84 1.16 0.46 0.89
LKB 0.29 0.24 0.02 0.19 0.05 0.28 0.26 0.02 0.11 0.16
Greenland & CAA 0.56 0.41 0.41 0.55 0.46 0.45 0.52 0.41 0.36 0.46
B&H Bays 0.03 0.03 0.02 0.02 0.10 0.03 0.07 0.05 0.01 0.04
NH Total 4.05 4.91 3.40 5.13 4.44 4.20 4.76 4.56 3.91 4.48

The table includes three early years of note along with the last 6 years compared to the 13 year average for five contiguous arctic regions. BCE (Beaufort, Chukchi and East Siberian) on the Asian side are quite variable as the largest source of ice other than the Central Arctic itself.   Greenland Sea and CAA (Canadian Arctic Archipelago) together hold almost 0.5M km2 of ice at annual minimum, fairly consistently.  LKB are the European seas of Laptev, Kara and Barents, a smaller source of ice, but a difference maker some years, as Laptev was in 2016.  Baffin and Hudson Bays are inconsequential as of day 260.

For context, note that the average maximum has been 15M, so on average the extent shrinks to 30% of the March high before growing back the following winter.  In this context, it is foolhardy to project any summer minimum forward to proclaim the end of Arctic ice.

Resources:  Climate Compilation II Arctic Sea Ice

School’s Back: Indoctrination Resumes

“Say what you want about the Liberal Arts, but they have found a cure for common sense.”

Walter E. Williams explains in his article Back To College, Back To Academic Brainwashing Excerpts in italics with my bolds. H/T IceCap

Parents, legislators, taxpayers, and others footing the bill for college education might be interested in just what is in store for the upcoming academic year.

Since many college classes will be online, there is a chance to witness professors indoctrinating their students in real time. So, there’s a chance that some college faculty might change their behavior. To see recent examples of campus nonsense and indoctrination, visit the Campus Reform and College Fix websites.

Jonathan Turley, a law professor at George Washington University, warned congressional lawmakers “that Antifa is ‘winning’ and that much of academia, whether wittingly or unwittingly, is complicit in its success,” reported Campus Reform.

In his testimony before Congress Turley said:

To Antifa, people like me are the personification of the classical liberal view of free speech that perpetuates a system of oppression and abuse. I wish I could say that my view remains strongly implanted in our higher educational institutions. However, you are more likely to find public supporters for restricting free speech than you are to find defenders of free speech principles on many campuses.

The leftist bias at our colleges and universities has many harmful effects. A mathematics professor at University of California, Davis, faced considerable backlash over her opposition to the requirement for “diversity statements” from potential faculty.

Those seeking employment at the University of California, San Diego, are required to admit that “barriers” prevent women and minorities from full participation in campus life.

At American University, a history professor wrote a book calling for the repeal of the Second Amendment. A Rutgers University professor said: “Watching the Iowa Caucus is a sickening display of the overrepresentation of whiteness.”

A Williams College professor has advocated the inclusion of social justice in math textbooks. Students at Wayne State University are no longer required to take a single math course to graduate; however, they may soon be required to take a diversity course.

Maybe some students will be forced into sharing the vision of Laurie Rubel, a math education professor at Brooklyn College. She says the idea of cultural neutrality in math is a “myth,” and that asking whether 2 plus 2 equals 4 “reeks of white supremacist patriarchy.”

Rubel tweeted: “Y’all must know that the idea that math is objective or neutral IS A MYTH.”

Math professors and academics at other universities, including Harvard and the University of Illinois, discussed the “Eurocentric” roots of American mathematics. As for me, I would like to see the proof, in any culture, that 2 plus 2 is something other than 4.

Rutgers University’s English department chairwoman, Rebecca Walkowitz, announced changes to the department’s graduate writing program emphasizing “social justice” and “critical grammar.”

Leonydus Johnson, a speech-language pathologist and libertarian activist, says Walkowitz’s changes make the assumption that minorities cannot understand traditional and grammatically correct English speech and writing, which is “insulting, patronizing, and in itself, extremely racist.”

Then there is the nonsense taught on college campuses about white privilege. The idea of white privilege doesn’t explain why several historically marginalized groups outperform whites today.

For example, Japanese Americans suffered under the Alien Land Law of 1913 and other racist, exclusionary laws legally preventing them from owning land and property in more than a dozen American states until the Immigration and Nationality Act of 1952.

During World War II, more than 120,000 Japanese Americans were interned. However, by 1959, the income disparity between Japanese Americans and white Americans had almost disappeared.

Today, Japanese Americans outperform white Americans by large margins in income statistics, education outcomes, and test scores, and have much lower incarceration rates.

According to Rav Arora, writing for the New York Post, several black immigrant groups such as Nigerians, Trinidadians, Tobagonians, Barbadians, and Ghanaians all “have a median household income well above the American average.”

We are left with the question whether the people handing out “white privilege” made a mistake. The other alternative is that Japanese Americans, Nigerians, Barbadians, Ghanaians, Trinidadians, and Tobagonians are really white Americans.

The bottom line is that more Americans need to pay attention to the miseducation of our youth and that miseducation is not limited to higher education.

Walter E. Williams, a columnist for The Daily Signal, is a professor of economics at George Mason University.


JimBob weighs in on “progressive” education.


And a final word from Dilbert:

How Climatism Destroyed California

Ben Pile writes at Spiked The problem in California is poverty, not climate change. Excerpts in italics with my bolds.

The heatwaves and the fires are natural – the electricity blackouts are not.

Events leading up to today’s power cuts follow a bizarre history. The fact that advanced economies need a continuous supply of power is well understood. Yet for three decades, the political agenda, dominated by self-proclaimed ‘progressives’, has put lofty green idealism before security of supply and before the consumer’s interest in reasonable prices. Even if the heatwaves experienced by California were caused by climate change, are their direct effects worse than the loss of electricity supply?

California’s green and tech billionaires, and its business and political elites, certainly seem to think so. But they are largely protected from reality by vast wealth, private security, gated estates, and battery banks. The high cost of property in the state of California means that, despite being the fifth largest economy in the world, and with the sixth highest per capita income in the US, it is the worst US state for poverty. According to the US Census Bureau, around 18 per cent of Californians, some seven million people, lived in poverty between 2016 and 2018 – more than five per cent above the US average.

As well as being the greenest (and most poverty-stricken) state, California can also boast that it is the No1 state for homelessness.

According to the US Interagency Council on Homelessness, there are more than 151,000 homeless people in California – a rise of 28,000 since 2010. That figure is shocking enough, but it masks the reality of many thousands more moving in and out of homelessness. The same agency reports that more than a quarter of a million schoolchildren experienced homelessness over the 2017/18 school year.

It is degenerate politics, not climate change, that presses hardest on the millions of Californians who live in poverty, and the many millions more who live just above the poverty line. The problems of this degenerate politics are visible, on the street, chronic and desperate, whereas climate change, if it is a problem at all, is only detectable through questionable statistical techniques. Yet California’s charismatic governors, since Arnold Schwarzenegger, have made their mark on the global stage as environmental champions.

At the 2017 COP23 UNFCCC conference in Bonn, Germany, then governor Jerry Brown shared a platform with the green billionaire and former New York mayor, Mike Bloomberg, to announce ‘America’s Pledge on Climate’ – a commitment of states and cities to combat climate change – despite President Trump’s decision to withdraw the US from the Paris Agreement earlier that year.

But why not a pledge on homelessness? Why not a pledge to address the problem of property prices? Why not a pledge to tackle poverty? Why not a pledge to secure a supply of energy? The only conceivable answer is that environmentalism is a form of politics that is entirely disinterested in the lives of ordinary people, despite progressive politicians’ claims that environmental and social issues are linked. Clearly they are not in the slightest bit linked.

California was the experiment, and now it is the proof: environmentalism is worse for ‘social justice’ than any degree of climate change is.

What about the wildfires? Aren’t they proof of climate change? It is a constant motif of green histrionics that more warming means more fires. But as has been pointed out before on spiked and elsewhere, places like California have long suffered from huge fires; fire is a part of many types of forests’ natural lifecycle.

What California’s rolling blackouts and its uncontrolled fires tell us is that green politics is completely divorced from any kind of reality. Environmentalism is the indulgent fantasy of remote political elites and their self-serving business backers. If California doesn’t prove this, what would?

Footnote: Bjorn Lomborg tried in 2015 to reason with Arnie Arnold Schwarzenegger Is Wrong On Climate Change Excerpts in italics with my bolds.

But that makes it even more important that those of us talking about global warming and its policy responses are responsible about statistics and data. It’s not good enough to swagger around saying, “I think I’m right and I’m going to ignore the haters.” Schwarzenegger loses me when he declares, “every day, 19,000 people die from pollution from fossil fuels. Do you accept those deaths?”

It’s emotive, but it’s wrong to say that 19,000 people are killed by fossil fuels every day. About 11,000 of these people are killed by burning renewable energy – wood and cow dung mainly – inside their own homes. The actual number of people killed by fossil fuels each day is about 3,900.

This matters for two reasons. First, it is disingenuous to link the world’s biggest environmental problem of air pollution to climate. It is a question of poverty (most indoor air pollution) and lack of technology (scrubbing pollution from smokestacks and catalytic converters) – not about global warming and CO₂. Second, costs and benefits matter.[vi] Tackling indoor air pollution turns out to be very cheap and effective, whereas tackling outdoor air pollution is more expensive and less effective. Your favorite policy of cutting CO₂ is of course even more costly and has a tiny effect even in a hundred years.

Lomborg failed to change Schwarzenegger’s mind since Arnie was so enamored of being a global environmental star as a sequel to his Hollywood movie celebrity.


Covid-19 Immunity Scenarios Encouraging

Helen Braswell explains at Stat Four scenarios on how we might develop immunity to Covid-19
Excerpts in italics with my bolds.

As the world wearies of trying to suppress the SARS-CoV-2 virus, many of us are wondering what the future will look like as we try to learn to live with it.

Will it always have the capacity to make us so sick? Will our immune systems learn — and remember — how to cope with the new threat? Will vaccines be protective and long-lasting?

STAT asked a number of experts to map out scenarios of how we might come to coexist with this new threat. In a time of uncertainty, the scenarios they sketched were actually hopeful, even if the relief most envisage is not immediately around the corner.

Vineet Menachery, a coronavirus researcher at the University of Texas Medical Branch in Galveston laid out four possible scenarios for how humans might interact with SARS-2 over time — in other words, what kind of immunity we might expect.

As Menachery sees it, the possibilities for the future when it comes to Covid-19 and human immunity break down as follows:

  • sterilizing immunity,
  • functional immunity,
  • waning immunity, and
  • lost immunity. 

Please remember: These are educated guesses, based on what’s known about the way the immune system works in general, and how it responds to other coronaviruses.

Sterilizing immunity

Sterilizing immunity would be a best-case scenario. It describes an immune system that is armed against a foe, able to fend it off before infection can take hold.

Diseases that we think of as “one-and-done” infections induce such a robust and durable immune response in a single encounter that we cannot be reinfected. In general terms, measles fits into this category, although there are rare reports of people contracting measles more than once.

The bad news is that viruses that infect via the mucus membranes of the nose and throat, like SARS-2, typically don’t induce sterilizing immunity.

But Florian Krammer, a professor of vaccinology at the Icahn School of Medicine at Mount Sinai Hospital in New York, does believe some people will develop sterilizing immunity after a bout of Covid-19.

Malik Peiris, a coronavirus expert at the Hong Kong University who was one of the co-discoverers of SARS-1, said,  “Of course, what we’d all like is immunity that protects the individual — protects from infection and protects from transmission. We may not achieve that, because protecting from infection of the upper respiratory tract and then transmission is quite a challenge.

Functional immunity

Functional immunity, on the other hand, may be within reach. In fact, it’s the scenario Menachery sees as most likely.

Under this scenario, people whose immune systems have been primed to recognize and fight the virus — whether through infection or vaccination — could contract it again in the future. But these infections would be cut short as the immune system’s defenses kick into gear. People infected might not develop symptoms or might have a mild, cold-like infection.

“I’m a believer that if you’ve gotten Covid-19, then your likelihood of dying from a second Covid-19 case is very low, if you maintain immunity,” Menachery said.

Peiris agreed. “It won’t have the impact it has now. … It becomes manageable.”  “The fact that somebody may get reinfected is not surprising. But the reinfection didn’t cause disease,” said Peiris, who knows about the case but was not one of the authors reporting it.

Christian Drosten, who is another co-discoverer of SARS-1, describes a future that fits into this category.

“I clearly expect lasting and relevant immunity that is almost sterilizing immunity against SARS-2 in almost every person infected with SARS-2,” Drosten, director of the Institute of Virology at Berlin’s Charité University Hospital, said via email.

“It may be possible to become infected again, without any change in the virus. The resulting infection will be mild or asymptomatic, with significantly lower levels of virus replication and onward transmission.”

Drosten’s last point would be a big bonus. If people who are reinfected don’t generate high levels of SARS-2 viruses in their respiratory tracts and therefore don’t contribute much to the spread of the virus, Covid-19 may become, over time, not just less dangerous, but also less common.

Waning immunity

Waning infection, the third scenario, is a variation of functional immunity. In this scenario, people who have been infected or vaccinated would lose their protection over time. But even if immunity wanes, reinfections would be less severe, Menachery said.

“You will never get as sick as you were the first time,” he said.

This is the pattern seen with the four coronaviruses that cause about 15% of what we consider common colds — OC43, 229E, NL63, and HKU1. People can be reinfected with these viruses after a relatively short period of time.

Thirty years ago, British scientists reported that a year after deliberately infecting a small number of volunteers with 229E, two-thirds became reinfected when again exposed to the virus. “However, the period of virus shedding was shorter than before and none developed a cold,” they wrote.

Krammer believes the overall picture will be mixed. Some people will have sterilizing immunity, but most will fit into either the functional or waning immunity categories. The net outcome: less of the type of disease that prompted most countries to take the extraordinary steps of locking down this spring.

Lost immunity

Lost immunity describes a scenario in which people who have been infected would lose all their immune munitions against the virus within some time frame. A reinfection after that point would be like a first infection — carrying all the same risk of severe disease now seen with Covid-19.

None of the experts who spoke to STAT felt this was a possibility.

“I can’t imagine this being a situation where I get infected and then in 10 years, I get infected again and I have zero immunity,” Perlman said.

If these experts are correct, and the worst-case scenario is off the table, humans can expect to see a waning of the threat SARS-2 poses to people over time. Our immune systems will know how to deal with it. It could become the fifth human coronavirus to cause common colds.


Silly Science Questions

Here at RealClearScience, a lazy blogging day can prompt a torrent of laughter! That’s because we occasionally return to the well of humor available at a crudely-named subreddit of the popular website Reddit to bring you “hilariously stupid science questions”. Be prepared to drown in terrible puns, painful fallacies, and poor logic. Should you survive (and somehow enjoy the experience), you can check out some of the other installments in this recurring series. H/Y Ross Pomeroy

Attempts to “Connect the Dots” With Few or No Clues

If we lose net neutrality, will the net become acidic or basic?
If global warming was real, wouldn’t the ice wall melt and let the oceans drain away? So then why is the sea level rising?
Why do meteorites always land in craters?
My pizza says to bake for 18-21 minutes, how do I bake something for -3 minutes?
Are children actually small or are they just far away?
The first dog in space died of stress. Was that because of all the vacuums up there?
If Mercury is so close to the sun how come we can get it inside thermometers???
Why are so many products harmful only to Californians?
How much higher would the sea level be if there were no sponges?
If setting off nukes creates “nuclear winters”, why don’t we set off a few nukes to offset global warming?
If electricity always follows the path of least resistance, why doesn’t lightning only strike in France?
What happens if a very stoppable force meets a very movable object?
If Pi is never ending, why is there still world hunger?
Is HIV considered a “retro virus” because it started to be a problem in the 80s?
Why does alcohol need proofs? Shouldn’t we just take their word for it?
Do strippers in the southern hemisphere spin around their poles in the opposite direction as strippers in the northern hemisphere?
If sound can’t travel through vacuums, why are they so loud?
How can we trust atoms if they make up everything?
If the human body is ~90% water, why can’t we put out fires with our bodies?
If there’s a new moon every month. Where does the old one go?
Why did ancient people bury so many buildings?
How can fish hold their breath for so long underwater?
If Corn Oil is made from corn, and Olive Oil is made from olives, where does Baby Oil come from?
Before light bulbs were invented, how did people get ideas?
Does it take 18 months for twins to be born?
I just found out I am bipolar. Should I avoid magnets?
From which sheep do we get steel wool?
When will the gorilla at the zoo turn into a person?
Is the water bug the natural predator of the firefly?
Did Schrödinger ever consider the fact that his cat had nine lives?
If oxygen was discovered in 1783 by Antoine Lavoisier, how did people breathe before then?