Michigan Gets Results with HCQ

BREAKING: ‘Trump Drug’ Hydroxychloroquine ‘Significantly’ Reduces Death Rate From COVID-19, Henry Ford Health Study Finds. H/T Jaime Jessop.  Excerpts in italics with my bolds

A Henry Ford Health System study shows the controversial anti-malaria drug hydroxychloroquine helps lower the death rate of COVID-19 patients, the Detroit-based health system said Thursday.

Officials with the Michigan health system said the study found the drug “significantly” decreased the death rate of patients involved in the analysis.

The study analyzed 2,541 patients hospitalized among the system’s six hospitals between March 10 and May 2 and found 13% of those treated with hydroxychloroquine died while 26% of those who did not receive the drug died.

Among all the patients in the study, there was an overall in-hospital mortality rate of 18%, and many who died had underlying conditions, the hospital system said. Globally, the mortality rate for hospitalized patients is between 10% and 30%, and 58% among those in the ICU or on a ventilator.

“As doctors and scientists, we look to the data for insight,” said Steven Kalkanis, CEO of the Henry Ford Medical Group. “And the data here is clear that there was a benefit to using the drug as a treatment for sick, hospitalized patients.”

A previous study by French doctors considered the efficacy of HCQ along with other widely available drugs during the several stages of Covid19.  The Michigan study shows benefits for people hospitalized in phases II and III.  The French study emphasized early use during phase I at onset of testing positive for SARS CV2.

See Pandemic Update: Virus Weaker, HCQ Stronger

HCQ Hit Job by Big Pharma Data Miners


Cooling June for Land and Ocean Air Temps

banner-blog

With apologies to Paul Revere, this post is on the lookout for cooler weather with an eye on both the Land and the Sea.  UAH has updated their tlt (temperatures in lower troposphere) dataset for June 2020.  Previously I have done posts on their reading of ocean air temps as a prelude to updated records from HADSST3. This month also has a separate graph of land air temps because the comparisons and contrasts are interesting as we contemplate possible cooling in coming months and years.

Presently sea surface temperatures (SST) are the best available indicator of heat content gained or lost from earth’s climate system.  Enthalpy is the thermodynamic term for total heat content in a system, and humidity differences in air parcels affect enthalpy.  Measuring water temperature directly avoids distorted impressions from air measurements.  In addition, ocean covers 71% of the planet surface and thus dominates surface temperature estimates.  Eventually we will likely have reliable means of recording water temperatures at depth.

Recently, Dr. Ole Humlum reported from his research that air temperatures lag 2-3 months behind changes in SST.  He also observed that changes in CO2 atmospheric concentrations lag behind SST by 11-12 months.  This latter point is addressed in a previous post Who to Blame for Rising CO2?

HadSST3 results were delayed with February and March updates only appearing together end of April.  For comparison we can look at lower troposphere temperatures (TLT) from UAHv6 which are now posted for June. The temperature record is derived from microwave sounding units (MSU) on board satellites like the one pictured above.

The UAH dataset includes temperature results for air above the oceans, and thus should be most comparable to the SSTs. There is the additional feature that ocean air temps avoid Urban Heat Islands (UHI). In 2015 there was a change in UAH processing of satellite drift corrections, including dropping one platform which can no longer be corrected. The graphs below are taken from the latest and current dataset, Version 6.0.

The graph above shows monthly anomalies for ocean temps since January 2015. After all regions peaked with the El Nino in early 2016, the ocean air temps dropped back down with all regions showing the same low anomaly August 2018.  Then a warming phase ensued with NH and Tropics spikes in February and May 2020. As was the case in 2015-16, the warming was driven by the Tropics and NH, with SH lagging behind. After the up and down fluxes, oceans temps in June are back to a neutral point, close to the 0.4C average for the period.

Land Air Temperatures Showing a Seesaw Pattern

We sometimes overlook that in climate temperature records, while the oceans are measured directly with SSTs, land temps are measured only indirectly.  The land temperature records at surface stations sample air temps at 2 meters above ground.  UAH gives tlt anomalies for air over land separately from ocean air temps.  The graph updated for June 2020 is below.

Here we see evidence of the greater volatility of the Land temperatures, along with extraordinary departures, first by NH land with SH often offsetting.   The overall pattern is similar to the ocean air temps, but obviously driven by NH with its greater amount of land surface. The Tropics synchronized with NH for the 2016 event, but otherwise follow a contrary rhythm.  SH seems to vary wildly, especially in recent months.  Note the extremely high anomaly last November, cold in March 2020, and then again a spike in April. Now in June 2020, all land regions have converged, erasing the earlier spikes in NH and SH, and showing anomalies comparable to the 0.4C anomaly prior to the 2015-16 El Nino.

The longer term picture from UAH is a return to the mean for the period starting with 1995.  2019 average rose but currently lacks any El Nino to sustain it.

These charts demonstrate that underneath the averages, warming and cooling is diverse and constantly changing, contrary to the notion of a global climate that can be fixed at some favorable temperature.

TLTs include mixing above the oceans and probably some influence from nearby more volatile land temps.  Clearly NH and Global land temps have been dropping in a seesaw pattern, more than 1C lower than the 2016 peak, prior to these last several months. TLT measures started the recent cooling later than SSTs from HadSST3, but are now showing the same pattern.  It seems obvious that despite the three El Ninos, their warming has not persisted, and without them it would probably have cooled since 1995.  Of course, the future has not yet been written.

Arctic Ice Usual June Swoon


The image above shows melting of Arctic sea ice extent over the month of June 2020.  As usual the process of declining ice extent follows a LIFO pattern:  Last In First Out.  That is, the marginal seas are the last to freeze and the first to melt.  Thus at the top center and right of the image, the Pacific basins of Bering and Okohtsk seas lost what little ice they had.  Meanwhile at extreme left, Hudson Bay ice retreats 300k km2 from north to south.  Note center left Baffin Bay loses 320k km2 of ice during the month.  The most dramatic melting is in the Russian shelf seas at the center right.  Laptev and Kara Seas combined to lose 600k km2 of ice extent. The central mass of Arctic ice is intact with some fluctuations back and forth, and as well Greenland Sea and CAA (Canadian Arctic Archipelago) were slow to melt in June

The graph below shows the ice extent retreating during June compared to some other years and the 13 year average (2007 to 2019 inclusive).

Note that the  MASIE NH ice extent 13 year average loses about 2M km2 during June, down to 9.6M km2. MASIE 2019 started nearly 500k km2 lower and lost ice at a similar rate, ending 476 km2 below average.  The most interesting thing was the wide divergence between SII and MASIE reports during June, SII starting the month about 500k km2 higher before narrowing at the end to exceed MASIE by 133k km2.  I inquired whether NIC had experienced any measurement issues, but their response indicated nothing remarkable.  It is unusual for MASIE to be the lower estimate of the two.

The table shows where the ice is distributed compared to average.  Bering and Okhotsk are open water at this point and will be dropped from future monthly updates. The deficit of 476k km2 represents 5% of the total, or an ice extent melting 5 days ahead of average.

Region 2020183 Day 183 Average 2020-Ave. 2007183 2020-2007
 (0) Northern_Hemisphere 9128615 9604642  -476028  9269301 -140686 
 (1) Beaufort_Sea 982475 882878  99597  891858 90617 
 (2) Chukchi_Sea 730000 703162  26838  637536 92464 
 (3) East_Siberian_Sea 885090 1014587  -129497  855267 29823 
 (4) Laptev_Sea 469839 704231  -234392  646683 -176844 
 (5) Kara_Sea 274007 535421  -261414  596916 -322909 
 (6) Barents_Sea 111016 106522  4494  97267 13749 
 (7) Greenland_Sea 474331 498794  -24463  548566 -74236 
 (8) Baffin_Bay_Gulf_of_St._Lawrence 438007 479675  -41668  414283 23724 
 (9) Canadian_Archipelago 780765 774360  6405  759177 21589 
 (10) Hudson_Bay 739422 686381  53041  613940 125482 
 (11) Central_Arctic 3235174 3202495  32679  3202330 32844 
 (12) Bering_Sea 315 3673  -3357  981 -665 
 (13) Baltic_Sea 0 -4  0
 (14) Sea_of_Okhotsk 7051 11237  -4185  2983 4068 

Note that all of the deficit to average is accounted for by the Russian shelf seas of East Siberian, Laptev and Kara. Beaufort and Hudson Bay are slightly surplus.

Illustration by Eleanor Lutz shows Earth’s seasonal climate changes. If played in full screen, the four corners present views from top, bottom and sides. It is a visual representation of scientific datasets measuring Arctic ice extents.

Canada Covid Wrap Up

The map shows that in Canada 8591 deaths have been attributed to Covid19, meaning people who died having tested positive for SARS CV2 virus.  This number accumulated over a period of 132 days starting January 31. The daily death rate reached a peak of 177 on May 6, 2020, and is down to 20 as of yesterday.  More details on this below, but first the summary picture. (Note: 2019 is the latest demographic report)

Canada Pop Ann Deaths Daily Deaths Risk per
Person
2019 37589262 330786 906 0.8800%
Covid 2020 37589262 8591 65 0.0228%

Over the epidemic months, the average Covid daily death rate amounted to 7% of the All Causes death rate. During this time a Canadian had an average risk of 1 in 5000 of dying with SARS CV2 versus a 1 in 114 chance of dying regardless of that infection. As shown later below the risk varied greatly with age, much lower for younger, healthier people.

Background Updated from Previous Post

In reporting on Covid19 pandemic, governments have provided information intended to frighten the public into compliance with orders constraining freedom of movement and activity. For example, the above map of the Canadian experience is all cumulative, and the curve will continue upward as long as cases can be found and deaths attributed.  As shown below, we can work around this myopia by calculating the daily differentials, and then averaging newly reported cases and deaths by seven days to smooth out lumps in the data processing by institutions.

A second major deficiency is lack of reporting of recoveries, including people infected and not requiring hospitalization or, in many cases, without professional diagnosis or treatment. The only recoveries presently to be found are limited statistics on patients released from hospital. The only way to get at the scale of recoveries is to subtract deaths from cases, considering survivors to be in recovery or cured. Comparing such numbers involves the delay between infection, symptoms and death. Herein lies another issue of terminology: a positive test for the SARS CV2 virus is reported as a case of the disease COVID19. In fact, an unknown number of people have been infected without symptoms, and many with very mild discomfort.

For this discussion let’s assume that anyone reported as dying from COVD19 tested positive for the virus at some point prior. A recent article by Nic Lewis at Climate Etc. referred to evidence that the average time from infection to symptoms is 5.1 days, and from symptoms to death 18.8 days. A separate issue, of course, is that 95+% of those dying had one or more co-morbidities contributing to the patient’s demise. Setting aside the issue of dying with/from Covid19, it is reasonable to assume that 24 days after testing positive for the virus, survivors can be considered recoveries.

Recoveries are calculated as cases minus deaths with a lag of 24 days. Daily cases and deaths are averages of the seven days ending on the stated date. Recoveries are # of cases from 24 days earlier minus # of daily deaths on the stated date. Since both testing and reports of Covid deaths were sketchy in the beginning, this graph begins with daily deaths as of April 24, 2020 compared to cases reported on March 31, 2020. Another view of the data is shown below.

The scale of testing has increased and has now reached 40,000 a day, while positive tests (cases) are dwindling.  The shape of the recovery curve resembles the case curve lagged by 24 days, since death rates are a small portion of cases.  The recovery rate has grown from 83% to 98% steady over the last 5 days.  This approximation surely understates the number of those infected with SAR CV2 who are healthy afterwards, since antibody studies show infection rates multiples higher than confirmed positive tests. In absolute terms, cases are now down to 320 a day and deaths 20 a day, while estimates of recoveries are 804 a day.

Summary of Canada Covid Epidemic

It took a lot of work, but I was able to produce something akin to the Dutch advice to their citizens.

The media and governmental reports focus on total accumulated numbers which are big enough to scare people to do as they are told.  In the absence of contextual comparisons, citizens have difficulty answering the main (perhaps only) question on their minds:  What are my chances of catching Covid19 and dying from it?  The map shows a lot of cases, and the chart looks like an hockey stick, going upward on a straight line. So why do I say canadians are safer than it looks like from such images?

First let’s look at daily numbers to see where we are in this process.  All the statistics come from Canada Public Health Coronavirus disease (COVID-19): Outbreak update.

By showing daily tests, new cases and reported deaths, we can see how the outbreak has built up, peaked and declined over the last 3 months.  The green line shows how testing steadily grew up to a daily rate of 40,000 (all numbers are smoothed with 7 day averages ending with the stated date.) Note that the curve is now descending after peaking at 1800 on April 22, now down to 320 new cases per day.  This lower rate of infections is despite the highest rate of testing since the outbreak began. Deaths have also peaked at 177 on May 6, down to 20 on June 30. The percentage of people testing positive is down to 3.8%, and deaths are 0.31% of the tests administered.

But it matters greatly where in Canada you live.  In the map at the top, Quebec is the dark blue province leading the nation in both cases and deaths.  Quebec has always celebrated being a distinct society, but not in this way. Below is the same chart for the Quebec epidemic from the same dataset. The province has about 23% of the national population and does about 26% of the tests.  But Quebec contributed 56% of the cases and 64% of the deaths, as of yesterday.  Here how the outbreak has gone in La Belle Province.

The Quebec graph is more lumpy showing cases peaking May 1-9, including several days inflated by data catchups. Cases have dropped off recently, from 1100 May 7 down to 82 yesterday.  Deaths are also slowing, declining from 110 on May 7 to 11 on June 30. The animation below shows the epidemic in Canada with and without Quebec statistics.

But clearly everywhere else in Canada, people are much safer than those living in Quebec.  So what is going on?

To enlarge image, open in new tab.

The graph shows that people in Quebec are dying in group homes, the majority in CHSLD (long term medical care facilities) and also in PSR (private seniors’ residences).  The huge majority of Quebecers in other, more typical living arrangements have very little chance of dying from this disease. Not even prisoners are much at risk.

Of course the other dimension is years of age, since this disease has punished mostly people suffering from end-of-life frailties.  A previous post reported that the Netherlands parliament was provided with the type of guidance everyone wants to see.

For canadians, the most similar analysis is this one from the Daily Epidemiology Update: :

The table presents only those cases with a full clinical documentation, which included some 2194 deaths compared to the 5842 total reported.  The numbers show that under 60 years old, few adults and almost no children have anything to fear.

Update May 20, 2020

It is really quite difficult to find cases and deaths broken down by age groups.  For Canadian national statistics, I resorted to a report from Ontario to get the age distributions, since that province provides 69% of the cases outside of Quebec and 87% of the deaths.  Applying those proportions across Canada results in this table. For Canada as a whole nation:

Age  Risk of Test +  Risk of Death Population
per 1 CV death
<20 0.05% None NA
20-39 0.20% 0.000% 431817
40-59 0.25% 0.002% 42273
60-79 0.20% 0.020% 4984
80+ 0.76% 0.251% 398

In the worst case, if you are a Canadian aged more than 80 years, you have a 1 in 400 chance of dying from Covid19.  If you are 60 to 80 years old, your odds are 1 in 5000.  Younger than that, it’s only slightly higher than winning (or in this case, losing the lottery).

As noted above Quebec provides the bulk of cases and deaths in Canada, and also reports age distribution more precisely,  The numbers in the table below show risks for Quebecers.

Age  Risk of Test +  Risk of Death Population
per 1 CV death
0-9 yrs 0.13% 0 NA
10-19 yrs 0.21% 0 NA
20-29 yrs 0.50% 0.000% 289,647
30-39 0.51% 0.001% 152,009
40-49 years 0.63% 0.001% 73,342
50-59 years 0.53% 0.005% 21,087
60-69 years 0.37% 0.021% 4,778
70-79 years 0.52% 0.094% 1,069
80-89 1.78% 0.469% 213
90  + 5.19% 1.608% 62

While some of the risk factors are higher in the viral hotspot of Quebec, it is still the case that under 80 years of age, your chances of dying from Covid 19 are better than 1 in 1000, and much better the younger you are.

What Climate Crisis?


Dr. D.E. Koelle published in EIKE, here in English translation: Where’s the “climate crisis”? Excerpts in italics with my bolds.

Today it can be found in the brains of (unfortunately too many) people who have a pronounced ignorance of climate – what it is and what it meant in the past.

But unfortunately there are also incomprehensible statements by “climate experts” who should actually know better. The GEOMAR staff member Prof. Dr. Katja Matthes and his designated chief, in a mirror interview (in issue 21/2020) on the climate issue under the obviously inevitable title “Corona crisis as an opportunity” states that the climate is “dramatic”. And that only a reduction in CO2 emissions and even its “artificial” removal from the atmosphere is necessary to limit a further temperature increase of 1.5 or 2 ° C. This means that, in accordance with the IPCC dogma, it sees only CO2 as a climate factor and ignores all other climate influencing factors, especially the natural climate fluctuations that have occurred for millions and thousands of years.

In any case, there is no factual reason for a “climate drama” – quite the contrary: in the past (before the existence of mankind) there were repeated temperature fluctuations between 0 ° C and 28 ° C – today we are around 14.5 ° C – exactly in the middle between the extremes, ie it couldn’t be better. Today we have the best possible, the optimal climate, as the Wikipedia diagram shows:

Figure 2: The temperature history of the earth in the past 500 million years. It shows tremendous climate change in the past (without people !!) and a perfect mean temperature with fluctuations of only ± 1 ° C in the past 10,000 years. It couldn’t be better.

What happened that such a climate hysteria could occur, as it was spread in the media in competition – from CO2 as a “climate killer” to “climate catastrophe” and “doomsday”?

The global temperature has actually increased by 1 ° C in the last 100 years! A degree C. Incredible!

Only very simple types can believe or expect that nature can / must deliver the exact same temperatures every year. There are about a dozen climate-influencing factors: long-term, medium-term and short-term, only CO2 is not one of them. There is no evidence of this in Earth’s climate history. Rather, the reverse applies:

Global warming increases the CO2 level in the atmosphere through outgassing from the oceans. Warmer water can store less CO2. And since it is known that 50 times more CO2 is stored in the oceans than in the atmosphere today, this effect has often occurred in the past. Apparently some people have mixed up here.

Climate change, perceived primarily as temperature fluctuations, is by no means a new phenomenon caused by humanity (CO2 emissions), as some climate charlatans and ideologists want to make us believe (in their fight against capitalism and industrial society), but a completely normal natural phenomenon of our planet since its existence, just like earthquakes and volcanic eruptions – and no one can do anything about it! The “fight against climate change” is reminiscent of Don Quixote.

In the past 8000 years, the mean global temperature has fluctuated regularly by +/- one degree C (Eddy cycle of approx. 1070 years).

And that was as much the case 8,000 years ago as it is today! There is no recognizable anthropogenic influence. On the contrary: The regular temperature maxima of the Eddy cycle have fallen by 0.7 ° C since the Holocene maximum 8000 years ago, despite the continuous increase in CO2 from 200 to 400 ppm, which according to the IPCC hypothesis is an increase around + 3 ° C should have resulted. The IPCC, which has propagated the CO2 hypothesis, has so far been unable to provide any factual or historical evidence for it – other than “confidence”. This confirms that the IPCC is not a scientific, but a political institution where scientists are misused for ideological and political goals. His reports must e.g. Before publication, be checked by the participating governments and modified according to their wishes. A process that only exists in climate research, which has largely lost its formerly scientific character.

The above temperature diagram of the last 3200 years clearly shows the dominance of the natural 1000-year cycle, as it has occurred for at least 8000 years. We have just passed the last maximum and in the future it will go down again (if astrophysics has not changed) and is completely independent of the evolution of CO2. This has doubled in the last 8000 years from 200 to 400 ppm, but the temperature of the maxima has decreased by 0.7 ° C (instead of rising by 3 ° C according to the IPCC theory!). In fact, the current CO2 level is among the lowest in the history of the earth, which reached values ​​of 4000 to 6000 ppm several times – without causing damage – only much stronger plant growth. We owe this to the coal deposits on earth. If CO2 is released by combustion today, it is nothing more than the CO2 that the plants then extracted from the atmosphere.

Note: I used an online translate utility for this English text, so blame any errors on Mr. Google.


Pandemic Update: Virus Weaker, HCQ Stronger

In past weeks there have been anecdotal reports from frontline doctors that patients who would have been flattened fighting off SARS CV2 in April are now sitting up and recovering in a few days. We have also the statistical evidence in the US and Sweden, as two examples, that case numbers are rising while Covid deaths continue declining. One explanation is that the new cases are younger people who have been released from lockdown (in US) with stronger immune systems. But it may also be that the virus itself is losing potency.

In the past I have noticed theories about the origin of the virus, and what makes it “novel.” But when the scientist who identified HIV weighs in, I pay particular attention. The Coronavirus Is Man Made According to Luc Montagnier the Man Who Discovered HIV. Excerpts in italics with my bolds.

Contrary to the narrative that is being pushed by the mainstream that the COVID 19 virus was the result of a natural mutation and that it was transmitted to humans from bats via pangolins, Dr Luc Montagnier the man who discovered the HIV virus back in 1983 disagrees and is saying that the virus was man made.

Professor Luc Montagnier, 2008 Nobel Prize winner for Medicine, claims that SARS-CoV-2 is a manipulated virus that was accidentally released from a laboratory in Wuhan, China. Chinese researchers are said to have used coronaviruses in their work to develop an AIDS vaccine. HIV RNA fragments are believed to have been found in the SARS-CoV-2 genome.

“With my colleague, bio-mathematician Jean-Claude Perez, we carefully analyzed the description of the genome of this RNA virus,” explains Luc Montagnier, interviewed by Dr Jean-François Lemoine for the daily podcast at Pourquoi Docteur, adding that others have already explored this avenue: Indian researchers have already tried to publish the results of the analyses that showed that this coronavirus genome contained sequences of another virus, … the HIV virus (AIDS virus), but they were forced to withdraw their findings as the pressure from the mainstream was too great.

To insert an HIV sequence into this genome requires molecular tools

In a challenging question Dr Jean-François Lemoine inferred that the coronavirus under investigation may have come from a patient who is otherwise infected with HIV. No, “says Luc Montagnier,” in order to insert an HIV sequence into this genome, molecular tools are needed, and that can only be done in a laboratory.

According to the 2008 Nobel Prize for Medicine, a plausible explanation would be an accident in the Wuhan laboratory. He also added that the purpose of this work was the search for an AIDS vaccine.

In any case, this thesis, defended by Professor Luc Montagnier, has a positive turn.

According to him, the altered elements of this virus are eliminated as it spreads: “Nature does not accept any molecular tinkering, it will eliminate these unnatural changes and even if nothing is done, things will get better, but unfortunately after many deaths.”

This is enough to feed some heated debates! So much so that Professor Montagnier’s statements could also place him in the category of “conspiracy theorists”: “Conspirators are the opposite camp, hiding the truth,” he replies, without wanting to accuse anyone, but hoping that the Chinese will admit to what he believes happened in their laboratory.

To entice a confession from the Chinese he used the example of Iran which after taking full responsibility for accidentally hitting a Ukrainian plane was able to earn the respect of the global community. Hopefully the Chinese will do the right thing he adds. “In any case, the truth always comes out, it is up to the Chinese government to take responsibility.”

Implications: Leaving aside the geopolitics, this theory also explains why the virus weakens when mutations lose the unnatural pieces added in the lab. Since this is an RNA (not DNA) sequence mutations are slower, but inevitable. If correct, this theory works against fears of a second wave of infections. It also gives an unintended benefit from past lockdowns and shutdowns, slowing the rate of infections while the virus degrades itself.

HCQ +AZ Survives Attack from Big Pharma with Growing Results

For background on the bogus big data studies intended to discredit HCQ since it threatens profits from new pharmaceuticals, see: HCQ Hit Job by Big Pharma Data Miners

The Palmer Foundation provides a portal for studies regarding HCQ and Coronavirus. For exmple this latest from the Marseille group Outcomes of 3,737 COVID-19 patients treated with hydroxychloroquine/ azithromycin and other regimens in Marseille, France: A retrospective analysis.  Excerpts with my bolds.

Overview

Our study has a retrospective observational design, and such characteristics may be presented as a limitation of the study [37]. Patients were not enrolled in perfectly homogeneous groups with regards to demographics, chronic conditions and clinical status at admission.

Treatments were not allocated randomly but according to the clinical status of patients and contra-indications to drugs, or preference of patients with regards to therapeutic options. As we have aimed to tests and treat all positive patients presenting to our institution, the patient population comprised a majority of patients with mild diseases and a minority of patients with severe disease, with the former managed at our day-care hospital and the latter as in-patients.

We enrolled all patients including those who started their treatment with delay or stopped it early. Because of the crisis situation we had to face, clinical, virological and radiological data were not documented in 100% patients. However, missing data may also be a limitation of RCT. Furthermore, RCT are not useful in the context of an emerging pandemic when commercially available drugs known to be active in vitro are available for immediate treatment [38,39].

Our approach of early diagnosis and care of as many patients as possible results in much lower mortality rates than other strategies. The test-and-treat strategy adopted in Marseille also seems capable of shortening the duration of the outbreak when compared to data from France overall by identifying infected people and reducing their viral shedding duration.

In fact, more people were tested in Marseille than in most other areas, and the outbreak lasted only 9 weeks. In addition, patients under HCQ-AZ treatment for at least 3 days had a better clinical outcome, based on mortality rates among patients >60 years, less transfer to ICU and shorter length of stay at the hospital, and these patients also had a shorter duration of viral shedding than patients who did not receive this drug combination.

Finally, a global strategy for the management of the COVID-19 outbreak may help to limit both the number of cases and fatalities and guide countries where this pandemic has not yet peaked.

Discussion

We confirm here that COVID-19 has several evolutionary stages (Fig. 4). After the incubation period, the first clinical stage, including LRTI and URTI symptoms, is associated with a high viral load and the occurrence of early lung lesions on LDCT, for which it is reasonable to use a compound with antiviral activity. HCQ-AZ has demonstrated its effectiveness in reducing viral shedding [6] and preventing disease progression and death particularly when prescribed at early stages [10,27,28]. Other antiviral compounds, including remdesivir and hyperimmune gamma globulins [29], may have antiviral activity at an early stage of the disease, although there is to date no convincing published report, comparable to that of oseltamivir at the early stage of influenza [30]. Taking into account the association between low blood zinc levels and poor clinical outcomes, zinc supplementation should be also considered, as recently reported [31]. However, the choice of the best treatment should be made according to its safety profile, which is much better for HCQ-AZ than for remdesivir (adverse events leading to cessation of treatment in 0.3% in our study vs. 12% for remdesivir [12]). Nevertheless, we were surprised by the large discrepancy on efficacy and toxicity of HCQ in recent studies compared to ours [32]. As a matter of fact, all patients reported here have been followed by the physicians authors named in our study. Altogether, we found only 0.67% of QTc prolongations and no death related to treatment. In our opinion, this excellent safety profile of HCQ-AZ in our real-life medical experience much better reflects the reality than registry studies such as those recently retracted from high profile medical journals [9].

Fig. 4. Evolutionary stages of SARS-CoV-2 infection, including major clinical and biological features and possible therapies

The second stage includes both an immune reaction and the persistence of the virus [1]. At this stage, extreme caution should be required for patients with risk factors (particularly hypertension), severe clinical presentation (NEWS CoV ≥ 5), intermediate-to-severe lesions in LDCT and biological parameters such as lymphocytopenia, eosinopenia or D-dimers higher than 0.5 μg/L. Systemic coagulation activation and thrombotic complications were probably overlooked in COVID-19 patients. In our study, the youngest person who died was 60 years old, and the death was associated with generalized thrombosis. A recent study reported that among 198 hospitalized COVID-19 patients, 39 (20%) were diagnosed with venous thromboembolism (VTE), and of these patients 25 (13%) had symptomatic VTE, despite routine thrombosis prophylaxis [33]. The third stage consists of an inflammatory stage linked to pro-inflammatory cytokine release with a high risk of transfer to ICU [34]. Moreover, the strong specific antibody response observed at this stage questions the use of hyperimmune gamma globulins [29]. The fourth stage with acute respiratory distress syndrome (ARDS) is characterised by pulmonary tissue injury and requires supportive intensive care. To date, no drug has proven effective at this stage. While most surviving patients may be definitely cured, an unknown proportion may evolve towards pulmonary fibrosis constituting the late stage of the disease, as described by Chinese physicians caring for COVID-19 patients and as previously described for severe acute respiratory syndrome (SARS) in 2003 [35]. Long-term follow-up aiming to screen for fibrosis will be the next challenge in the management of COVID-19. Our experience and suggestions regarding the various stages of COVID-19 are summarized in Fig. 4.

Lest anyone think this appreciation of HCQ+AZ is limited to France, see these reports, among others:

Hydroxychloroquine: Turkey continues using drug despite WHO pause

Spain will continue to use hydroxychloroquine against the coronavirus despite the French ban and the doubts of the WHO

Brazil: Doctor says Hydroxychloroquine should be initial treatment

Forbes Cancels Michael Shellenberger

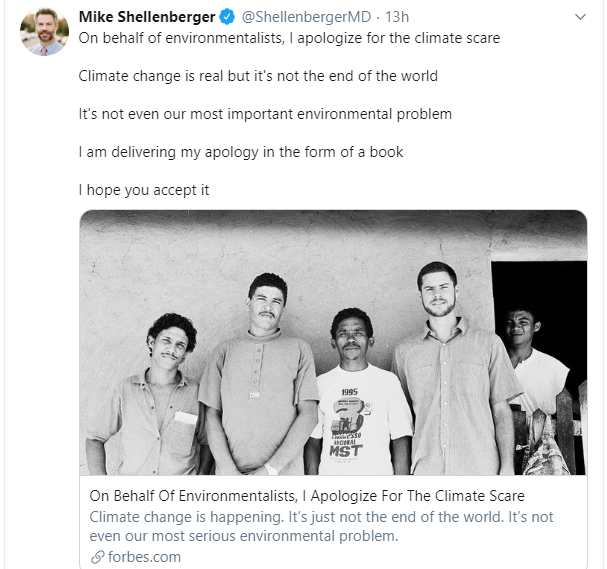
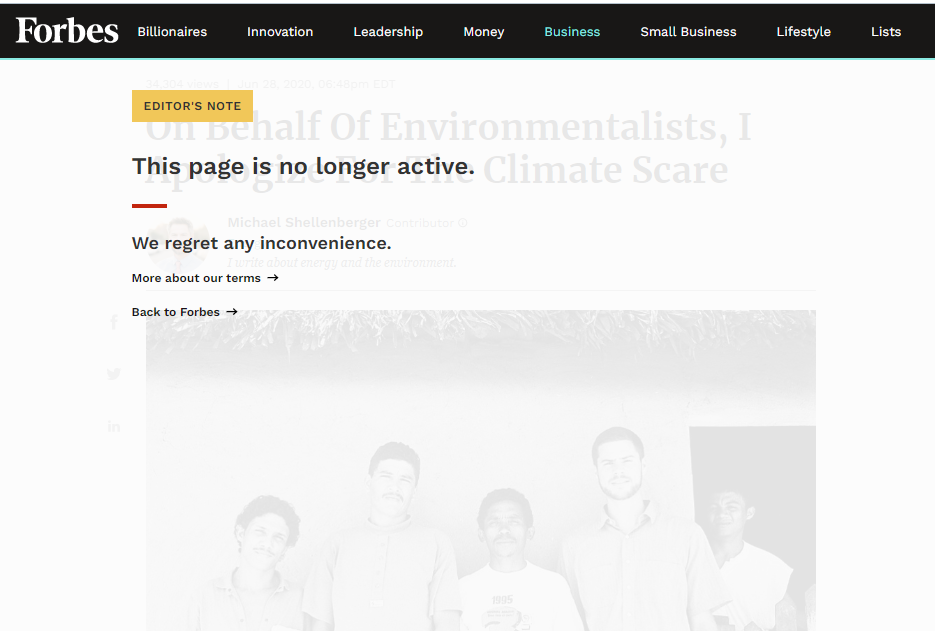
Earlier this morning I read a great article by Shellenberger at Forbes.  Above is his tweet.  When I returned to Forbes to read and post on the article, here is what I saw:

While I look for the text now gone missing, here are some overviews of the book, and why activists will want it suppressed. Update:  WUWT archived the article before it was revoked (here)

See Update at End, July 10, 2020 Extract from Book

‘Apocalypse Never’ Review: False Gods for Lost Souls
Environmentalism offers emotional relief and spiritual satisfaction, giving its adherents a sense of purpose and transcendence. Source: John Tierney at Washington Post (paywalled)

Amazon Book Description

Climate change is real but it’s not the end of the world. It is not even our most serious environmental problem.

Michael Shellenberger has been fighting for a greener planet for decades. He helped save the world’s last unprotected redwoods. He co-created the predecessor to today’s Green New Deal. And he led a successful effort by climate scientists and activists to keep nuclear plants operating, preventing a spike of emissions.

But in 2019, as some claimed “billions of people are going to die,” contributing to rising anxiety, including among adolescents, Shellenberger decided that, as a lifelong environmental activist, leading energy expert, and father of a teenage daughter, he needed to speak out to separate science from fiction.

Despite decades of news media attention, many remain ignorant of basic facts. Carbon emissions peaked and have been declining in most developed nations for over a decade. Deaths from extreme weather, even in poor nations, declined 80 percent over the last four decades. And the risk of Earth warming to very high temperatures is increasingly unlikely thanks to slowing population growth and abundant natural gas.

Curiously, the people who are the most alarmist about the problems also tend to oppose the obvious solutions.

What’s really behind the rise of apocalyptic environmentalism? There are powerful financial interests. There are desires for status and power. But most of all there is a desire among supposedly secular people for transcendence. This spiritual impulse can be natural and healthy. But in preaching fear without love, and guilt without redemption, the new religion is failing to satisfy our deepest psychological and existential needs.

Review from Charles Battig

Michael Shellenberger has green activist credentials going back to his high school years. Yet over the ensuing years, he has had an environmental reality epiphany which now has manifested itself most clearly in his recent book “Apocalypse Never,” and with his starting the ecomodernism movement.

The subtitle of the book, “Why Environmental Alarmism Hurts Us All,” echoes the similar conclusions of Moore and Lomborg.

Schellenberger had a few road bumps on the way to his current reality check.

Notable was his 2002 support of the “New Apollo Project,” which called for a major global science and economics research program to make carbon-free baseload electricity less costly than electricity from coal by the year 2025 at an expenditure of $150 billion over a decade.

The Obama administration adopted many of the renewable energy proposals, but Schellenberger documents that much of the money went to “companies that enriched donors to the Obama campaign” but failed to produce the promised renewable energy advances.

Disillusionment gave way to reality, and in 2017, Shellenberger told the Australian:

“Like most people, I started out pretty anti-nuclear. I changed my mind as I realized you can’t power a modern economy on solar and wind… All they do is make the electricity system chaotic and provide greenwash for fossil fuels.”

He has made numerous efforts to support nuclear power.

His current book skewers many of the claims of eco-environmentalists, including mass extinctions, saving of the whales by Greenpeace, waste plastic fouling the ocean for thousands of years, and increases in extreme weather events.

He reflects upon his early devotion to environmentalism as a manifestation of “underlying anxiety and unhappiness in my own life that had little to do with climate change or the state of the natural environment.”

It became a quasi-religion offering “emotional relief” and “spiritual satisfaction” for those, like him, who may have lost the guidance of traditional spiritual faiths.

Schellenberg concludes with the observation that “the trouble with the new environmental religion is that it has become increasingly apocalyptic, destructive, and self-defeating.”

So here are three environmentalists with different degrees of eco-activism in their past, but all now willing to speak out against the incessant climate propaganda of human-related guilt, the purveyors of anxiety, and the poisoners of childhood joy and wonder.

Climate change is the norm; it is not mankind’s original sin. The readers here are encouraged to read the works of these climate realists.

Book burning scene from movie version of Fahrenheit 451.

Excerpt from now inaccessible article (posted at GWPF):

I may seem like a strange person to be saying all of this. I have been a climate activist for 20 years and an environmentalist for 30.

But as an energy expert asked by Congress to provide objective expert testimony, and invited by the Intergovernmental Panel on Climate Change (IPCC) to serve as Expert Reviewer of its next Assessment Report, I feel an obligation to apologize for how badly we environmentalists have misled the public.

Here are some facts few people know:

*  Humans are not causing a “sixth mass extinction”

* The Amazon is not “the lungs of the world”

* Climate change is not making natural disasters worse

* Fires have declined 25% around the world since 2003

* The amount of land we use for meat — humankind’s biggest use of land — has declined by an area nearly as large as Alaska

* The build-up of wood fuel and more houses near forests, notclimate change, explain why there are more, and more dangerous, fires in Australia and California

* Carbon emissions have been declining in rich nations for decades and peaked in Britain, Germany and France in the mid-seventies

* Adapting to life below sea level made the Netherlands rich not poor

* We produce 25% more food than we need and food surpluses will continue to rise as the world gets hotter

* Habitat loss and the direct killing of wild animals are bigger threats to species than climate change

* Wood fuel is far worse for people and wildlife than fossil fuels

* Preventing future pandemics requires more not less “industrial” agriculture

In reality, the above facts come from the best-available scientific studies, including those conducted by or accepted by the IPCC, the Food and Agriculture Organization of the United Nations (FAO), the International Union for the Conservation of Nature (IUCN) and other leading scientific bodies.

Some people will, when they read this imagine that I’m some right-wing anti-environmentalist. I’m not. At 17, I lived in Nicaragua to show solidarity with the Sandinista socialist revolution. At 23 I raised money for Guatemalan women’s cooperatives. In my early 20s I lived in the semi-Amazon doing research with small farmers fighting land invasions. At 26 I helped expose poor conditions at Nike factories in Asia.

I became an environmentalist at 16 when I threw a fundraiser for Rainforest Action Network. At 27 I helped save the last unprotected ancient redwoods in California. In my 30s I advocated renewables and successfully helped persuade the Obama administration to invest $90 billion into them. Over the last few years I helped save enough nuclear plants from being replaced by fossil fuels to prevent a sharp increase in emissions

Until last year, I mostly avoided speaking out against the climate scare. Partly that’s because I was embarrassed. After all, I am as guilty of alarmism as any other environmentalist. For years, I referred to climate change as an “existential” threat to human civilization, and called it a “crisis.”

But mostly I was scared. I remained quiet about the climate disinformation campaign because I was afraid of losing friends and funding. The few times I summoned the courage to defend climate science from those who misrepresent it I suffered harsh consequences. And so I mostly stood by and did next to nothing as my fellow environmentalists terrified the public.

Update July 10, 2020

An extended extract approved by Shellenberger is posted at Climate Change Not the End of the World (Shellenberger)

Summary in My Words:

There is no crisis requiring these climate policies.

If there were a crisis, these policies will not help.

Implementing these policies will create a social and economic crisis.

Update June 30, 2020

Michael Shellenberger realized he has been cancelled by Forbes and has reposted his article at EnvironmentalProgress: https://environmentalprogress.org/big-news/2020/6/29/on-behalf-of-environmentalists-i-apologize-for-the-climate-scare

In a comment below Rob Brantly adds some contextual facts about Forbes from zerohedge:

It is notable that the Forbes family no longer controls the magazine as a majority stake was sold in 2014 to a “group of Asian investors known as Integrated Whale Media. The new ownership team is led by Hong Kong-based Integrated Asset Management, founded by Tak Cheung Yam. Another investor with a significant stake is Singapore businessman Wayne Hsieh, the co-founder of Asustek Computer” (NY Post).

This group is either left-leaning or is not willing to alienate the establishment status quo. Forbes publishes the article — and then gets a quick rebuke from the Asians.

Similarly, a few years ago the Financial Times was bought by Nikkei Inc., the dominant Japanese financial publisher. It, too, is left-leaning by American standards — and the FT, which was already left-of-center, has clearly become more liberal since the ownership change.

Get a Grip: Street Theater vs. Real Life

In the past era of honest mass media, journalists took seriously their responsibility to not only report news but to place events in an historical context.  When the reporting is limited to a few facts, the audience becomes trapped in the writers’ narrative, lacking the big picture to interpret for themselves the meaning and implications of happenings.  Perpetrating a myopic view of situations gives rise to criticisms of media bias and “fake news.”

The most recent example is the uprisings in US cities since the death of George Floyd.  Kurt Schlichter provides the bigger picture in his insightful assessment of the BLM-led protests in US city streets in his Townhall article This Leftist Tantrum Is an Information Operation and Trump Is Winning It. Excerpts in italics with my bolds

It’s certainly frustrating to watch a pack of reeking leftist scumbags declare a portion of an American city an “autonomous zone” – what is it with Democrats and their secession fetish? – but do not get frustrated because Donald Trump has not sent the 101st Airborne in to powerwash the human grunge from Seattle’s feces-bedecked streets.

That’s what the Democrats want. And Trump – a better strategic thinker than all the media geniuses, hack politicians, and Afghan War-losing generals who cry about him – is not only not going to give them the victory they crave. He’s going to jam their cheesy plan down their throats.

The libs’ plan to win in November corresponds to Trump’s plan to crush them yet again. Skeptical? Consider this. In the five years since he rode down that escalator bringin’ hell with him, how many times have they come at Trump and won? Zero. He’s spent half a decade on the edge of doom and he’s still here. Why would you think that the walls are suddenly closing in now? You shouldn’t.

Let’s understand the strategic scenario. The long-term strategic objective of the leftists is to turn the United States into Venezuela, and they want to be Maduro. The major strategic objective that will put them in position to do so is victory in the November elections. Everything happening right now is part of their overall strategy to achieve that objective. But what kind of operation are they using to achieve that objective? There are two types of operations relevant here – kinetic and information. A kinetic operation is actual warfare. It’s violence designed to defeat the enemy and cause his surrender by either physically destroying him or occupying his territory and compelling surrender. An information operation is designed to affect the perceptions, and thereby the actions, of the target.

Kinetic ops tend to do something to the enemy;
an info op tends to get the target to do something to himself.

Elections are usually information operations. They attempt to build a narrative and play on perceptions and cause the target to take the action that will lead to victory. That is, get the target (the electorate) vote for the candidate the info operator wants elected.

Okay, so what is the 2020 elections, with the rioting, vandalism, violence and occupations?

This still an information operation, not a kinetic one.

They want to convince us we are powerless, that everyone else supports their commie agenda, that we cannot win. Their tactics are designed to create that impression and crush our morale. These include the 24/7 media hype, the outright media lies, the movie stars with their dumb PSAs, the staged statue attacks, the corporate solidarity proclamations, the social media cancellations, and the craven kneeling by people who are supposed to stand up for us. But another tactic, familiar to any student of insurgencies, is to provoke an overreaction by those in power in order to undermine its moral authority. They want is to make us (including the president) think this is a kinetic operation, and get our side to make fundamental strategic errors by failing to recognize the true nature of the threat. They hope that such a mismatch between perception and reality will then lead to gravely damaging blunders. One of those would be Trump succumbing to his legit frustration and sending in a bunch of federal troops to crack skulls in Seattle.

Defining this insurgency as a kinetic operation supports the leftists’ information operation goal of making Americans perceive the situation as out of control, of there being chaos, and of making the election of Grandpa Badfinger being the only thing that will resolve the situation. But there is no kinetic situation to resolve – at least none that is strategically significant in a kinetic sense. Despite the hype, the protests may have involved a peak of 2 million people across the country – out of 330 million. That’s nothing kinetically; it’s significant informationally because it is pushed by so many cultural influencers. The scurvy scumbags of Antifa hold essentially no ground except the turf they are physically standing on at the moment, and that is minuscule. Even the hilarious Road Warrior Republic of Seattle is not even a rounding error of a rounding error in terms of US territory. It’s significant only in the context of an information operation.

Many of us cons are furious that Trump is “doing nothing.” This is the wrong thing to think. Trump is only doing nothing if this is a kinetic operation; because this is an information operation, not going kinetic (sending in the troops) is doing something. And in fact, Trump is employing the law enforcement component of his kinetic assets by having the feds wait and arrest Antifa types after the protests end, and hitting them with hardcore federal rioting-related charges. Previously, they would get ticketed and released; now, looking at a five-to-ten stretch, the lawyers their daddies hired to get these sunshine anarchists out of their beefs are going to be advising them to roll over so they can start back up at Cornell in September and not at Leavenworth.

Trump can and should let Seattle’s problem be Seattle’s problem.

Understand that the leftist establishment would like nothing better than for Trump to go kinetic. That’s why it is baiting him, and hoping that those of us who are sick of these Lil’ Red Guards will pressure him into dropping in the paratroopers to bust some heads and – oh please, oh please, oh please – get caught on video Kent Stating up a batch of fresh new martyrs. Trump’s too smart for that, and frankly the establishment is too dumb and undisciplined to carry it out. The media shot its wad on the hyperbolic reaction to clearing out the park in front of the White House, demonstrating that even the most gentle and restrained of kinetic actions was going to get transmogrified into Hitler’s blitz across the Low Countries. And those generals screwed-up too, bad. They should have waited to wring their hands over Trump’s violent and dangerous employment of the military until he actually violently and dangerously employed the military. A bunch of allegedly (but not actually) neutral and nonpartisan military figures with heaps of establishment street cred coming down on POTUS in the wake of a bloodbath could have had a devastating political effect, but they pulled the trigger too early. Mattis and Milley and the rest of the medal men we’re supposed to think are superb strategic operators, but who still haven’t won the war against a pack of turbaned banditos after about 20 years, screwed-up yet again. They were supposed to deliver an info op kill shot to define Trump to the masses as a bloody tyrant and instead got just one news cycle of play with the Twitter blue checks. The only casualty was not Trump’s rep, but their own credibility with anyone outside of the Beltway.

Right now, the American people are seeing chaos. But chaos does not necessarily play against Trump in the long term. Biden is trapped, trying to nuance his unsteady carcass through the conflict between the Democrats’ “’Defund the Police’ means ‘Reform the Police’” faction and the “No, ‘Defund the Police’ really means ‘Defund the Police’” faction. All the while, Trump is tweeting “LAW AND ORDER!”

Do you think this is all helping the Dems? If you do, stop watching MSNBCNN. Except among Hollywood jerks, urban hipsters and whiny woke wine women from Westchester, the attack on order means “Advantage: Trump.” You can see the results if you look behind the media curtain. Remember how the media had a collective panty-wetting over the meaningless Georgia primary and the GOP’s alleged voter suppression? Did you wonder why the media felt it was such a big deal? The answer is in the actual results, which you did not hear about if you listen to the garbage mainstream media. Trump, who had the nomination sewn up, crushed Biden and the rest of the Dems combined in votes. Wait, didn’t all the smart people tell us that Georgia, under the carb-curious leadership of Governor Stacy Abrams, was turning blue?

Yeah, right.

Trump is winning this information battle. Conservative Americans – and moderate Americans who want law and order – can’t wait to vote against defunding the police, rioting and appeasement. The Silent Majority is being roused again.

American Soviet Mentality

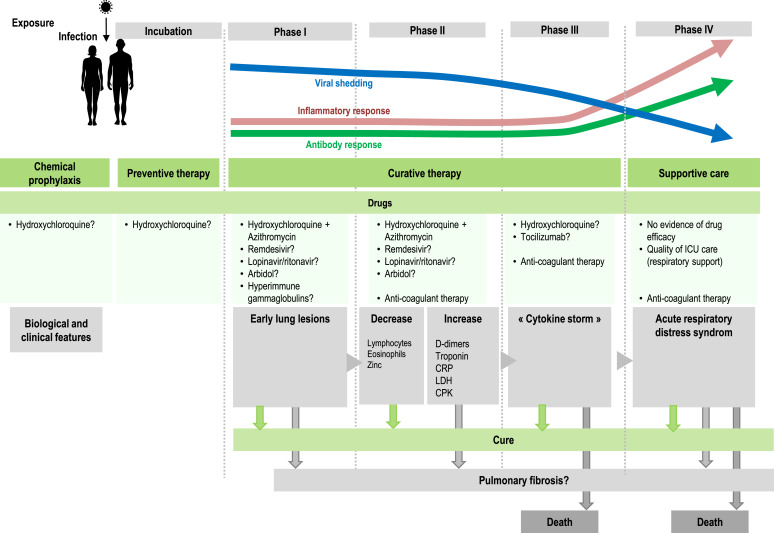
Izabella Tabarovsky draws on her experience of Soviet Russia to expose the cultural revolution currently attacking the roots of American civil society.  Her article at the Tablet is The American Soviet Mentality. Excerpts in italics with my bolds.

Collective demonization invades our culture

Russians are fond of quoting Sergei Dovlatov, a dissident Soviet writer who emigrated to the United States in 1979: “We continuously curse Comrade Stalin, and, naturally, with good reason. And yet I want to ask: who wrote four million denunciations?” It wasn’t the fearsome heads of Soviet secret police who did that, he said. It was ordinary people.

Collective demonizations of prominent cultural figures were an integral part of the Soviet culture of denunciation that pervaded every workplace and apartment building. Perhaps the most famous such episode began on Oct. 23, 1958, when the Nobel committee informed Soviet writer Boris Pasternak that he had been selected for the Nobel Prize in literature—and plunged the writer’s life into hell. Ever since Pasternak’s Doctor Zhivago had been first published the previous year (in Italy, since the writer could not publish it at home) the Communist Party and the Soviet literary establishment had their knives out for him. To the establishment, the Nobel Prize added insult to grave injury.

None of those who joined the chorus of condemnation, naturally, had read the novel—it would not be formally published in the USSR until 30 years later. But that did not stop them from mouthing the made-up charges leveled against the writer. It was during that campaign that the Soviet catchphrase “ne chital, no osuzhdayu”—“didn’t read, but disapprove”—was born: Pasternak’s accusers had coined it to protect themselves against suspicions of having come in contact with the seditious material. Days after accepting the Nobel Prize, Pasternak was forced to decline it. Yet demonization continued unabated.

Some of the greatest names in Soviet culture became targets of collective condemnations—composers Dmitry Shostakovich and Sergei Prokofiev; writers Anna Akhmatova and Iosif Brodsky; and many others. Bouts of hounding could go on for months and years, destroying people’s lives, health and, undoubtedly, ability to create. (The brutal onslaught undermined Pasternak’s health. He died from lung cancer a year and a half later.) But the practice wasn’t reserved for the greats alone. Factories, universities, schools, and research institutes were all suitable venues for collectively raking over the coals a hapless, ideologically ungrounded colleague who, say, failed to show up for the “voluntary-obligatory,” as a Soviet cliché went, Saturday cleanups at a local park, or a scientist who wanted to emigrate. The system also demanded expressions of collective condemnations with regards to various political matters: machinations of imperialism and reactionary forces, Israeli aggression against peaceful Arab states, the anti-Soviet international Zionist conspiracy. It was simply part of life.

Twitter has been used as a platform for exercises in unanimous condemnation
for as long as it has existed.

Countless careers and lives have been ruined as outraged mobs have descended on people whose social media gaffes or old teenage behavior were held up to public scorn and judged to be deplorable and unforgivable. But it wasn’t until the past couple of weeks that the similarity of our current culture with the Soviet practice of collective hounding presented itself to me with such stark clarity. Perhaps it was the specific professions and the cultural institutions involved—and the specific acts of writers banding together to abuse and cancel their colleagues—that brought that sordid history back.

On June 3, The New York Times published an opinion piece that much of its progressive staff found offensive and dangerous. (The author, Republican Sen. Tom Cotton, had called to send in the military to curb the violence and looting that accompanied the nationwide protests against the killing of George Floyd.) The targets of their unanimous condemnation, which was gleefully joined by the Twitter proletariat, which took pleasure in helping the once-august newspaper shred itself to pieces in public, were New York Times’ opinion section editor James Bennet, who had ultimate authority for publishing the piece, though he hadn’t supervised its editing, and op-ed staff editor and writer Bari Weiss (a former Tablet staffer).

Weiss had nothing to do with editing or publishing the piece. On June 4, however, she posted a Twitter thread characterizing the internal turmoil at the Times as a “civil war” between the “(mostly young) wokes” who “call themselves liberals and progressives” and the “(mostly 40+) liberals” who adhere to “the principles of civil libertarianism.” She attributed the behavior of the “wokes” to their “safetyism” worldview, in which “the right of people to feel emotionally and psychologically safe trumps what were previously considered core liberal values, like free speech.”  See Update: Stories vs. Facts

It was just one journalist’s opinion, but to Weiss’ colleagues her semi-unflattering description of the split felt like an intolerable attack against the collective. Although Weiss did not name anyone in either the “woke” or the older “liberal” camp, her younger colleagues felt collectively attacked and slandered. They lashed out. Pretty soon, Weiss was trending on Twitter.

As the mob’s fury kicked into high gear, the language of collective outrage grew increasingly strident, even violent.

Goldie Taylor, writer and editor-at-large at The Daily Beast, queried in a since-deleted tweet why Weiss “still got her teeth.” With heads rolling at the Times—James Bennet resigned, and deputy editorial page editor James Dao was reassigned to the newsroom—one member of the staff asked for Weiss to be fired for having bad-mouthed “her younger newsroom colleagues” and insulted “all of our foreign correspondents who have actually reported from civil wars.” (It was unclear how she did that, other than having used the phrase “civil war” as a metaphor.)

Mehdi Hasan, a columnist with the Intercept, opined to his 880,000 Twitter followers that it would be strange if Weiss retained her job now that Bennet had been removed. He suggested that her thread had “mocked” her nonwhite colleagues. (It did not.) In a follow-up tweet Hasan went further, suggesting that to defend Weiss would make one a bad anti-racist—a threat based on a deeply manipulated interpretation of Weiss’ post, yet powerful enough to stop his followers from making the mistake.

All of us who came out of the Soviet system bear scars of the practice of unanimous condemnation, whether we ourselves had been targets or participants in it or not. It is partly why Soviet immigrants are often so averse to any expressions of collectivism: We have seen its ugliest expressions in our own lives and our friends’ and families’ lives. It is impossible to read the chastising remarks of Soviet writers, for whom Pasternak had been a friend and a mentor, without a sense of deep shame. Shame over the perfidy and lack of decency on display. Shame at the misrepresentations and perversions of truth. Shame at the virtue signaling and the closing of rank. Shame over the momentary and, we now know, fleeting triumph of mediocrity over talent.

In a collectivist culture, one hoped-for result of group condemnations is control—both over the target of abuse and the broader society. When sufficiently broad levels of society realize that the price of nonconformity is being publicly humiliated, expelled from the community of “people of goodwill” (another Soviet cliché) and cut off from sources of income, the powers that be need to work less hard to enforce the rules.

For the regular people—those outside prestigious cultural institutions—participation in local versions of collective hounding was not without its benefits, either. It could be an opportunity to eliminate a personal enemy or someone who was more successful and, perhaps, occupied a position you craved. You could join in condemning a neighbor at your cramped communal flat, calculating that once she was gone, you could add some precious extra square meters to your living space.

The mobs that perform the unanimous condemnation rituals of today do not follow orders from above. But that does not diminish their power to exert pressure on those under their influence.

Those of us who came out of the collectivist Soviet culture understand these dynamics instinctively. You invoked the “didn’t read, but disapprove” mantra not only to protect yourself from suspicions about your reading choices but also to communicate an eagerness to be part of the kollektiv—no matter what destructive action was next on the kollektiv’s agenda. You preemptively surrendered your personal agency in order to be in unison with the group. And this is understandable in a way: Merging with the crowd feels much better than standing alone.

Americans have discovered the way in which fear of collective disapproval breeds self-censorship and silence, which impoverish public life and creative work. The double life one ends up leading—one where there is a growing gap between one’s public and private selves—eventually begins to feel oppressive. For a significant portion of Soviet intelligentsia (artists, doctors, scientists), the burden of leading this double life played an important role in their deciding to emigrate.

Those who join in the hounding face their own hazards. The more loyalty you pledge to a group that expects you to participate in rituals of collective demonization, the more it will ask of you and the more you, too, will feel controlled. How much of your own autonomy as a thinking, feeling person are you willing to sacrifice to the collective? What inner compromises are you willing to make for the sake of being part of the group? Which personal relationships are you willing to give up?

From my vantage point, this cultural moment in these United States feels incredibly precarious.

The practice of collective condemnation feels like an assertion of a culture that ultimately tramples on the individual and creates an oppressive society. Whether that society looks like Soviet Russia, or Orwell’s Nineteen Eighty-Four, or Castro’s Cuba, or today’s China, or something uniquely 21st-century American, the failure of institutions and individuals to stand up to mob rule is no longer an option we can afford.

Comment:  Precarious, indeed.  For Background, See Patriotism vs. Multiculturalism

2020 Update: Fossil Fuels ≠ Global Warming

gas in hands

Previous posts addressed the claim that fossil fuels are driving global warming. This post updates that analysis with the latest (2019) numbers from BP Statistics and compares World Fossil Fuel Consumption (WFFC) with three estimates of Global Mean Temperature (GMT). More on both these variables below.

WFFC

2019 statistics are now available from BP for international consumption of Primary Energy sources. 2019 Statistical Review of World Energy. 

The reporting categories are:
Oil
Natural Gas
Coal
Nuclear
Hydro
Renewables (other than hydro)

Note:  British Petroleum (BP) for the first time uses Exajoules to replace MToe (Million Tonnes of oil equivalents.) It is logical to use an energy metric which is independent of the fuel source. OTOH renewable advocates have no doubt pressured BP to stop using oil as the baseline since their dream is a world without fossil fuel energy.

From BP conversion table 1 exajoule (EJ) = 1 quintillion joules (1 x 10^18). Oil products vary from 41.6 to 49.4 tonnes per gigajoule (10^9 joules).  Comparing this annual report with previous years shows that global Primary Energy (PE) in MToe is roughly 24 times the same amount in Exajoules.  The conversion factor at the macro level varies from year to year depending on the fuel mix. The graphs below use the new metric.

This analysis combines the first three, Oil, Gas, and Coal for total fossil fuel consumption world wide. The chart below shows the patterns for WFFC compared to world consumption of Primary Energy from 1965 through 2019.

To enlarge, open image in new tabl

The graph shows that global Primary Energy consumption from all sources has grown continuously over 5 decades. Since 1965  oil, gas and coal (FF, sometimes termed “Thermal”) averaged 89% of PE consumed, ranging from 94% in 1965 to 84% in 2019.

Global Mean Temperatures

Everyone acknowledges that GMT is a fiction since temperature is an intrinsic property of objects, and varies dramatically over time and over the surface of the earth. No place on earth determines “average” temperature for the globe. Yet for the purpose of detecting change in temperature, major climate data sets estimate GMT and report anomalies from it.

UAH record consists of satellite era global temperature estimates for the lower troposphere, a layer of air from 0 to 4km above the surface. HadSST estimates sea surface temperatures from oceans covering 71% of the planet. HADCRUT combines HadSST estimates with records from land stations whose elevations range up to 6km above sea level.

Both GISS LOTI (land and ocean) and HADCRUT4 (land and ocean) use 14.0 Celsius as the climate normal, so I will add that number back into the anomalies. This is done not claiming any validity other than to achieve a reasonable measure of magnitude regarding the observed fluctuations.

No doubt global sea surface temperatures are typically higher than 14C, more like 17 or 18C, and of course warmer in the tropics and colder at higher latitudes. Likewise, the lapse rate in the atmosphere means that air temperatures both from satellites and elevated land stations will range colder than 14C. Still, that climate normal is a generally accepted indicator of GMT.

Correlations of GMT and WFFC

The next graph compares WFFC to GMT estimates over the five decades from 1965 to 2019 from HADCRUT4, which includes HadSST3.

Since 1965 the increase in fossil fuel consumption is dramatic and monotonic, steadily increasing by 237% from 146 to 492 exajoules.  Meanwhile the GMT record from Hadcrut shows multiple ups and downs with an accumulated rise of 0.9C over 54 years, 6% of the starting value.

The graph below compares WFFC to GMT estimates from UAH6, and HadSST3 for the satellite era from 1979 to 2019, a period of 40 years.

In the satellite era WFFC has increased at a compounded rate of nearly 2% per year, for a total increase of 87% since 1979. At the same time, SST warming amounted to 0.52C, or 3.7% of the starting value.  UAH warming was 0.58C, or 4.7% up from 1979.  The temperature compounded rate of change is 0.1% per year, an order of magnitude less than WFFC.  Even more obvious is the 1998 El Nino peak and flat GMT since.

Summary

The climate alarmist/activist claim is straight forward: Burning fossil fuels makes measured temperatures warmer. The Paris Accord further asserts that by reducing human use of fossil fuels, further warming can be prevented.  Those claims do not bear up under scrutiny.

It is enough for simple minds to see that two time series are both rising and to think that one must be causing the other. But both scientific and legal methods assert causation only when the two variables are both strongly and consistently aligned. The above shows a weak and inconsistent linkage between WFFC and GMT.

Going further back in history shows even weaker correlation between fossil fuels consumption and global temperature estimates:

wfc-vs-sat

Figure 5.1. Comparative dynamics of the World Fuel Consumption (WFC) and Global Surface Air Temperature Anomaly (ΔT), 1861-2000. The thin dashed line represents annual ΔT, the bold line—its 13-year smoothing, and the line constructed from rectangles—WFC (in millions of tons of nominal fuel) (Klyashtorin and Lyubushin, 2003). Source: Frolov et al. 2009

In legal terms, as long as there is another equally or more likely explanation for the set of facts, the claimed causation is unproven. The more likely explanation is that global temperatures vary due to oceanic and solar cycles. The proof is clearly and thoroughly set forward in the post Quantifying Natural Climate Change.

Background context for today’s post is at Claim: Fossil Fuels Cause Global Warming.