Arctic Ice Exceeds 10 Wadhams Mid. Nov. 2021
Arctic Ice Extent reaching 10 million km2 is a milestone marking recovery of half the ice lost last spring and summer. Each year the max extent is ~15M km2 and the mid-September min is ~5M km2. This year in just two months the ice gained back half the ice lost in the six months prior to mid September. The metric 1 Wadham = 1Mkm2 ice extent is in recognition of the professor who declared the Arctic would be ice-free before 2011, by which he meant less than 1M km2 extent.
The animation shows Arctic ice extents this year for the last two weeks, from day 304 (Oct. 31) to day 319 (Nov. 15). Note on the right side, the Russian shelf seas (from top: East Siberian, Laptev, Kara) were already ice covered. At top center, Chukchi adds 200k km2 to reach 90% of max last March. Top left, Beaufort sea fills in to 98% of its March max. Center left is Canadian Arctic Archipelago adding 267k km2 to reach 96% of its max. Lower left shows Baffin Bay and Gulf of St. Lawrence adding 400k km2 up to 67% of its max. .At the bottom center Barents Sea grows 231k km2 to reach 63% of its max.
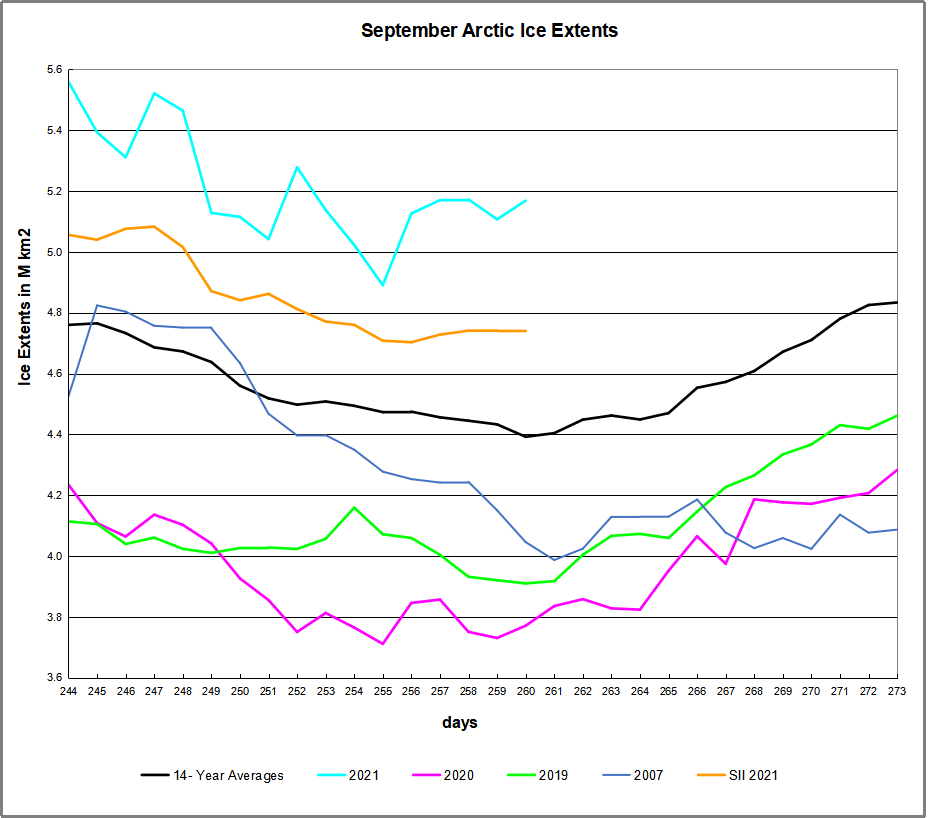
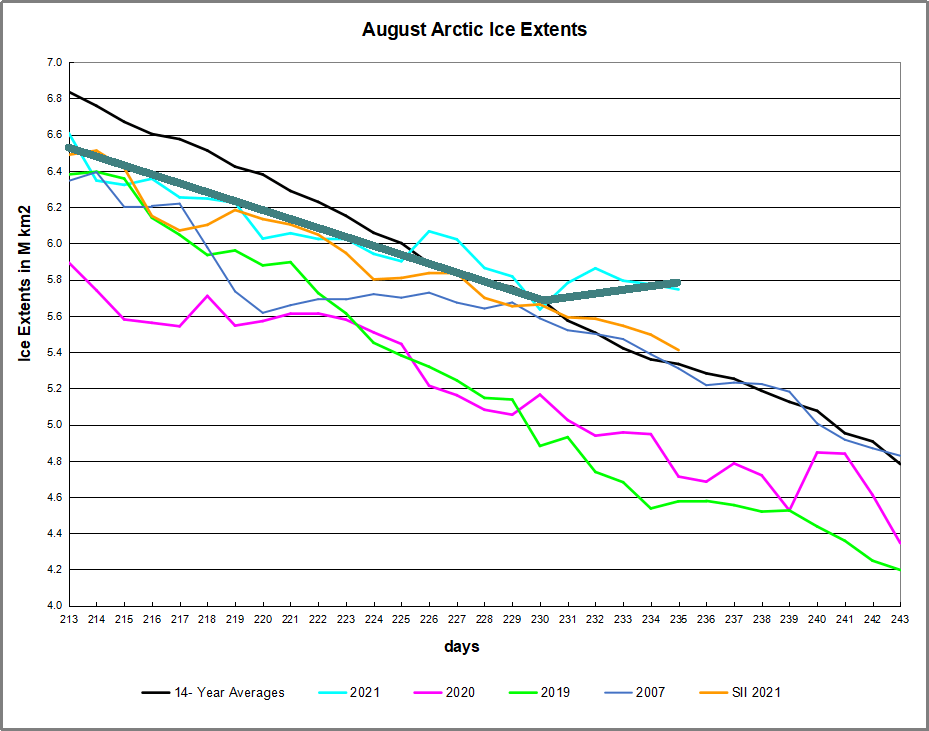
The graph below shows Oct./Nov. daily ice extents for 2021 compared to 14 year averages, and some years of note:
 The black line shows during this period on average Arctic ice extents increase ~3.5M km2 from ~6.3M km2 up to ~9.8M km2. The 2021 cyan MASIE line started the period ~400k km2 above average and on day 319 retained a surplus of ~380k km2. The Sea Ice Index in orange (SII from NOAA) started with the same deficit, then lagged behind in the first two weeks, before ending ~200k km2 lower than MASIE (no data yet for yesterday). 2019 and 2020 were well below average at this stage of the ice recovery.
Why is this important? All the claims of global climate emergency depend on dangerously higher temperatures, lower sea ice, and rising sea levels. The lack of additional warming is documented in a post Adios, Global Warming
The lack of acceleration in sea levels along coastlines has been discussed also. See USCS Warnings of Coastal Flooding
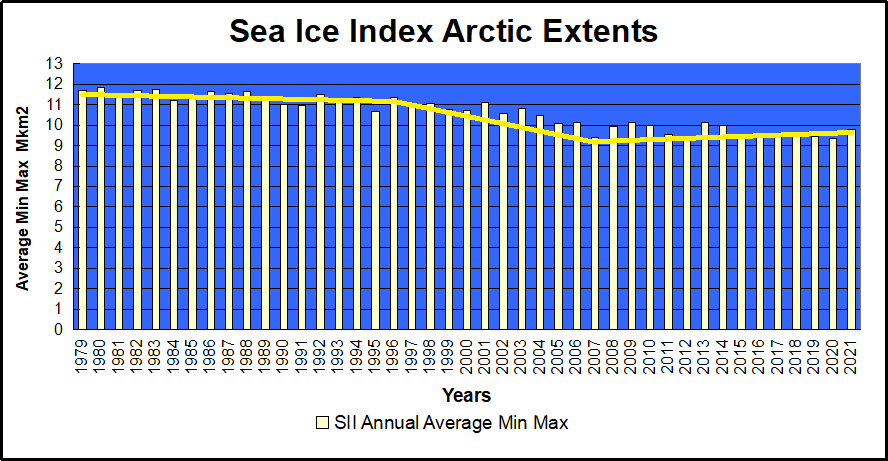
Also, a longer term perspective is informative:
 The table below shows the distribution of Sea Ice on day 304 across the Arctic Regions, on average, this year and 2020.
| Region | 2021319 | Day 319 Average | 2021-Ave. | 2020319 | 2021-2020 |
| (0) Northern_Hemisphere | 10136298 | 9754986 | 381313 | 9171330 | 964968 |
| (1) Beaufort_Sea | 1052365 | 1064248 | -11883 | 1068490 | -16125 |
| (2) Chukchi_Sea | 868672 | 614315 | 254357 | 539677 | 328995 |
| (3) East_Siberian_Sea | 1087137 | 1073635 | 13503 | 1078789 | 8349 |
| (4) Laptev_Sea | 897827 | 897084 | 743 | 889358 | 8468 |
| (5) Kara_Sea | 711109 | 637483 | 73626 | 450888 | 260220 |
| (6) Barents_Sea | 286732 | 145188 | 141544 | 15590 | 271142 |
| (7) Greenland_Sea | 404108 | 466229 | -62120 | 502768 | -98659 |
| (8) Baffin_Bay_Gulf_of_St._Lawrence | 511295 | 532632 | -21337 | 446719 | 64575 |
| (9) Canadian_Archipelago | 824385 | 852284 | -27899 | 854597 | -30212 |
| (10) Hudson_Bay | 155801 | 248736 | -92935 | 256849 | -101047 |
| (11) Central_Arctic | 3216117 | 3168700 | 47417 | 3046118 | 169999 |
The overall surplus to average is 381k km2, (4%). Note large surpluses of ice in Chukchi, Barents and Kara Seas, as well as Central Arctic. The main deficits to average are in Greenland Sea and Hudson Bay, the latter being a shallow basin that will freeze over quickly once it starts. Note that 2021 ice extent exceeds that of 2020 by nearly a full Wadham, most of the difference being in Chukchi, Kara, Barents and Central Arctic.


Illustration by Eleanor Lutz shows Earth’s seasonal climate changes. If played in full screen, the four corners present views from top, bottom and sides. It is a visual representation of scientific datasets measuring Arctic ice extents.


 The table below shows the distribution of Sea Ice across the Arctic Regions, on average, this year and 2007.


