Arctic Fork in the Road Dec. 25

On Christmas Day Dr. Judah Cohen published his updated Arctic Oscillation and Polar Vortex Analysis and Forecast Excerpts below
As I have been discussing the past two blog posts I continue to believe that this is the most critical period of the winter and will ultimately determine the character of the winter. In my opinion, we have approached a fork in the road and the atmosphere can take two possible paths one is a path where the rest of the winter is relatively mild across the mid-latitudes of the NH and the second is a colder path or solution. The tropospheric polar vortex has been relatively weak for much of the month of December as illustrated by the relatively warm polar cap geopotential heights (PCHs) for the first half of December that then boomeranged off the mid-stratosphere and after a short respite with colder tropospheric PCHs, warmer PCHs in the troposphere are predicted through the end of the month and into early January.
Based on the easterly phase of the Quasi-Biennial Oscillation (QBO) I have been favoring a significant PV disruption most likely in January for much of the fall. A significant stratospheric PV disruption would then be followed by an extended period of severe winter weather across the mid-latitudes of the NH. However, I have to admit as of yet there are no signs of this scenario. There is still time but not much. However, there is another scenario that could still yield a relatively cold winter and that is one analogous to what happened in the winter of 2013/14 where no significant disruptions of the stratospheric occurred but rather repeated minor disruptions that yielded a cold winter for central and eastern North America. Though at first, I acknowledged this possibility I was hesitant to favor this scenario. However, the longer the delay in a major disruption of the stratospheric PV the more I favor this scenario.
The Arctic Oscillation (AO) is currently slightly positive and is predicted to trend slowly negative through the end of the week towards neutral. The forecast is for the AO to remain close to neutral next week, likely a sign of uncertainty.

Figure 7. Forecasted snowfall anomalies (mm/day; shading) from 31 December 2017 – 4 January 2018. The forecasts are from the 00Z 18 December 2017 GFS ensemble. Note the new projection to provide finer resolution.
The current positive AO is reflective of mixed pressure/geopotential height anomalies across the Arctic and mostly positive pressure/geopotential height anomalies across the mid-latitudes. The North Atlantic Oscillation (NAO) is also currently slightly positive with weak pressure/geopotential height anomalies across Greenland and Iceland and positive pressure/geopotential height anomalies across the mid-latitudes of the North Atlantic.
A return to Ural ridging/blocking at the turn of the calendar year favors active energy transfer from the troposphere to the stratosphere. Another pulse is predicted to commence this week and peak the first few days of January. The pulse itself is likely related to relaxation of the pattern and mild temperatures across North America. However, the predicted resultant perturbation to the stratospheric polar vortex (PV) especially the building of heights over northwestern North America in my opinion could once again favor the return of cold temperatures across eastern North America later in January.

Figure 9. Forecasted snowfall anomalies (mm/day; shading) from 5 – 9 January 2018. The forecasts are from the 00Z 25 December 2017 GFS ensemble. Troughing and/or cold temperatures will support the potential of additional snowfall across Eastern Europe, Siberia, West and East Asia, Alaska, Canada and the Northwestern US. Despite below normal temperatures, temperatures warm sufficiently to support snowmelt across the Eastern US (Figure 9).
Ice did not grow this past week on the North Pacific side of the Arctic basin, still I expect the negative ice anomalies in the region to shrink. Sea ice is below normal in the Barents-Kara Seas as well and with time the greatest negative sea ice anomalies will likely reside in this region. As I have been writing for much of the fall I do believe that the record low sea ice anomalies in the Chukchi and Bering Seas has focused ridging/blocking in this region. Though model forecasts do not predict a return of the blocking in the foreseeable future.
Recent research has shown that regional anomalies are important and the sea ice region most highly correlated with the winter AO is the Barents-Kara Seas region where low Arctic sea ice favors a negative winter AO and a cold Eurasia. Below normal sea ice in this region may be contributing to more active Wave Activity Flux/poleward heat transport predicted in the models that eventually could result in a negative AO.
Okhotsk Doubles in 12 Days
While the refreezing rate slowed in recent days, we again see contrast in the Pacific Basins.
Mid month, Chukchi (top right) refroze almost completely, then reversed in the last week. Meanwhile, Okhotsk (Left) grew ice fairly steadily doubling in 12 days to cover nearly half of the annual maximum. At the moment the Arctic is slightly below the 10 year average, due to the slowdown.
Whichever fork the ice takes, the Polar Bears had a Merry Christmas

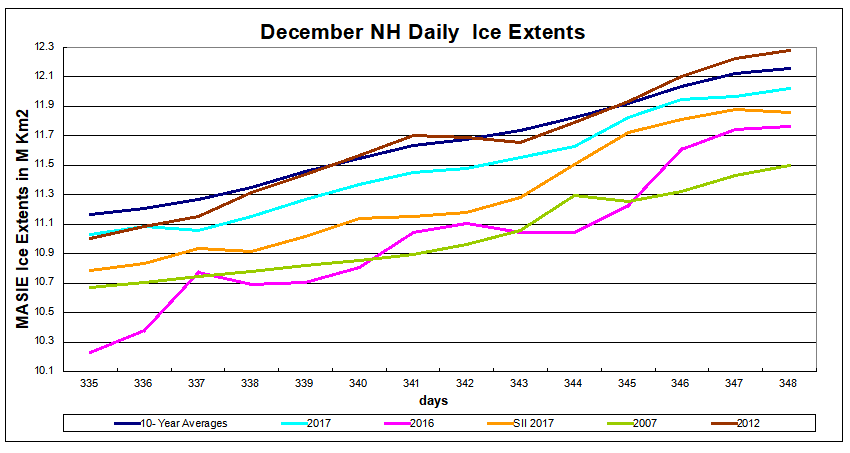

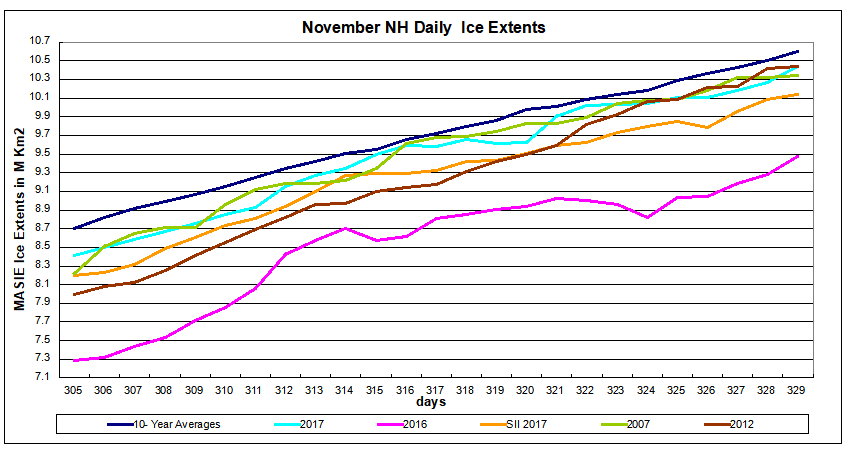

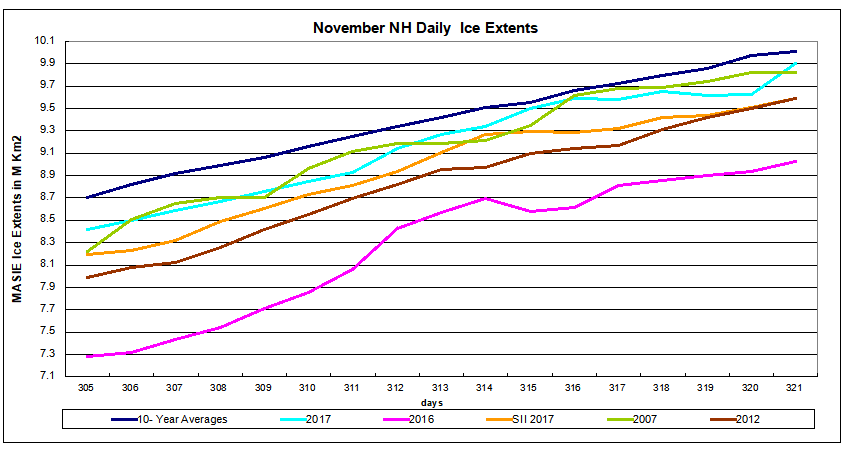


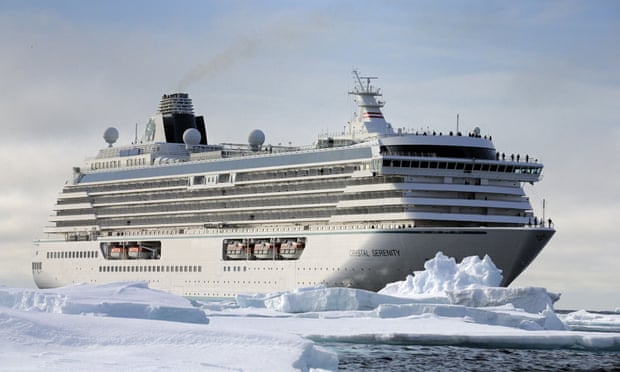
 Figure 1. (a) The predicted daily-mean near-surface AO from the 00Z 5 September 2017 GFS ensemble. Gray lines indicate the AO index from each individual ensemble member, with the ensemble-mean AO index given by the red line with squares.