A steady and remarkable rise in average global ocean temperatures this year is now outpacing anything seen in four decades of satellite observations, causing many scientists to suddenly blare alarm over the risks and realities of climate change. But even those typically aligned on climate science can’t agree on what, exactly, triggered such rapid warming and how alarmed they should be.
Some climate researchers suspect that a drastic reduction in air pollution from ships has allowed more sunlight to radiate into oceans, a conclusion others vigorously criticize. Meteorologists also say a weakening of Atlantic winds may be encouraging warming; normally these winds help cool waters and carry sun-blocking plumes of Saharan dust.
Scientists nonetheless agree on this: Conditions are ever ripening for extreme heat waves, droughts, floods and storms, all of which have proven links to ocean warming.
In the Pacific Ocean, warming temperatures are to be expected during El Niño — its impacts on weather around the world stem from warmer-than-normal surface waters along the equatorial Pacific. But the extreme warmth extends beyond the Pacific. Record warmth is also occurring in the equatorial and northern Atlantic — and in the tropics, where hurricanes form.
“This is totally bonkers and people who look at this stuff routinely can’t believe their eyes,” Brian McNoldy, a hurricane researcher at the University of Miami, wrote on Twitter. “Something very weird is happening.”
Antarctic sea ice concentration on June 27, 2023, with white representing solid ice and dark blue representing open ocean. The median ice edge for 1981–2010 is drawn in orange. (Credit: Map by NOAA Climate.gov, based on data from the National Snow and Ice Data Center)
And of course there is the added warning about Antarctic sea ice not freezing as rapidly as usual in SH winter. The media always refers to “climate change” as the causal factor, which is code for rising CO2 and humans to blame. For a more reasonable discussion, see Antarctic Sea Ice Varies, It’s Complicated.
What About Natural Factors?
Because the power, glory and money comes from CO2 hysteria and taking over the energy industry, the theories are all about the atmosphere. Realists know that Oceans Make Climate, and look for more direct means by which sea temperatures can warm.
The HadSST4 AMO dataset was finally updated and showed dramatic 2023 warming in the North Atlantic. Let’s consider two possibilities.
An international team of scientists led by CICOES researcher David Butterfield
work together to rapidly find and explore large hydrothermal vents
on the world’s longest mountain range.
Sometimes Mid-Atlantic ridge is called the “40,000-mile Volcano”
Scientists have discovered three new hydrothermal vent fields over a 434-mile-long stretch of the Mid-Atlantic Ridge during the first scientific expedition aboard Schmidt Ocean Institute’s recently launched research vessel Falkor (too).
The multidisciplinary science team representing 11 institutions from the United States, Canada, and France used advanced ocean technologies to make the discovery. Scientists used autonomous and remotely operated underwater vehicles resulting in 65 square miles (170 square kilometers) of seafloor mapped at one-meter scale resolution, an area approximately the size of Manhattan Island.
The discovery of the active hydrothermal vents is the first on this section of the world’s longest underwater mountain range, the Mid-Atlantic Ridge, in more than 40 years. One of the discovered vent fields was located at the Puy des Folles volcano and has five active sites over 6.95 square miles (18 square kilometers). High-temperature ‘black smoker’ vents were also found at the Grappe Deux vent system and Kane Fracture Zone.
This discovery of new hydrothermal vents under the Atlantic ocean reminds of hundreds of thousands of sea mounts active on the ocean floor, with a high concentration in the North Atlantic For a more complete discussion of bottom up ocean warming, See Post:
The eruption of the submarine Hunga volcano in January 2022 was associated with a powerful blast that injected volcanic material to altitudes up to 58 km. From a combination of various types of satellite and ground-based observations supported by transport modeling, we show evidence for an unprecedented increase in the global stratospheric water mass by 13% relative to climatological levels, and a 5-fold increase of stratospheric aerosol load, the highest in the last three decades. Owing to the extreme injection altitude, the volcanic plume circumnavigated the Earth in only 1 week and dispersed nearly pole-to-pole in three months.The unique nature and magnitude of the global stratospheric perturbation by the Hunga eruption ranks it among the most remarkable climatic events in the modern observation era, with a range of potential long-lasting repercussions for stratospheric composition and climate.
The perturbation of stratospheric water vapour burden by 13% is tremendous and has no frame of comparison in the entire observation record dating back to 1985. As there are no efficient sinks of water vapour in the stratosphere, this perturbation is expected to last over several years. Indeed, in 9 months since the eruption, the water vapour mass anomaly has gradually decreased only by 2.5% (4.3 ± 0.1% annual rate), which should lead to the perturbation timescale of over 3 years, assuming the further linear decay trend. The persistent stratospheric moist anomaly may lead to changes in atmospheric radiative balance; stratospheric dynamics as well as amplification of the polar ozone depletion through wider occurrence of polar stratospheric clouds. The ability to assess the longer-term impacts of the HT eruption on stratospheric chemistry will depend strongly on the quality and availability of global satellite observations such as MLS in the coming years.
In addition to blasting seawater to the stratosphere, the event shook the ocean floor worldwide.
The massive volcanic blast in the Pacific last year was felt 18,000km away on the other side of the world, on the floor of the Atlantic Ocean. The cataclysmic eruption of Hunga-Tonga Hunga-Ha’apai on 15 January 2022 sent pressure waves through Earth’s atmosphere that connected with the sea surface and triggered 50 highly sensitive seismometers placed 5,000m under water on the seabed. It was one of a number of intriguing phenomena picked up by the instrument network in the Azores-Madeira-Canary Islands region. Source: BBC
Summary
Let’s stop pretending we can alter nature by spending trillions of dollars “fighting climate change.” Better to solve actual problems we are causing and can fix, rather than obsessing over imaginary ones.
Paul Noel ,Former Research Scientist 6 Level 2 UAH (2008–2014) wrote this response. Excerpts in italics with my bolds and added images.
I have researched this issue in depth. As a good scientist I have gone deeply and gotten the facts. I have gotten:
the Satellite data on the global profiles,
the weather data.
the storm data and disaster data
the polar ice data.
the historical data.
I have looked in deeply on this issue. I have studied the physics too! I have studied the history too! I have studied the archeology and even the paleo geology and even the ice core data.
This isn’t easy to get because lots of people are producing lies on the topic. So I have worked very hard to get down to the facts. Then the job becomes one which is very hard. If I just tell you the answers I got , it is a case of if you believe me or not. If I tell you the science data it is likely to get way in over your understanding and that is back to if you believe me or not. This is a job of explaining to you very carefully what the data is using things you can see and understand.
So taking this from the top there are 2 ways I can go.
One way is to go into the advocates of the topic that are so scaring you deeply
and the other is to go into the science.
The explanation of the science is pretty easy and such but explaining to you the motives of people and their actions and methods is much harder. But I am going to start with the people.
Why are they scaring you about the climate?
Climate policy has almost nothing to do anymore with environmental protection, says the German economist and IPCC official Ottmar Edenhofer.
This is what this is all about. There is no other motive. You may dispense with your worries here if you are worried for the world environment. But I will now switch to the facts and reality on the ground. Remember this alone should pretty much put an end to your worries. You are facing a very large deliberate well funded and most professionally constructed set of lies and propaganda designed to get you scared like you are. This is 5th generational warfare. It is not anything you are used to thinking about. That is why it is effective.
What are the climate facts on the ground?
The fact on the ground are that if the changes you are supposing to see are real they should be obvious. They should be something you can see, feel, hear and touch. That is where we are going right now!
If the world is warming up the paleo-climate data says that the polar regions warm first. That is what you are being told about arctic ice melting and sea level raise. If you go to the Denmark Polar Portal on the web you can get the data.
Greenland Ice Sheet is not Melting Away
Because these people have to comply with the IPCC they put in all kinds of disclaimers trying to keep you scared of melt down etc.. The reality is we are solidly into the melt season and the ice is not melting down more than usual.
Arctic Sea Ice Is Not Going Away
The polar ice is at normal levels. I can go on and on here but the reality is that there is no emergency.
Global Warming is Not Accumulating
The data from UAH which is technical showed from January 1995 to January 2023 the global temperature did not increase at all. And from 2016 actually went down (-0.7C) . That isn’t some melting or Global Warming or some Climate Catastrophe. It just is not.
CO2 Is Rising But Far Below Its Optimum
Is CO2 rising it sure is and it isn’t even to the maximum level that occurred in the last maximum in the last interglacial period of earth. CO2 is not 1% it is 0.042%. The earth has thrived with maximum life at 1% CO2 there are no melt down periods.
Is the climate variable, You bet it is. We have seen in the last 2000 years it go up and down in temperature and we are actually near the bottom of that period. The reality is that we have been up to 10C warmer and guess what that time mankind did his very best. We don’t thrive on cold.
Warming Has Been Beneficial and More Would be a Good Thing
Now let’s look at the trends and in a way you never imagined. I have looked into this matter because Alabama where I live has a cute lovely vacation town called Orange Beach. I highly recommend Orange Beach for a vacation it is beautiful. Orange Beach was named in 1898 when the US Post Office (Now the USPS) opened a new post office there. The unincorporated town’s principal business was raising oranges commercially. Alabama used to raise oranges up to about Evergreen Alabama or almost to Montgomery Alabama the state capitol.
Production of Oranges Limited by Freezing Temperatures in SE US
No commercial orange production exists in Alabama at this time. The reason is simple. The growing season in Orange Beach Alabama went from 365 days a year to 268 days a year. The orange trees froze out. Now they have new varieties that can grow in the colder weather but even they are severely limited in Alabama. The orange trees have frozen out almost to Orlando Florida now.
Orange beach would be right next to North Florida along the Gulf of Mexico. Literally Florida is just across the Perdido River from Orange Beach.
The Gulf Stream Makes Climate Change in the North Atlantic
The reality is the climate from 1898 to the present has gotten colder in the USA. This is significant to the whole earth for a very important reason.
You see the heat from the whole earth gets aimed directly at Alabama! We cool down so is the rest of the world. The whole circulation for the whole earth focuses on the Gulf of Mexico and Alabama.
This by the way is why Greenland has so much ice. You see it is the warm water from the Gulf Stream that generates the steam that freezes and comes down as snow. You have to make the steam to make the ice.
Sea Level Depends on Land Buoyancy, not CO2
Now on to sea level rise. First of all if you believe that the sea level is rising and such it is only reported to be rising in the order of the thickness of 2 US 5 Cent coins per year. So if you believe it is happening it is no emergency and no real problem. It isn’t worthy of losing sleep over. The stories of melting sea ice are silly. First of all even if they melt they will have absolutely no effect on the sea level because they are floating. But there is another thing these people don’t tell you about.
The sea level is not the product of the amount of water in the ocean. It is in fact the product of a large sum of buoyancy issues and the gravity of the earth. The continents are where they are because they have less gravity than the other areas. The seafloor is a zone of higher gravity. Because the continents are floating that means that their level above the sea is determined by the laws of buoyancy. If Greenland were to melt off, the resulting reality would cause the area to buoy up because it would weigh less. At the same time the water added to the oceans would simply sink the sea floor deeper.
Continents Can Sink to Form New Seas
But to illustrate this you must learn about the Great Rift Valley of Africa. That valley is a place where the base continental rocks have spread apart. The land is sinking there and has already sunk to form the Red Sea! A new ocean is forming in Africa. This is what has sunk the continental shelves of the continents. The edge of the continents tinned out and lost the thick granite below that floats on the magma and they sunk. So sea level is not in any way related to ice melting. Sea level is related to this continental buoyancy issue. So nothing in their story not melting ice nor rising seas is happening. But I will show you this in pictures because we have these now.
Many Coastlines Show Water Receding Rather than Rising
Tell me if you see any sea level rise in the past 246 years now. (None!)
[Since we are looking in New England:]
This is just about due south of London–Pevensey Castle.
It was started construction in about 203 AD. It was built right on the sea on a coastal island. Such a fort only has value as far as an archer can shoot an arrow. It guarded the entrance to Pevensey Bay. The bay doesn’t exist it is nearly 30 meters above sea level now. Lots of people just refuse to see them. The fort itself is 110 feet above sea level and 5/8 mile from the sea.
If it isn’t clear yet that you have been hoaxed into a panic I don’t know what I can do. I have shown you that it got colder not warmer. That the ice is not melting. That the seas are not rising. Shall I go on?
CO2 Is Plant Food not a Pollutant
How about the real truth of CO2 and what it is doing on our earth. Look at these pictures carefully they tell the truth beyond any possible doubt.
C3 photosynthesis plants are growing 800% better than they were. Our C4 plants are doing 650% better.
The whole earth is growing better and the forests are growing because of CO2. Sorry this isn’t a “doom and gloom” story here.
Wild fires are down too!
The fact is that in 1960 the world was running out of food because our plants and farms were at their limits. Today we are run over with food and 45% of our crop land has been turned back to the forests. We are not at the limits. This has led to an explosion of wildlife too!
Life is Thriving Not Facing Extinction
There literally is no mass extinction going on. We are in the largest bloom of life on earth that has been seen in the past 10,000 years.
The human race is on the edge of unlimited energy, unlimited food, unlimited technology and we are sitting here in terror of some imaginary doom and gloom hating the very system that is feeding mankind and building him up.
Everything is quite literally the opposite of what you are told!
In Sum;
The only catastrophe would be ill-advised climate policies willfully destroying
our energy platform and economic supply processes out of irrational CO2 hysteria.
E.M. Smith explains Curing Radiation Myopia Regarding Climate
E.M. Smith provides an helpful critique of a recent incomplete theory of earth’s climate functioning in his Chiefio blog post So Close–Missing Convection and Homeostasis. Excerpts in italics with my bolds and added images. The reference is to a video by Sabine Hossenfelder you can view below in the post.
It is Soooo easy to get things just a little bit off and miss reality. Especially in complex systems and even more so when folks raking in $Millions are interested in misleading for profit. Sigh.
Sabine Hosenfelder does a wonderful series of videos ‘explaining’ all sorts of interesting things in and about actual science and how the universe works. She is quite smart and generally “knows her stuff”.But… It looks like she has gotten trapped into the Radiative Model of Globull Warming.
The whole mythology of Global Warming depends on having you NOT think about anything but radiative processes and physics. To trap you into the Radiative Model. But the Earth is more complex than that. Much more complex. Then there’s the fact that you DO have some essential Radiative Physics to deal with, so the bait is there. However…
It is absolutely essential to pay attention to convection in the lower atmosphere
and to the “feedback loops” or homeostasis in the system.
The system acts to restore its original state. There is NO “runaway greenhouse” or we would have never evolved into being since the early earth had astoundingly high levels of CO2 and we would have baked to death before getting out of our slime beds as microbes.
Figure 16. The geological history of CO2 level and temperature proxy for the past 400 million years. CO2 levels now are ~ 400ppm. Source: Davis, W. J. (2017).
OK, I’ll show you her video. It is quite good even with the “swing and a miss” at the end. She does 3 levels of The Greenhouse Gas Mythology so you can see the process evolving from grammar school to high school to college level of mythology. But then she doesn’t quite make it to Post-Doc Reality.
Where’s she wrong? (Well, not really wrong, but lacking…)
I see 2 major issues. First off, she talks about the “lower atmosphere warming”. Well, yes and no. It doesn’t “warm” in the sense of getting hotter, but it does speed up convection to move the added heat flow.
In English “heating” has 2 different meanings. Increasing temperature.
Increasing heat flow at a temperature.
We see this in “warm up the TV dinner in the microwave” meaning to heat it up from frozen to edible; and in the part where the frozen dinner is defrosting at a constant temperature as it absorbs heat but turns it into the heat of fusion of water. So you can “warm it up” by melting at a constant temperature of frozen water (but adding a LOT of thermal energy – “heat”) then later as increasing temperature once the ice is melted. It is very important to keep in mind that there are 2 kinds of “heating”. NOT just “increasing temperature”.
In the lower atmosphere, the CO2 window / Infrared Window is already firmly slammed shut. Sabine “gets that”. Yay! One BIG point for her! No amount of “greenhouse gas” is going to shut that IR window any more. As she points out, you get about 20 meters of transmission and then it is back to molecular vibrations (aka “heat”).
So what’s an atmosphere to do? It has heat to move! Well, it convects. It evaporates water.
Those 2 things dominate by orders of magnitude any sort of Radiative Model Physics. Yes, you have radiation of light bringing energy in, but then it goes into the ocean and into the dirt and the plants and even warms your skin on a sunny day. And it sits there. It does NOT re-radiate to any significant degree. Once “warmed” by absorption, heat trying to leave as IR hits a slammed shut window.
The hydrological cycle. Estimates of the observed main water reservoirs (black numbers in 10^3 km3 ) and the flow of moisture through the system (red numbers, in 10^3 km3 yr À1 ). Adjusted from Trenberth et al. [2007a] for the period 2002-2008 as in Trenberth et al. [2011].
So what does happen? Look around, what do you see? Clouds. Rain. Snow. (sleet hail fog etc. etc.)
Our planet is a Water Planet. It moves that energy (vibrations of atoms, NOT radiation) by having water evaporate into the atmosphere. (Yes, there are a few very dry deserts where you get some radiative effects and can get quite cold at night via radiation through very dry air, but our planet is 70% or so oceans, so those areas are minor side bars on the dominant processes). This water vapor makes the IR window even more closed (less distance to absorption). It isn’t CO2 that matters, it is the global water vapor.
What happens next?
Well, water holds a LOT of heat (vibration of atoms and NOT “temperature”) as the heat of vaporization. About 540 calories per gram (compared to 80 for melting “heat of fusion” and 1 for specific heat of a gram of water). Compare those numbers again. 1 for a gram of water. 80 for melting a gram of ice. 540 for evaporating a gram of water. It’s dramatically the case that evaporation of water matters a lot more than melting ice, and both of them make “warming water” look like an irrelevant thing.
Warming water is 1/80 as important as melting ice, and it is 1/540 th as important as evaporation of the surface of the water. Warming air is another order of magnitude less important to heat content.
So to have clue, one MUST look at the evaporation of water from the oceans as everything else is in the small change.
Look at any photo of the Earth from space. The Blue Marble covered in clouds. Water and clouds. The product of evaporation, convection, and condensation. Physical flows carrying all that heat (“vibration of atoms” and NOT temperature, remember). IF you add more heat energy, you can speed up the flows, but it will not cause a huge increase in temperature (and mostly none at all). It is mass flow that changes. The number of vibrating molecules at a temperature, not the temperature of each.
In the end, a lot of mass flow happens, lofting all that water vapor with all that heat of vaporization way up toward the Stratosphere. This is why we have a troposphere, a tropopause (where it runs out of steam… literally…) and a stratosphere.
What happens when it gets to the stratosphere boundary? Well, along the way that water vapor turns into water liquid very tiny drops (clouds) and eventually condenses to big drops of water (rain) and some of it even freezes (hail, snow, etc.). Now think about that for a minute. That’s 540 calories per gram of heat (molecular vibration NOT temperature, remember) being “dumped” way up high in the top of the troposphere as it condenses, and another 80 / gram if if freezes. 620 total. That’s just huge.
This is WHY we have a globe covered with rain, snow, hail, etc. etc. THAT is all that heat moving. NOT any IR Radiation from the surface. Let that sink in a minute. Fix it in your mind. WATER and ICE and Water Vapor are what moves the heat, not radiation. We ski on it, swim in it, have it water our crops and flood the land. That’s huge and it is ALL evidence of heat flows via heat of vaporization and fusion of water.
It is all those giga-tons of water cycling to snow, ice and rain, then falling back to be lofted again as evaporation in the next cycle. That’s what moves the heat to the stratosphere where CO2 then radiates it to space (after all, radiation toward the surface hits that closed IR window and stops.) At most, more CO2 can let the Stratosphere radiate (and “cool”) better. It can not make the Troposphere any less convective and non-radiative.
Then any more energy “trapped” at the surface would just run the mass transport water cycle faster. It would not increase the temperature.
More molecules would move, but at a limit on temperature. Homeostasis wins. We can see this already in the Sub-Tropics. As the seasons move to fall and winter, water flows slow dramatically. I have to water my Florida lawn and garden. As the seasons move to spring and summer, the mass flow picks up dramatically. Eventually reaching hurricane size. Dumping up to FEET of condensed water (that all started as warm water vapor evaporating from the ocean). It is presently headed for about 72 F today (and no rain). At the peak of hurricane season, we get to about 84 or 85 F ocean surface temperature as the water vapor cycle is running full blast and we get “frog strangler” levels of rain. That’s the difference. Slow water cycle or fast.
IF (and it is only an “if”, not a when) you could manage to increase the heat at the surface of the planet in, say, Alaska: At most you would get a bit more rain in summer, a bit more snow in winter, and MAYBE only a slight possible, of one or two days that are rain which could have been snow or sleet.
Then there’s the fact that natural cycles swamp all of that CO2 fantasy anyway. The Sun, as just one example, had a large change of IR / UV levels with both the Great Pacific Climate Shift (about 1975) and then back again in about 2000. Planetary tilt, wobble, eccentricity of the orbit and more put us in ice ages (as we ARE right now, but in an “interglacial” in this ice age… a nice period of warmth that WILL end) and pulls us out of them. Glacials and interglacials come and go on various cycles (100,000 years, 40,000 years, and 12,000 year interglacials – ours ending now, but slowly). The simple fact is that Nature Dominates, and we are just not relevant. To think we are is hubris of the highest order.
Figure 9: Two contrasting views of the effects of how the continuous intensification of deep cumulus convection would act to alter radiation flux to space. The top (bottom) diagram represents a net increase (decrease) in radiation to space
Footnote
There are two main reasons why investigators are skeptical of AGW (anthropogenic global warming) alarm. This post intends to be an antidote to myopic and lop-sided understandings of our climate system.
CO2 Alarm is Myopic: Claiming CO2 causes dangerous global warming is too simplistic. CO2 is but one factor among many other forces and processes interacting to make weather and climate.
Myopia is a failure of perception by focusing on one near thing to the exclusion of the other realities present, thus missing the big picture. For example: “Not seeing the forest for the trees.” AKA “tunnel vision.”
2. CO2 Alarm is Lopsided: CO2 forcing is too small to have the overblown effect claimed for it. Other factors are orders of magnitude larger than the potential of CO2 to influence the climate system.
Lop-sided refers to a failure in judging values, whereby someone lacking in sense of proportion, places great weight on a factor which actually has a minor influence compared to other forces. For example: “Making a mountain out of a mole hill.”
By design, climate models exclude solar forcing of earth’s climate,
and perform poorly without it.
Scafetta (2023) Highlights
• The role of the Sun in climate change is hotly debated with diverse models.
• The Earth’s climate is likely influenced by the Sun through a variety of physical mechanisms.
• Balanced multi-proxy solar records were created and their climate effect assessed.
• Factors other than direct TSI forcing account for around 80% of the solar influence on the climate.
• Important solar-climate mechanisms must be investigated before developing reliable GCMs.
Abstract
The role of the Sun in climate change is hotly debated. Some studies suggest its impact is significant, while others suggest it is minimal. The Intergovernmental Panel on Climate Change (IPCC) supports the latter view and suggests that nearly 100% of the observed surface warming from 1850–1900 to 2020 is due to anthropogenic emissions.
However, the IPCC’s conclusions are based solely on computer simulations made with global climate models (GCMs) forced with a total solar irradiance (TSI) record showing a low multi-decadal and secular variability. The same models also assume that the Sun affects the climate system only through radiative forcing – such as TSI – even though the climate could also be affected by other solar processes.
In this paper I propose three “balanced” multi-proxy models of total solar activity (TSA) that consider all main solar proxies proposed in scientific literature. Their optimal signature on global and sea surface temperature records is assessed together with those produced by the anthropogenic and volcanic radiative forcing functions adopted by the CMIP6 GCMs. This is done by using a basic energy balance model calibrated with a differential multi-linear regression methodology, which allows the climate system to respond to the solar input differently than to radiative forcings alone, and to evaluate the climate’s characteristic time-response as well.
The proposed methodology reproduces the results of the CMIP6 GCMs when their original forcing functions are applied under similar physical conditions, indicating that, in such a scenario, the likely range of the equilibrium climate sensitivity (ECS) could be 1.4 °C to 2.8 °C, with a mean of 2.1 °C (using the HadCRUT5 temperature record), which is compatible with the low-ECS CMIP6 GCM group.
However, if the proposed solar records are used as TSA proxies and the climatic sensitivity to them is allowed to differ from the climatic sensitivity to radiative forcings, a much greater solar impact on climate change is found, along with a significantly reduced radiative effect. In this case, the ECS is found to be 0.9-1.8 °C, with a mean of around 1.3 °C. Lower ECS ranges (up to 20%) are found using HadSST4, HadCRUT4, and HadSST3.
The result also suggests that about 80% of the solar influence on the climate may not be induced by TSI forcing alone, but rather by other Sun-climate processes (e.g., by a solar magnetic modulation of cosmic ray and other particle fluxes, and/or others), which must be thoroughly investigated and physically understood before trustworthy GCMs can be created. This result explains why empirical studies often found that the solar contribution to climate changes throughout the Holocene has been significant, whereas GCM-based studies, which only adopt radiative forcings, suggest that the Sun plays a relatively modest role. The appendix includes the proposed TSA records.
Comparative Analysis
Figure 5. (A) Anthropogenic (blue) and volcanic (orange) effective radiative forcing functions adopted by the CMIP6 GCMs (Masson-Delmotte et al., 2021). (B) Comparison between the solar effective radiative forcing function from Table Annex III of the IPCC-AR6 (green) (after Masson-Delmotte et al., 2021) and the three TSI forcing functions deduced from the TSI records shown in Fig. 4. All records are anomalies relative to their values in 1850.
The solar forcing functions depicted in Fig. 5B differ in several respects. Just a very modest secular trend can be seen for the solar forcing function used by the CMIP6 GCMs, which has remained nearly constant for about 200 years. Although not depicted in Fig. 5B, the TSI forcing adopted by the CMIP6 GCMs is so flat that even the 1790–1830 Dalton grand solar minimum almost coincides with the 1890–1910 solar minimum and the 2019 solar cycle minimum (Supplementary Data Table S5). Furthermore, because this record is also based on SATIRE and the PMOD TSI satellite composite, its solar effective forcing function decreased progressively from 1970 to 2020. Thus, by using this TSI record, the CMIP6 GCMs could only conclude that solar forcing did not account for almost any of the warming observed after the pre-industrial period (1850–1900), and, particularly, from 1980 to 2020. (Masson-Delmotte et al., 2021).
On the contrary, the other three TSI records reveal a multidecadal oscillation as well as a clear increasing secular trend from the Dalton solar minimum to 2000. More specifically, the TSI forcing significantly increased from the Dalton minimum (1810–1815) to around 1870–1876, then declined until around 1890–1905; it increased rapidly between 1910 and the 1940s, and declined again between 1950 and 1975. The TSI forcing then increased again until 2000, when it began to gradually fall until 2022. This oscillating pattern is especially noteworthy because, as demonstrated below, it is closely correlated with the changes observed in total surface temperature records, which show a very similar increasing trend and multi-decadal modulation (cf.: Scafetta et al., 2004, Scafetta and West, 2006, Scafetta and West, 2008, Scafetta, 2009, Scafetta, 2010, Scafetta, 2012b, Scafetta, 2013a, Scafetta, 2021b).
Figure 8. (A) HadCRUT5 global surface temperature versus the CMIP6 GCM ensemble average; (A’) the two records are detrended with the function f(t) = a (x-1850)2. (B) HadCRUT5 global surface temperature versus the energy balance model (Eq. (16)) using the TSI proxy model #2; (B’) the same as above. The green curves in Fig. 8A and B are sketches that highlight the different multi-decadal modulation of the red curves in Fig. 8A (monotonically increasing, like the anthropogenic forcing function) and in Fig. 8B (oscillating, like the temperature records).
Fig. 8 compares the HadCRUT5 global surface temperature record to (A) the CMIP6 GCM ensemble mean record and (B) the energy balance model (Eq. (16)) using the proposed TSI proxy model #2, which does not use the GCMs’ low secular-variability TSI record. The GCM simulation depicted in Fig.8A monotonically warms up, although occasional volcanic eruptions momentarily cause cold spikes; the monotonic warming trend produced by the model is simulated by the green curve. On the contrary, the model provided in Fig. 8B indicates an oscillating pattern developing around a warming trend. The global surface temperature record shows a similar growing trend, regulated by an approximately 60-year oscillation: the period 1880–1910 experienced a global cooling; the period 1910–1940 was characterized by considerable warming; and the period 1940–1970 experienced another global cooling. From 1880 to 1970, the model in Fig. 8B reproduces this oscillating pattern more precisely (corr. coeff. r = 0.79) than the CMIP6 GCM ensemble average simulation depicted in Fig. 8A (corr. coeff. r = 0.74). Thus, Fig. 8 illustrates that the suggested model (red curve, Fig. 8B) exhibits a multidecadal modulation that correlates significantly better with the temperature record (blue curve) than the GCM ensemble average simulation (red curve, Fig. 8A).
The different performance of the CMIP6 GCM ensemble average simulation and of the proposed regression model in reproducing the temperature pattern from 1850 to 1950 becomes more evident if a quadratic upward trend is detrended from the records. The correlation coefficient is r = 0.45 using the GCM ensemble average simulation (Fig. 8A’), and r = 0.55 using the proposed regression model (Fig. 8B’).
This result suggests that the observed multi-decadal modulation of the
temperature records could have been mostly determined by solar forcings,
and not by chaotic internal oscillations of the climate system.
Conclusion
The IPCC (Solomon and et al., 2007; Stocker and et al., 2014; Masson-Delmotte et al., 2021) conclusion that the Sun’s role in climate change has been negligible since the pre-industrial period (1850–1900) derives from the fact that this organization only consider the solar climatic signature produced by the present-day GCMs. These models, however, are computer programs that can only employ equations describing physical mechanisms that are already well known. Anything unknown or ambiguous cannot be included in the GCM software. If the climatic influence of neglected physical processes is significant,the reductionist approach employed in the GCMs for assessing climate change attributions may be completely inappropriate for the task.
The CMIP6 GCMs appear to greatly underestimate the Sun’s role in climate change because of two major limitations:
(i) erroneous solar forcings have likely been integrated into the models; and (ii) TSI alone appears to likely be not the most important solar forcing.
Additional solar-magnetism related forcings and associated mechanisms are not included in the GCMs because they are currently poorly understood, despite the fact that there are several empirical indications that they might sufficiently modulate the cloud cover system (by 5% or less) to explain a significant component of the observed climatic changes (Svensmark and Friis-Christensen, 1997, Shaviv, 2002, Svensmark et al., 2016, Easterbrook, 2019, Svensmark, 2022; ). In fact, Table 1 shows that the actual climate sensitivity to TSA variations, which is expressed by kS, can be 4-7 times greater than the climate sensitivity to radiative forcing alone, which was denoted by kA.
Thus, about 80% of the solar influence on the climate could be generated
by processes other than direct TSI forcing. If this result is correct,
several solar-climate mechanisms must be thoroughly investigated
and fully understood before reliable GCMs can be developed.
The Sun Rules, and Warming from CO2 is Impossible
A complement to Scafetta’s study is a Quadrant article by Mark Imisides explaining the geophysical realities ruling out global warming from CO2. DIY ocean heating (Hint: It’s the water, isn’t it?) Excerpts in italics with my bolds.
Scarcely a day goes by without us being warned of coastal inundation by rising seas due to global warming.
Carbon dioxide, we are told, traps heat that has been irradiated by the oceans,
and this warms the oceans and melts the polar ice caps.
While this seems a plausible proposition at first glance, when one actually examines it closely a major flaw emerges. In a nutshell, water takes a lot of energy to heat up, and air doesn’t contain much. In fact, on a volume/volume basis, the ratio of heat capacities is about 3300 to 1.
This means that to heat 1 litre of water by 1˚C it would take 3300 litres of air
that was 2˚C hotter, or 1 litre of air that was about 3300˚C hotter!
This shouldn’t surprise anyone. If you ran a cold bath and then tried to heat it by putting a dozen heaters in the room, does anyone believe that the water would ever get hot?
The problem gets even stickier when you consider the size of the ocean.
Basically, there is too much water and not enough air.
The ocean contains a colossal 1,500,000,000,000,000,000,000 litres of water! To heat it, even by a small amount, takes a staggering amount of energy. To heat it by a mere 1˚C, for example, an astonishing 6,000,000,000,000,000,000,000,000 joules of energy are required.
Let’s put this amount of energy in perspective. If we all turned off all our appliances and went and lived in caves, and then devoted every coal, nuclear, gas, hydro, wind and solar power plant to just heating the ocean, it would take a breathtaking 32,000 years to heat the ocean by just this 1˚C!
In short, our influence on our climate, even if we really tried, is miniscule!
So it makes sense to ask the question – if the ocean were to be heated by greenhouse warming of the atmosphere, how hot would the air have to get? If the entire ocean is heated by 1˚C, how much would the air have to be heated by to contain enough heat to do the job?
Well, unfortunately for every ton of water there is only a kilogram of air. Taking into account the relative heat capacities and absolute masses, we arrive at the astonishing figure of 4,000˚C.
That is, if we wanted to heat the entire ocean by 1˚C,
and wanted to do it by heating the air above it,
we’d have to heat the air to about 4,000˚C hotter than the water.
And another problem is that air sits on top of water – how would hot air heat deep into the ocean? Even if the surface warmed, the warm water would just sit on top of the cold water.
Thus, if the ocean were being heated by greenhouse heating of the air, we would see a system with enormous thermal lag – for the ocean to be only slightly warmer, the land would have to be substantially warmer, and the air much, much warmer (to create the temperature gradient that would facilitate the transfer of heat from the air to the water).
Therefore any measurable warmth in the ocean would be accompanied by a huge and obvious anomaly in the air temperatures, and we would not have to bother looking at ocean temperatures at all.
So if the air doesn’t contain enough energy to heat the oceans or melt the ice caps, what does?
The earth is tilted on its axis, and this gives us our seasons. When the southern hemisphere is tilted towards the sun, we have more direct sunlight and more of it (longer days). When it is tilted away from the sun, we have less direct sunlight and less of it (shorter days).
The direct result of this is that in summer it is hot and in winter it is cold. In winter we run the heaters in our cars, and in summer the air conditioners. In winter the polar caps freeze over and in summer 60-70% of them melt (about ten million square kilometres). In summer the water is warmer and winter it is cooler (ask any surfer).
All of these changes are directly determined
by the amount of sunlight that we get.
When the clouds clear and bathe us in sunlight, we don’t take off our jumper because of greenhouse heating of the atmosphere, but because of the direct heat caused by the sunlight on our body. The sun’s influence is direct, obvious, and instantaneous.
If the enormous influence of the sun on our climate is so obvious, then, by what act of madness do we look at a variation of a fraction of a percent in any of these variables, and not look to the sun as the cause?
Why on earth (pun intended) do we attribute any heating of the oceans to carbon dioxide, when there is a far more obvious culprit, and when such a straightforward examination of the thermodynamics render it impossible.
h/t tom0mason for inspiring this post, including his comment below
The Pendulum is Settled Science
I attended North Phoenix High School (Go Mustangs!) where students took their required physics class from a wild and crazy guy. Decades later alumni who don’t remember his name still reminisce about “the crazy science teacher with the bowling ball.”
To demonstrate the law of conservation of energy, he required each and every student to stand on a ladder in one corner of the classroom. Attached to a hook in the center of the rather high ceiling was a rope with a bowling ball on the other end. The student held the ball to his/her nose and then released it, being careful to hold still afterwards.
The 16 pound ball traveled majestically diagonally across the room and equally impressively returned along the same path. The proof of concept was established when the ball stopped before hitting your nose (though not by much). In those days we learned to trust science and didn’t need to go out marching to signal some abstract virtue.
The equations for pendulums are centuries old and can predict the position of the ball at any point in time based on the mass of the object, length of the rope and starting position.
Pictured above is the currently operating Foucault pendulum that exactly follows these equations. While it had long been known that the Earth rotates, the introduction of the Foucault pendulum in 1851 was the first simple proof of the rotation in an easy-to-see experiment. Today, Foucault pendulums are popular displays in science museums and universities.
What About the Double Pendulum?
Trajectories of a double pendulum
A comment by tom0mason at alerted me to the science demonstrated by the double compound pendulum, that is, a second pendulum attached to the ball of the first one. It consists entirely of two simple objects functioning as pendulums, only now each is influenced by the behavior of the other.
Lo and behold, you observe that a double pendulum in motion produces chaotic behavior. In a remarkable achievement, complex equations have been developed that can and do predict the positions of the two balls over time, so in fact the movements are not truly chaotic, but with considerable effort can be determined. The equations and descriptions are at Wikipedia Double Pendulum
Long exposure of double pendulum exhibiting chaotic motion (tracked with an LED)
But here is the kicker, as described in tomomason’s comment:
If you arrive to observe the double pendulum at an arbitrary time after the motion has started from an unknown condition (unknown height, initial force, etc) you will be very taxed mathematically to predict where in space the pendulum will move to next, on a second to second basis. Indeed it would take considerable time and many iterative calculations (preferably on a super-computer) to be able to perform this feat. And all this on a very basic system of known elementary mechanics.
And What about the Climate?
This is a simple example of chaotic motion and its unpredictability. How predictable is our climate with so many variables and feedbacks, some known some unknown? Consider that this planet’s weather/climate system is chaotic in nature with many thousands (millions?) of loosely coupled variables and dependencies, and many of these variables have very complex feedback features within them.
Hurricane Gladys, photographed from orbit by Apollo 7 in 1968 (Photo: NASA)
Summary
To quote the IPCC:
The climate system is a coupled non-linear chaotic system, and therefore the long-term prediction of future climate states is not possible. Rather the focus must be upon the prediction of the probability distribution of the system’s future possible states by the generation of ensembles of model solutions.
But as the IPCC emphasizes, the range for future projections remains enormous. The central question is “climate sensitivity” — the amount of warming that accompanies a doubling of carbon dioxide in the atmosphere. As of its Fifth Assessment Report in 2013, the IPCC could estimate only that this sensitivity is somewhere between 1.5 and 4.5°C. Nor is science narrowing that range. The 2013 assessment actually widened it on the low end, from a 2.0–4.5°C range in the prior assessment. And remember, for any specific level of warming, forecasts vary widely on the subsequent environmental and economic implications.
For now, though, navigating the climate debate will require translating the phrase “climate denier” to mean “anyone unsympathetic to the most aggressive activists’ claims.” This apparently includes anyone who acknowledges meaningful uncertainty in climate models, adopts a less-than-catastrophic outlook about the consequences of future warming, or opposes any facet of the activist policy agenda. The activists will be identifiable as the small group continuing to shout “Denier!” The “deniers” will be identifiable as everyone else.
Climate System Summation
Esteemed climate scientist Richard Lindzen ends a very fine recent presentation (here) with this description of the climate system:
I haven’t spent much time on the details of the science, but there is one thing that should spark skepticism in any intelligent reader. The system we are looking at consists in two turbulent fluids interacting with each other. They are on a rotating planet that is differentially heated by the sun. A vital constituent of the atmospheric component is water in the liquid, solid and vapor phases, and the changes in phase have vast energetic ramifications. The energy budget of this system involves the absorption and reemission of about 200 watts per square meter. Doubling CO2 involves a 2% perturbation to this budget. So do minor changes in clouds and other features, and such changes are common. In this complex multifactor system, what is the likelihood of the climate (which, itself, consists in many variables and not just globally averaged temperature anomaly) is controlled by this 2% perturbation in a single variable? Believing this is pretty close to believing in magic. Instead, you are told that it is believing in ‘science.’ Such a claim should be a tip-off that something is amiss. After all, science is a mode of inquiry rather than a belief structure.
Flow Diagram for Climate Modeling, Showing Feedback Loops
Dissenters from the catastrophe consensus on warming are worth listening to.
Stop with all the existential-crisis talk. President Biden said, “Climate change is literally an existential threat to our nation and to the world.” Defense Secretary Lloyd Austin also talks about the “existential threat” of climate change. National security adviser Jake Sullivan identifies an “accelerating climate crisis” as one reason for a “new consensus” for government picking winners and losers in the economy. Be wary of those touting consensus.
But what if the entire premise is wrong?What if the Earth is self-healing? Before you hurl the “climate denier” invective at me, let’s think this through. Earth has been around for 4.5 billion years— living organisms for 3.7 billion. Surely, an enlightened engineer might think, the planet’s creator built in a mechanism to regulate heat, or we wouldn’t still be here to worry about it.
The theory of climate change is that excess carbon dioxide and methane trap the sun’s radiation in the atmosphere, and these man-made greenhouse gases reflect more of that heat back to Earth, warming the planet. Pretty simple. Eventually, we reach a tipping point when positive feedback loops form—less ice to reflect sunlight, warm oceans that can no longer absorb carbon dioxide—and then we fry, existentially. So lose those gas stoves and carbon spewing Suburbans.
Note nearly half incoming solar energy is not absorbed by Earth’s surface.
But nothing is simple. What about negative feedback loops? Examples: human sweat and its cooling condensation or our irises dilating or constricting based on the amount of light coming in. Clouds, which can block the sun or trap its radiation, are rarely mentioned in climate talk.
Why? Because clouds are notoriously difficult to model in climate simulations. Steven Koonin, a New York University professor and author of “Unsettled,” tells me that today’s computing power can typically model the Earth’s atmosphere in grids 60 miles on a side. Pretty coarse. So, Mr. Koonin says, “the properties of clouds in climate models are often adjusted or ‘tuned’ to match observations.” Tuned!
Last month the coddling modelers at the United Nations’ World Meteorological Organization stated that “warming El Niño” and “human-induced climate change” mean there is a “66% likelihood that annual average global temperatures will exceed the threshold of 1.5 degrees Celsius above preindustrial levels by 2027.” Notice that El Niño is mentioned first.
To enlarge open image in new tab.
Richard Lindzen, a professor at the Massachusetts Institute of Technology and lead author of an early Intergovernmental Panel on Climate Change report, told me, “Temperatures in the tropics remain relatively constant compared with changes in the tropics-to-pole temperatures. The tropics-polar difference is about 40 degrees Celsius today but was 20 degrees during the warm Eocene Epoch and 60 degrees during Ice Ages.” This difference has more to do with changes in the Earth’s rotation, like wobbling, than anything else. According to Mr. Lindzen, this effect is some 70 times as great as human-made greenhouse gases.
OK, back to clouds. Cumulus clouds, the puffy ones often called thunderclouds, are an important convection element, carrying heat from the Earth’s surface to the upper atmosphere. Above them are high-altitude cirrus clouds, which can reflect heat back toward the surface. A 2001 Lindzen paper, however, suggests that high-level cirrus clouds in the tropics dissipate as temperatures rise. These thinning cirrus clouds allow more heat to escape. It’s called the Iris Effect, like a temperature-controlled vent opener for an actual greenhouse so you don’t (existentially) fry your plants. Yes, Earth has a safety valve.
Mr. Lindzen says, “This more than offsets the effect of greenhouse gases.” As you can imagine, theories debunking the climate consensus are met with rebuttals and more papers. Often, Mr. Lindzen points out, critics, “to maintain the warming narrative, adjust their models, especially coverage and reflection or albedo of clouds in the tropics.” More tuning.
A 2021 paper co-authored by Mr. Lindzen shows strong support for an Iris Effect. Maybe Earth really was built by an engineer. Proof? None other than astronomer Carl Sagan described the Faint Young Sun Paradox that, 2.5 billion years ago, the sun’s energy was 30% less, but Earth’s climate was basically the same as today. Cirrus clouds likely formed to trap heat—a closed Iris and a negative feedback loop at work.
Figure 2: At higher temperatures there are more thunderstorms over the ocean and the area without high level clouds (dry and clear) expands further and thus allows more heat to radiate off into space (strong OLR) than when temperatures are lower, i.e. when the iris is smaller. Source: Figure 1 from MS15.
In a 2015 Nature Geoscience paper, Thorsten Mauritsen and Bjorn Stephen at the Max Planck Institute for Meteorology reran climate models using the Iris Effect and found them better at modeling historic observations. No need for tuning. Wouldn’t it be nice if the U.N. used realistic cloud and climate models?
Earth has warmed, but I’m convinced negative feedback loops will save us. Dismissing the Iris Effect or detuning it isn’t science. Sadly, climate science has morphed into climate rhetoric. And note, Treasury Secretary Janet Yellen explained in April that green spending “is, at its core, about turning the climate crisis into an economic opportunity.” Hmmm. “Catastrophic,” “existential” and “crisis” are cloudy thinking. Negative feedback is welcome. Dissenters from the catastrophe consensus on warming are worth listening to.
Footnote–Phanerozoic Temperatures
Maurice Lavigne commented that the best evidence of our self-regulating climate is found in the Phanerozoic temperature record. I had to find out what he meant, which led me to discover this:
Cosmic radiation and temperature through Phanerozoic according to Nir Shaviv and Jan Veizer. The vertical axis on the left represents the temperature as deviations from present temperature. The vertical axis on the right shows the cosmic radiation as multiples of radiation today – today’s radiation is set to 1. Note that the right scale is inverted so that strong radiation can be compared to low temperature. The red curve represents the temperature and the blue radiation. Temperature and cosmic radiation appear to have a very good correlation. The horizontal axis represents time through Phanerozoic’s more than 500 million years. Note that the Carboniferous is divided into “Missisipian” and “Pennsylvanian”, that is an American custom, referring to different types of coal from the coal mines.
The image above comes from Christopher Scotese PaleoMAP project, showing the dramatic temperature and climate shifts, hothouse to icehouse and everything in between. Finally, a graph showing these temperature cycles unrelated to CO2 concentrations.
Jørgen Peder Steffensen, of Denmark’s Niels Bohr Institute, is one of the most experienced experts in ice core analysis, in both Greenland and Antarctica. In this video he explains a coincidence that has misled those alarmed about the warming recovery since the Little Ice Age. And if you skip to 2:25, you will see the huge error we have made and the assumptions and extrapolations based on that error. Transcript below is from closed captions with my bolds and added images. H/T Raymond
What do ice cores tell us about the history of climate change and the present trend?
This ice is from the Viking age around the year one thousand, also called the medieval warm period. We believe that in Greenland the Medieval Warm Period was about one and a half degrees warmer on average than today
NorthGRIP the Greenland ice core project is being reopened to drill the last few meters through the ice sheet to the rock beneath the research station. The ice core over three kilometers in length has been hauled up to the surface piece by piece, and contains important data on the history of the climate of the earth. It bears the fingerprints of climatic conditions over more than 120 thousand years.
When we remove a drilled ice core we leave a hole, and we insert a thermometer in the hole. We are able to map out the temperature through the three kilometer ice sheet. Now that temperature, if we do it precisely enough with a thousandth of a degree accuracy, then the ice has not forgotten how cold or warm it was on the surface at the time the snow fell.
So using those temperatures we have been able to reconstruct the temperatures of the last ten thousand years. Here we have our picture of the temperature reconstructions that we have from Greenland in the graphical form. And if we go back along this axis it’s going back in time. This is the last 8 000 years we have plotted here. On this axis we have the temperatures at the site in Greenland, and we can see that if we go back from now about 4000 years ago, we would have temperatures up here for about 4 000 years in the past that on average were two and a half degrees warmer than today.
Reconstructed temperatures for Greenland ice cores Dye3 and GRIP. (A) The temperature from 8000 BP to present; (B) the temperature from AD 0-2000 (after Dahl-Jensen et al., 1998). The observed difference in amplitude between the two cores is a result of their different geographic location in relation to the variability in atmospheric circulation. Source: Reconstructed-temperatures-for-Greenland-ice-cores-Dye3-and-GRIP-A
Now as we go forward to approach our time, we can see that in the period after four thousand years ago and up to the two thousand years ago (which is actually the Roman Age) the temperatures have been decreasing in Greenland by two and a half degrees. Then temperatures increased gradually up to a maximum point around a thousand years ago, we call it the Medieval Warm Period. And then temperatures declined and go down to minimum around 1650 a.d., before coming back up a little in the 18th century.
And then around 1875 we have right here the lowest point in the last 10,000 years.
And that matches exactly the time when meteorological observations started.
Other core samples from elsewhere in Greenland confirmed that the little ice age ended about 140 years ago at the coldest point in the last 10,000 years. The natural pronounced alteration of warm and cold periods back in time has also been confirmed elsewhere in the northern hemisphere. Carbon 14 dating of organic matter from peat bogs and tree rings confirms the pattern. Also the data from stalactite caves in China and measurements from North Africa.
The problem is that we can all agree completely that we have had a global temperature increase in the 20th century. Yes, but an increase from what? It was probably an increase from the lowest point we’ve had for the last 10,000 years. And this means it will be very hard indeed to prove whether the increase of temperature in the 20th century was man-made or it’s a natural variation. That would be very hard because we made ourselves an extremely poor experiment when we started to observe meteorology at the coldest time in the last ten thousand years.
Dr. Syun Akasofu 2009 diagram from his paper Two Natural Components of Recent Warming.
There are various answers to the title question. IPCC doctrine asserts that not only does more CO2 induce warming, it also triggers a water vapor positive feedback that triples the warming. Many other scientists, including some skeptical of any climate “emergency,” agree some CO2 warming is likely, but doubt the positive feedback, with the possibility the sign is wrong. Still others point out that increases of CO2 lag temperature increases on all time scales, from ice core data to last month’s observations. CO2 can hardly be claimed to cause warming, when CO2 changes do not precede the effect. [See Temps Cause CO2 Changes, Not the Reverse. ]
Below is a post describing how CO2 warming is not only lacking, but more CO2 actually increases planetary cooling. The mathematical analysis reveals a fundamental error in the past and only now subjected to correction.
In 1896, Svante Arrhenius proposed a model predicting that increased concentration of carbon dioxide and water vapour in the atmosphere would result in a warming of the planet. In his model, the warming effects of atmospheric carbon dioxide and water vapour in preventing heat flow from the Earth’ s surface (now known as the “Greenhouse Effect”) are counteracted by a cooling effect where the same gasses are responsiblefor the radiation of heat to space from the atmosphere. His analysis found that there was a net warming effect and his model has remained the foundation of the Enhanced Greenhouse Effect—Global Warming hypothesis.
This paper attempts to quantify the parameters in his equations but on evaluation his model cannot produce thermodynamic equilibrium. A modified model is proposed which reveals that increased atmospheric emissivity enhances the ability of the atmosphere to radiate heat to space overcoming the cooling effect resulting in a net cooling of the planet. In consideration of this result, there is a need for greenhouse effect—global warming models to be revised.
1. Introduction
In 1896 Arrhenius proposed that changes in the levels of “carbonic acid” (carbon dioxide) in the atmosphere could substantially alter the surface temperature of the Earth. This has come to be known as the greenhouse effect. Arrhenius’ paper, “On the Influence of Carbonic Acid in the Air upon the Temperature of the Ground”, was published in Philosophical Magazine. Arrhenius concludes:
“If the quantity of carbonic acid in the air should sink to one-half its present percentage, the temperature would fall by about 4˚; a diminution to one-quarter would reduce the temperature by 8˚. On the other hand, any doubling of the percentage of carbon dioxide in the air would raise the temperature of the earth’s surface by 4˚; and if the carbon dioxide were increased fourfold, the temperature would rise by 8˚ ” [ 2 ].
It is interesting to note that Arrhenius considered this greenhouse effect a positive thing if we were to avoid the ice ages of the past. Nevertheless, Arrhenius’ theory has become the foundation of the enhanced greenhouse effect―global warming hypothesis in the 21st century. His model remains the basis for most modern energy equilibrium models.
2. Arrhenius’ Energy Equilibrium Model
Arrhenius’ proposed a two-part energy equilibrium model in which the atmosphere radiates the same amount of heat to space as it receives and, likewise, the ground transfers the same amount of heat to the atmosphere and to space as it receives. The model contains the following assumptions:
• Heat conducted from the center of the Earth is neglected.
• Heat flow by convection between the surface and the atmosphere and throughout the atmosphere remains constant.
• Cloud cover remains constant. This is questionable but allows the model to be quantified.
Part 1: Equilibrium of the Air
The balance of heat flow to and from the air (or atmosphere) has four components as shown in Figure 1. The arrow labelled S1 indicates the solar energy absorbed by the atmosphere. R indicates the infra-red radiation from the surface of the Earth to the atmosphere, M is the quantity of heat “conveyed” to the atmosphere by convection and Q1 represents heat loss from the atmosphere to space by radiation. All quantities are measured in terms of energy per unit area per unit time (W/m2).
Figure 1. Model of the energy balance of the atmosphere. The heat received by the atmosphere ( R+M+S1 ) equals the heat lost to space (Q1). In this single layer atmospheric model, the absorbing and emitting layers are one and the same.
Part 2: Thermal Equilibrium of the Ground
In the second part of his model, Arrhenius describes the heat flow equilibrium at the “ground” or surface of the Earth. There are four contributions to the surface heat flow as shown in Figure 2. S2 is the solar energy absorbed by the surface, R is the infra-red radiation emitted from the surface and transferred to the atmosphere, N is the heat conveyed to the atmosphere by convection and Q2 is the heat radiated to space from the surface. Note: Here Arrhenius uses the term N for the convective heat flow. It is equivalent to the term M used in the air equilibrium model.
Figure 2. The energy balance at the surface of the Earth. The energy received by the ground is equal to the energy lost.
3. Finding the Temperature of the Earth
Arrhenius combined these equations and, by eliminating the temperature of the atmosphere which according to Arrhenius “has no considerable interest”, he arrived at the following relationship:
ΔTg is the expected change in the temperature of the Earth for a change in atmospheric emissivity from ε1 to ε2. Arrhenius determined that the current transparency of the atmosphere was 0.31 and, therefore the emissivity/absorptivity ε1 = 0.69. The current mean temperature for the surface of the Earth can be assumed to be To = 288 K.
Figure 3. Arrhenius’ model is used to determine the mean surface temperature of the Earth as a function of atmospheric emissivity ε. For initial conditions, ε = 0.69 and the surface temperature is 288 K. An increase in atmospheric emissivity produces an increase in the surface temperature of the Earth.
Arrhenius estimated that a doubling of carbon dioxide concentration in the atmosphere would produce a change in emissivity from 0.69 to 0.78 raising the temperature of the surface by approximately 6 K. This value would be considered high by modern climate researchers; however, Arrhenius’ modelhas become the foundation of the greenhouse-global warming theory today. Arrhenius made no attempt to quantify the specific heat flow values in his model. At the time of his paper there was little quantitative data available relating to heat flow for the Earth.
4. Evaluation of Arrhenius’ Model under Present Conditions
More recently, Kiehl and Trenberth (K & T) [ 3 ] and others have quantified the heat flow values used in Arrhenius’ model. K & T’s data are summarised in Figure 4.
The reflected solar radiation, which plays no part in the energy balance described in this model, is ignored. R is the net radiative transfer from the ground to the atmosphere derived from K & T’s diagram. The majority of the heat radiated to space originates from the atmosphere (Q1 > Q2). And the majority of the heat lost from the ground is by means of convection to the atmosphere (M > R + Q2).
Figure 4. Model of the mean energy budget of the earth as determined by Kiehl and Trenberth.
Equation (5) Q2=(1−ε)σνT4e(5)
Substituting ε = 0.567, ν = 1.0 and Tg = 288 K we get: Q2=149.2 W/m2
Using Arrhenius value of 0.69 for the atmospheric emissivity Q2 = 120.9 W/m2.
Both values are significantly more than the 40 W/m2 determined by K & T.
The equation will not balance, something is clearly wrong.
Figure 5 illustrates the problem.
Equation (5) is based on the Stefan-Boltzmann law which is an empirical relationship which describes the amount of radiation from a hot surface passing through a vacuum to a region of space at a temperature of absolute zero. This is clearly not the case for radiation passing through the Earth’s atmosphere and as a result the amount of heat lost by radiation has been grossly overestimated.
No amount of adjusting parameters will allow this relationship to produce
sensible quantities and the required net heat flow of 40 W/m2.
This error affects the equilibrium heat flow values in Arrhenius’ model and the model is not able to produce a reasonable approximation of present day conditions as shown in Table 1. In particular, the convective heat flow takes on very different values from the two parts of the model. The values M and N in the table should be equivalent.
5. A New Energy Equilibrium Model
A modified model is proposed which will determine the change in surface temperature of the Earth caused by a change in the emissivity of the atmosphere (as would occur when greenhouse gas concentrations change). The model incorporates the following ideas:
1) The total heat radiated from the Earth ( Q1+Q2Q1+Q2 ) will remain constant and equal to the total solar radiation absorbed by the Earth ( S1+S2S1+S2 ).
2) Convective heat flow M remains constant. Convective heat flow between two regions is dependent on their temperature difference, as expressed by Newton’s Law of cooling1. The temperature difference between the atmosphere and the ground is maintained at 8.9 K (see Equation 7(a)). M = 102 W/m2 (K & T).
3) A surface temperature of 288 K and an atmospheric emissivity of 0.567 (Equation (7b)) is assumed for initial or present conditions.
Equation (9) represents the new model relating the emissivity of the atmosphere ε to the surface temperature Tg. Results from this model are shown in Table 2. The table shows the individual heat flow quantities and the temperature of the surface of the Earth that is required to maintain equilibrium:
The table shows that as the value of the atmospheric emissivity ε is increased less heat flows from the Earth’s surface to space, Q2 decreases. This is what would be expected. As well, more heat is radiated to space from the atmosphere; Q1 increases. This is also expected. The total energy radiated to space Q1+Q2=235 W/m2 . A plot of the resultant surface temperature Tg versus the atmospheric emissivity ε is shown below Figure 6.
Figure 6. Plot of the Earth’s mean surface temperature as a function of the atmospheric emissivity. This model predicts that the temperature of the Earth will decrease as the emissivity of the atmosphere increases.
6. Conclusion
Arrhenius identified the fact that the emissivity/absorptivity of the atmosphere increased with increasing greenhouse gas concentrations and this would affect the temperature of the Earth. He understood that infra-red active gases in the atmosphere contribute both to the absorption of radiation from the Earth’s surface and to the emission of radiation to space from the atmosphere. These were competing processes; one trapped heat, warming the Earth; the other released heat, cooling the Earth. He derived a relationship between the surface temperature and the emissivity of the atmosphere and deduced that an increase in emissivity led to an increase in the surface temperature of the Earth.
However, his model is unable to produce sensible results for the heat flow quantities as determined by K & T and others. In particular, his model and all similar recent models, grossly exaggerate the quantity of radiative heat flow from the Earth’s surface to space. A new energy equilibrium model has been proposed which is consistent with the measured heat flow quantities and maintains thermal equilibrium. This model predicts the changes in the heat flow quantities in response to changes in atmospheric emissivity and reveals that Arrhenius’ prediction is reversed. Increasing atmospheric emissivity due to increased greenhouse gas concentrations will have a net cooling effect.
It is therefore proposed by the author that any attempt to curtail emissions of CO2
will have no effect in curbing global warming.
Summary:
If Stannard is right, then the unthinkable, inconvenient truth is: More CO2 cools, rather than warms the planet. As noted before, we have enjoyed a modern warming period with the recovery of temperatures ending the Little Ice Age. But cold is the greater threat to human life and prosperity, and as well to the biosphere. Society’s priorities should be to ensure reliable affordable energy, and robust infrastructure to meet the demands of future cooling, which will eventually bring down CO2 concentrations in its wake.
Footnote:
A comment below refers to the cartoon image at the top which was an older version of K & T. The more recent version was used by the author and has slightly different numbers. Below is the actual model he analyzed:
I agree that these energy budgets oversimplify the real world, and the author’s intention is not to correct the details, but to show that the models fail when taken at face value. He is focusing on the imbalance arising from applying Stefan-Boltzmann law to an atmospheric planet. As noted below there are other challenging issues such as using the average frequency of visual light for calculating W/m^2, which is not realistic for earth’s LW radiation.
Figure 1. Graph showing the number of volcanoes reported to have been active each year since 1800 CE. Total number of volcanoes with reported eruptions per year (thin upper black line) and 10-year running mean of same data (thick upper red line). Lower lines show only the annual number of volcanoes producing large eruptions (>= 0.1 km3 of tephra or magma) and scale is enlarged on the right axis; thick red lower line again shows 10-year running mean. Global Volcanism Project Discussion
Update April 28, 2023
I am prompted by a discussion at WUWT regarding the role of SO2 in causing climate variabiity. There are some voices claiming that reduced SO2 from smaller vocanic activity in the Middle Ages caused warming, leading to droughts, crop failures, etc. And that we could be causing global warming by removing SO2 from the air in modern times. As the research cited below explains, there is a likely role for volcanic SO2 to cause global cooling, which resulted in the crop failures and the “dark ages”.
In discussion with Kip Hansen, it occurred to me that the process and equation could be explained by the steady recovery from the LIA (Little Ice Age). That reminded me of this relevant discussion about the causes of the LIA, what ended it, and why the warming recovery from it may now be over.
Volcanoes and the Little Ice Age
University of Bern confirms in a recent announcement that volcanoes triggered the depths of the LIA (Little Ice Age). Their article is Volcanoes shaped the climate before humankind. H/T GWPF. However, they spin the story in support of climate alarm (emergency, whatever), rather than making the more obvious point that recent warming was recovering to roughly Medieval Warming levels after the abnormal cooling disruption from volcanoes. Excerpt in italics with my bolds.
“The new Bern study not only explains the global early 19th century climate, but it is also relevant for the present. “Given the large climatic changes seen in the early 19th century, it is difficult to define a pre-industrial climate,” explains lead author Stefan Brönnimann, “a notion to which all our climate targets refer.” And this has consequences for the climate targets set by policymakers, who want to limit global temperature increases to between 1.5 and 2 degrees Celsius at the most. Depending on the reference period, the climate has already warmed up much more significantly than assumed in climate discussions. The reason: Today’s climate is usually compared with a 1850-1900 reference period to quantify current warming. Seen in this light, the average global temperature has increased by 1 degree. “1850 to 1900 is certainly a good choice but compared to the first half of the 19th century, when it was significantly cooler due to frequent volcanic eruptions, the temperature increase is already around 1.2 degrees,” Stefan Brönnimann points out.”
Bern seems preoccupied with targets and accounting, while others are concerned to understand the role of volcanoes in natural climate change. A previous post gives a more detailed explanation, thanks to a suggestion I received.
The LIA Warming Rebound Is Over
Thanks to Dr. Francis Manns for drawing my attention to the role of Volcanoes as a climate factor, particularly related to the onset of the Little Ice Age (LIA), 1400 to 1900 AD. I was aware that the temperature record since about 1850 can be explained by a steady rise of 0.5C per century rebound overlaid with a quasi-60 year cycle, most likely oceanic driven. See below Dr. Syun Akasofu 2009 diagram from his paper Two Natural Components of Recent Warming. When I presented this diagram to my warmist friends, they would respond, “But you don’t know what caused the LIA or what ended it!” To which I would say, “True, but we know it wasn’t due to burning fossil fuels.” Now I find there is a body of evidence suggesting what caused the LIA and why the temperature rebound may be over. Part of it is a familiar observation that the LIA coincided with a period when the sun was lacking sunspots, the Maunder Minimum, and later the Dalton.
Not to be overlooked is the climatic role of volcano activity inducing deep cooling patterns such as the LIA. Jihong Cole-Dai explains in a paper published 2010 entitled Volcanoes and climate. Excerpt in italics with my bolds.
There has been strong interest in the role of volcanism during the climatic episodes of Medieval Warm Period (MWP,800–1200 AD) and Little Ice Age (LIA, 1400–1900AD), when direct human influence on the climate was negligible. Several studies attempted to determine the influence of solar forcing and volcanic forcing and came to different conclusions: Crowley and colleagues suggested that increased frequency of stratospheric eruptions in the seventeenth century and again in the early nineteenth century was responsible in large part for LIA. Shindell et al. concluded that LIA is the result of reduced solar irradiance, as seen in the Maunder Minimum of sunspots, during the time period. Ice core records show that the number of large volcanic eruptions between 800 and 1100 AD is possibly small (Figure 1), when compared with the eruption frequency during LIA. Several researchers have proposed that more frequent large eruptions during the thirteenth century(Figure 1) contributed to the climatic transition from MWP to LIA, perhaps as a part of the global shift from a warmer to a colder climate regime. This suggests that the volcanic impact may be particularly significant during periods of climatic transitions.
Weighted annual average concentration of volcanic sulfate for the period of 176–2005 AD in a South Pole, Antarctica ice core (Cole-Dai, manuscript in preparation).
How volcanoes impact on the atmosphere and climate
The major component of volcanic eruptions is the matter that emerges as solid, lithic material or solidifies into large particles, which are referred to as ash or tephra. These particles fall out of the atmosphere very rapidly, on timescales of minutes to a few days, and thus have no climatic impacts but are of great interest to volcanologists, as seen in the rest of this encyclopedia. When an eruption column still laden with these hot particles descends down the slopes of a volcano, this pyroclastic flow can be deadly to those unlucky enough to be at the base of the volcano. The destruction of Pompeii and Herculaneum after the AD 79 Vesuvius eruption is the most famous example.
Volcanic eruptions typically also emit gases, with H2O, N2, and CO2 being the most abundant. Over the lifetime of the Earth, these gases have been the main source of the Earth’s atmosphere and ocean after the primitive atmosphere of hydrogen and helium was lost to space. The water has condensed into the oceans, the CO2 has been changed by plants into O2 or formed carbonates, which sink to the ocean bottom, and some of the C has turned into fossil fuels. Of course, we eat plants and animals, which eat the plants, we drink the water, and we breathe the oxygen, so each of us is made of volcanic emissions. The atmosphere is now mainly composed of N2 (78%) and O2 (21%), both of which had sources in volcanic emissions.
Of these abundant gases, both H2O and CO2 are important greenhouse gases, but their atmospheric concentrations are so large (even for CO2 at only 400 ppm in 2013) that individual eruptions have a negligible effect on their concentrations and do not directly impact the greenhouse effect. Global annually averaged emissions of CO2 from volcanic eruptions since 1750 have been at least 100 times smaller than those from human activities. Rather the most important climatic effect of explosive volcanic eruptions is through their emission of sulfur species to the stratosphere, mainly in the form of SO2, but possibly sometimes as H2S. These sulfur species react with H2O to form H2SO4 on a timescale of weeks, and the resulting sulfate aerosols produce the dominant radiative effect from volcanic eruptions.
The major effect of a volcanic eruption on the climate system is the effect of the stratospheric cloud on solar radiation (Figure 53.1). Some of the radiation is scattered back to space, increasing the planetary albedo and cooling the Earth’s atmosphere system. The sulfate aerosol particles (typical effective radius of 0.5 mm, about the same size as the wavelength of visible light) also forward scatter much of the solar radiation, reducing the direct solar beam but increasing the brightness of the sky. After the 1991 Pinatubo eruption, the sky around the sun appeared more white than blue because of this. After the El Chicho´n eruption of 1982 and the Pinatubo eruption of 1991, the direct radiation was significantly reduced, but the diffuse radiation was enhanced by almost as much. Nevertheless, the volcanic aerosol clouds reduced the total radiation received at the surface.
Although solar variability has often been considered the primary agent for LIA cooling, the most comprehensive test of this explanation (Hegerl et al., 2003) points instead to volcanism being substantially more important, explaining as much as 40% of the decadal-scale variance during the LIA. Yet, one problem that has continually plagued climate researchers is that the paleo-volcanic record, reconstructed from Antarctic and Greenland ice cores, cannot be well calibrated against the instrumental record. This is because the primary instrumental volcano reconstruction used by the climate community is that of Sato et al. (1993), which is relatively poorly constrained by observations prior to 1960 (especially in the southern hemisphere).
Here, we report on a new study that has successfully calibrated the Antarctic sulfate record of volcanism from the 1991 eruptions of Pinatubo (Philippines) and Hudson (Chile) against satellite aerosol optical depth (AOD) data (AOD is a measure of stratospheric transparency to incoming solar radiation). A total of 22 cores yield an area-weighted sulfate accumulation rate of 10.5 kg/km2 , which translates into a conversion rate for AOD of 0.011 AOD/ kg/km2 sulfate. We validated our time series by comparing a canonical growth and decay curve for eruptions for Krakatau (1883), the 1902 Caribbean eruptions (primarily Santa Maria), and the 1912 eruption of Novarupta/Katmai (Alaska)
We therefore applied the methodology to part of the LIA record that had some of the largest temperature changes over the last millennium.
Figure 2: Comparison of 30-90°N version of ice core reconstruction with Jones et al. (1998) temperature reconstruction over the interval 1630-1850. Vertical dashed lines denote levels of coincidence between eruptions and reconstructed cooling. AOD = Aerosol Optical Depth.
The ice core chronology of volcanoes is completely independent of the (primarily) tree ring based temperature reconstruction. The volcano reconstruction is deemed accurate to within 0 ± 1 years over this interval. There is a striking agreement between 16 eruptions and cooling events over the interval 1630-1850. Of particular note is the very large cooling in 1641-1642, due to the concatenation of sulfate plumes from two eruptions (one in Japan and one in the Philippines), and a string of eruptions starting in 1667 and culminating in a large tropical eruption in 1694 (tentatively attributed to Long Island, off New Guinea). This large tropical eruption (inferred from ice core sulfate peaks in both hemispheres) occurred almost exactly at the beginning of the coldest phase of the LIA in Europe and represents a strong argument against the implicit link of Late Maunder Minimum (1640-1710) cooling to solar irradiance changes.
Figure 1: Comparison of new ice core reconstruction with various instrumental-based reconstructions of stratospheric aerosol forcing. The asterisks refer to some modification to the instrumental data; for Sato et al. (1993) and the Lunar AOD, the asterisk refers to the background AOD being removed for the last 40 years. For Stothers (1996), it refers to the fact that instrumental observations for Krakatau (1883) and the 1902 Caribbean eruptions were only for the northern hemisphere. To obtain a global AOD for these estimates we used Stothers (1996) data for the northern hemisphere and our data for the southern hemisphere. The reconstruction for Agung eruption (1963) employed Stothers (1996) results from 90°N-30°S and the Antarctic ice core data for 30-90°S.
During the 18th century lull in eruptions, temperatures recovered somewhat but then cooled early in the 19th century. The sequence begins with a newly postulated unknown tropical eruption in midlate 1804, which deposited sulfate in both Greenland and Antarctica. Then, there are four well-documented eruptions—an unknown tropical eruption in 1809, Tambora (1815) and a second doublet tentatively attributed in part to Babuyan (Philippines) in 1831 and Cosiguina (Nicaragua) in 1835. These closely spaced eruptions are not only large but have a temporally extended effect on climate, due to the fact that they reoccur within the 10-year recovery timescale of the ocean mixed layer.
The ocean has not recovered from the first eruption so the second eruption drives the temperatures to an even lower state.
Abstract: Contrary to popular media and urban mythology the global warming we have experienced since the Little Ice Age is likely finished. A review of 10 temperature time series from US cities ranging from the hottest in Death Valley, CA, to possible the most isolated and remote at Key West, FL, show rebound from the Little Ice Age (which ended in the Alps by 1840) by 1870. The United States reached temperatures like modern temperatures (1950 – 2000) by about 1870, then declined precipitously principally caused by Krakatoa, and a series of other violent eruptions. Nine of these time series started when instrumental measurement was in its infancy and the world was cooled by volcanic dust and sulphate spewed into the atmosphere and distributed by the jet streams. These ten cities represent a sample of the millions of temperature measurements used in climate models. The average annual temperatures are useful because they account for seasonal fluctuations. In addition, time series from these cities are punctuated by El Nino Southern Oscillation (ENSO).
As should be expected, temperature at each city reacted differently to differing events. Several cities measured the effects of Krakatoa in 1883 while only Death Valley, CA and Berkeley CA sensed the minor new volcano Paricutin in Michoacán, Mexico. The Key West time series shows rapid rebound from the Little Ice Age as do Albany, NY, Harrisburg, PA, and Chicago. IL long before the petroleum-industrial revolution got into full swing. Recording at most sites started during a volcanic induced temperature minimum thus giving an impression of global warming to which industrial carbon dioxide is persuasively held responsible. Carbon dioxide, however, cannot be proven responsible for these temperatures. These and likely subsequent temperatures could be the result of regression to the normal equilibriumtemperatures of the earth (for now). If one were to remove the volcanic punctuation and El Nino Southern Oscillation (ENSO) input many would display very little alarming warming from 1815 to 2000. This review illustrates the weakness of linear regression as a measure of change. If there is a systemic reason for the global warming hypothesis, it is an anthropogenic error in both origin and termination. ENSO compliments and confirms the validity of NOAA temperature data. Temperatures since 2000 during the current hiatus are not available because NOAA has closed the public website.
Example of time series from Manns. Numbers refer to major named volcano eruptions listed in his paper. For instance, #3 was Krakatoa
The cooling effect is said to have lasted for 5 years after Krakatoa erupted – from 1883 to 1888. Examination of these charts, However, shows that, e.g., Krakatoa did not add to the cooling effect from earlier eruptions of Cosaguina in 1835 and Askja in 1875. The temperature charts all show rapid rebound to equilibrium temperature for the region affected in a year or two at most.
Fourteen major volcanic eruptions, however, were recorded between 1883 and 1918 (Robock, 2000, and this essay). Some erupted for days or weeks and some were cataclysmic and shorter. The sum of all these eruptions from Krakatoa onward effected temperatures early in the instrumental age. Judging from wasting glaciers in the Alps, abrupt retreat began about 1860).
Manns Conclusions: 1) Four of these time series (Albany, Harrisburg, Chicago and Key West) show recovery to the range of today’s temperatures by 1870 before the eruption of Askja in 1875. The temperature rebounded very quickly after the Little Ice Age in the northern hemisphere.
2)Volcanic eruptions and unrelated huge swings shown from ENSO largely rule global temperature. Volcanic history and the El Nino Southern Oscillation (ENSO) trump all other increments of temperature that may be hidden in the lists.
3) The sum of the eruptions from Krakatoa (1883) to Katla (1918) and Cerro Azul (1932) was a cold start for climate models.
4) It is beyond doubt that academic and bureau climate models use data that was gathered when volcanic activity had depressed global temperature. The cluster from Krakatoa to Katla (1883 -1918) were global.
5) Modern events, Mount Saint Helens and Pinatubo, moreover, were a fraction of the event intensity of the late 19th and early 20th centuries eruptions.
6)The demise of frequent violent volcanos has allowed the planet to regress toward a norm (for now).
The forecast above did not mention the January 15, 2022 major eruption of Hunga Ha’apai volcano in Tonga.
Summary
These findings describe a natural process by which a series of volcanoes along with a period of quiet solar cycles ended the Medieval Warm Period (MWP), chilling the land and inducing deep oceanic cooling resulting in the Little Ice Age. With much less violent volcanic activity in the 20th century, coincidental with typically active solar cycles, a Modern Warm Period ensued with temperatures rebounding back to approximately the same as before the LIA.
This suggests that humans and the biosphere were enhanced by a warming process that has ended. The solar cycles are again going quiet and are forecast to continue that way. Presently, volcanic activity has been routine, showing no increase over the last 100 years. No one knows how long will last the current warm period, a benefit to us from the ocean recovering after the LIA. But future periods are as likely to be cooler than to be warmer compared to the present.
BizNews interviewed veteran climate expert Dr Richard Lindzen, the pioneering atmospheric physicist and former emeritus professor of meteorology at MIT. He recounted events that occurred in the 1980s, which gave birth to the all-consuming climate change narrative that prevails today. Having begun his research on climate change in the mid-70s, motivated by a sincere interest in understanding the Earth’s climate regimes, Lindzen offers a remarkably sensible assessment of the various elements parading as scientific evidence of an impending climate catastrophe. Particularly revealing from his recollection of events is how complicit the media and politicians have been in forcing the disastrous climate change narrative upon an unsuspecting and trusting public from the very beginning.
This recent interview by Richard Lindzen provides a brief and compelling overview sorting out facts and fictions regarding global warming/climate change. For those who prefer reading, below is a lightly edited transcript from the closed captions in italics with my bolds and added images. BN is Biz News and RL is Richard Lindzen.
BN: Joining me is one of the world’s leading voices on climate change, atmospheric physicist Dr Richard Lindzen. Dr lindsden I really appreciate your time; you’ve been an expert on climate change for over four decades now having started your research in the mid 70s. Briefly walk me through your career and what it was about climate change that captured your attention.
RL: It’s a peculiar question. I mean, do you think things only become interesting once they’re political? With the general circulation of the atmosphere, you want to know why you have the current climate. You have dozens of regimes throughout the Earth, so when you speak about the climate of the earth what the hell are you talking about?
South Africa is a very different climate from New England. The Pacific has many climate regimes, and you have the monsoon regimes in India. So there are a lot of things to understand. And it had nothing to do with the environmentalism; it was to understand how nature is on carbon dioxide and the greenhouse effect.
BN: You’ve claimed that believing that increased carbon dioxide is the largest driver of climate change is akin to believing in magic. What evidence supports this argument and what are the actual effects of increased carbon dioxide in the atmosphere?
RL: Well, you’re asking a complex question. Carbon dioxide is a relatively minor greenhouse gas. But the question arises when you speak about what controls climate, and you’re speaking about dozens of different climate regimes.
Saying there is one knob that controls the whole works makes no sense,
and that is belief in magic.
But you know greenhouse effect is useful for one climatic index namely: Why is the Earth different from Venus or Mars or Mercury? Those are huge differences. They depend on basically the mean radiative picture; which includes the greenhouse, the distance from the Sun, the amount of radiation you get and so on. So within a given planet, in particular the Earth our primary concern, we refer to the differences in climate that like the Ice Ages and the very warm period 50 million years ago. These are really pretty tiny compared to the differences between the planets. And those “tiny” differences that we obsess on for good reason are not due to the greenhouse effect.
They’re due to the transport of heat between the tropics and the high latitudes.
And they are part of the Dynamics of the system
which depends on a number of factors
So primarily, what what does carry the heat? Well the ocean carries some heat but in many respects the most important thing is the so-called highs and lows. If you look at a weather map, it’s a little bit different in the southern hemisphere, but here you have the highs and lows going from west to east carrying weather. When you have the wind blowing from the north it’s cold, from South it’s warm. And this oscillates and gives work to your weathermen. In any event those same things carry heat to the pole. And many things determine them, but mainly it’s the differential heating between the tropics and the pole.
ERBE measurements of radiative imbalance.
So you have a system which has these features, and all of a sudden you obsess on the greenhouse effect. You end up having people saying really stupid things. So we’ve increased the temperature one degree or 1.1 in the last 100 years 120 years 150 years. And it’s been accompanied by the greatest improvement in human welfare in the history of the Earth, while some claim one-half degree more will be curtains. Only a politician could come up with something quite that absurd. But on the other hand when you get to the U.N and other things. it’s politicians that run it. And they’ve enabled this hysteria, frightening children their lives are going to be finished in short order. The UN IPCC has a working group that deals with science (Working Group 1). Even there in a thousand pages they don’t speak about an existential threat.
So you have other reports from the U.N that are not scientific that say: Oh yes it’s coming to the end of the world. And politicians say, well this is what we have to go by. I don’t know what you do, but it’s an evil movement, and it’s causing immense damage. It is trying to condemn people in Africa in the developing world to perpetual poverty. And yet I have to ask: Why would this be a goal? I don’t know.
BN: One of the cornerstones of this, let’s call it an agenda, is the constant bombardment to the public of reports on the rise of extreme weather events is this are these reports patently false or are they due to climate change?
RL: Well, you’re pointing to something very important. Even if it were occurring how do you relate it to this one number? But it’s not even true. Again going back to the IPCC, in the UN report they say there is virtually no evidence of a relationship between extreme events and climate change. Now they say that, but that doesn’t fit the politics, so they say something else. If you know of the American comic of years ago, Groucho Marx; he said, “I have my principles. If you don’t like them I have others.”
BN: That’s actually a good description on the politicization of climate change and the significant human progress enabled by the fossil fuel industry. Under this politicization, what do you think the end goal could possibly be for the manipulation of data given by the IPCC and the dismissal of data that contradicts it?
RL: Well, the energy sector is vital, it is the harnessing of fossil fuels that has led to the massive development of the western world. You know the progress since the invention of the steam engine has been the major feature in world history. On the other hand, because it’s such a large sector there are opportunities to make fortunes, even if your only activity is destroying the system. So for example in the U.S our current budget is showing trillions of dollars for climate change. Whether or not you think it makes sense doesn’t matter; somebody’s going to get those trillions of dollars and they have a real interest.
BN: I presume that the predominant funding would go to Renewables; pretty much anything that’s not nuclear or fossil fuel.
RL: What about the tools that extract energy from this, they’re not renewable. |They involve slave labor and that sounds pretty good doesn’t it. Now you have material usage, you have destruction of Landscapes. It’s almost as though the environmental movement has decided to commit suicide and go all in for things that destroy the environment. What you’re doing with the solar pedals and windmills and so on, you’re killing birds you’re destroying the environment. These have lifetimes of 10, 20 years, and you don’t know how to dispose of them. So this has nothing to do with the environment, it’s a power play.
BN: I had an interview with Professor William Harper and he said that the climate change activism movement is a joke and comparable to a coalition or organized crime unit of religious fanatics. And you’ve expressed the same sentiment. To what extent do you think that this is a result of people having pure intentions, but not being properly informed, not just trying to spin the situation far away from what the actual reality is.
RL: It’s hard to assess motivations. You’re certainly taking the public and making them feel that getting rid of carbon dioxide, they’re doing something virtuous. As I’ve occasionally pointed out let’s imagine somebody came up with a good device that could get rid of about 60, 70 percent of the carbon dioxide in the atmosphere. What would be the result? The result would be: we’d all be dead. That’s a very peculiar pollutant. One that we can’t live without.
Though I think it’s based a lot on ignorance. You have economists talking about tipping points, and the geologists know that through most of the Earth’s history we’ve had far greater amounts of CO2. There’s never been any evidence of a Tipping Point. This is a very implausible thing but it sounds scary. It’s pretty clear going back on the history of the issue, when it got started in the early 80s, that it was already a governmental aim. You had these meetings at Villach, Austria and Bellagio, and there would be people interested in climate attending these, usually about a hundred. Those from the government were all in favor of this, while the others were scratching their heads and asking what’s this about. Somewhere along the way, somebody must have decided this is the way to go and they started pushing for it. Global cooling wasn’t panning out.
I think from the beginning of Earth Day, it was obvious you wanted to control the energy sector. At first it was sort of amateurish, you know acid rain, global cooling. Then someone realized, no matter how clean you made energy it would still produce CO2. So let’s go after that–you’ll never get rid of CO2 without getting rid of fossil fuels. There’s no evidence whatever that this is well-intentioned.
BN: But we still have a measured consensus of between 90 and 100 per cent of climate scientists that agree that it’s anthropogenic climate change. How is this the standing reality?
RL: Look, in 1988 when Jim Hansen first testified before the U.S Senate, Newsweek ran a cover issue showing the Earth on fire with the claim underneath, all scientists agree. No scientists were asked. This is the way you convince the public, which is pretty illiterate when it comes to science. I don’t think the public feels comfortable about that, which is often ignored. So you immediately assure them: the scientists all agree, you don’t have to worry about it. And they knew that whether the scientists agree or not.
BN: Dr John Christie said that it’s actually a completely falsified number.
RL: Oh yeah as the record shows, there was a reduction from 1988 saying all scientists Agree. Now it was only 97%. It’s a fake number, it’s just designed to tell people they don’t have to understand the science, just go along
BN: But then my question is if it is in fact such a small percentage of scientists that don’t agree . . .
RL: But we have to ask what they agreed to. You can frame the issue so that it was a hundred percent, for instance if you asked whether increasing CO2 increases or decreases temperature. Well I should say it probably increases it slightly. And then that’s listed as agreeing that the end of the world is coming if we increase CO2. They’re two different questions.
BN: So why do you think more climate scientists haven’t actually been vocal about the complete inaccuracy of these consensus figures?
RL: it’s a good question. One of the things that has changed is perfectly obvious. This was a small area in the 1980s. When you had a meeting, if you got a hundred people that was pretty substantial. And very few of them thought there was anything significant going on that would be called existential. So what happened? If you look at funding in the U.S for climate science between 1989 and 1996 when Clinton/Gore Administration came in, funding increased by about a factor of 15. You literally created a whole new field, and you knew that the people who were brought in, knew that the reason for the funding was this issue. Indeed if you didn’t go along with it you lost your funding, So you know my funding ended as soon as I went public with my position.
BN: One of the common criticisms against you, your credibility and your views on climate science, is that you have ties to the fossil fuel industry. Is this true?
RL: No. Remember that everyone in this following that 15-fold increase came in it for the money.They assume anyone opposed must have gotten money from someone else. At MIT ExxonMobil does support some work, only on the part of people who support the alarm. The funniest was when they attacked me for writing an article in 1991 for Cato’s regulation magazine. And their argument was 10 years prior to that, Cato had received 10% of its funding from ExxonMobil. Now for this article I was paid 200 dollars, so presumably two dollars of that was from ExxonMobil 10 years prior to convince me to change my view.
BN: I just try to balance the scales, to get two sides of the story. I had an interview with Professor Guy McPherson, and he says with a very deep conviction that we are in the midst of abrupt climate change and that the methane released predominantly by the Arctic ocean will be the end of humanity by 2026. What’s your take on this?
RL: Well, he’s entitled to any science fiction he wishes to produce, but there’s no scientific evidence of that.
I think once people realize that the public is amenable
to scare stories, they get carried away
BN: What in your view is the political, economic and environmental implications of this move towards net zero and an abandonment of the fossil fuel industry?
RL: Pure malice. . . Plus profits for a few. Quite obviously you have people like Gore and Kerry and so on making hundreds of millions of dollars flying around the world ignoring all the things that they would prohibit Ordinary People. I suppose for these people it’s a return to feudalism where where us peasants should know our place and they should have their privilege.
BN: In 2001 you proposed the iris hypothesis on climate change. What was the premise of this?
RL: Well that was a question in some respects I think less important now. But since they were making a big fuss over changes of one degree, two degrees, so the question is why CO2 doesn’t do much. And it turns out that they had assumed assumed feedbacks that instead of trying to preserve a situation would act to make whatever we do worse. And there were plenty of problems with these feedbacks they they were improperly implemented.
So with the cooperation of NASA at the time, we looked if there were any obvious things occurring that were negative feedbacks. And it did look as though essentially upper level clouds in the tropics were acting in such a manner as to oppose the greenhouse effect. That seemed like an important feedback and it’s one which I think still likely plays a very important role in an important phenomenon that was called the early faint Sun paradox.
I don’t know if you’ve ever heard about this, but the sun’s output is increasing with time. If you go back two and a half billion years, the solar output was appreciably less than it is today.Yet the evidence is the earth did not freeze over; the Earth maintained a temperature that was very similar to today. The question is: How could it do that with a 20, 30 percent reduction in radiation. And it turns out that this Iris feedback is entirely capable of balancing that change. And so I think that remains a fairly substantial argument for the system being stable.
BN: What are the epistemological issues around climate change research
RL: OK. You have to remember a couple of things: One this was a small field. Two it was concerned with the problem: Why do you have different climate regimes; things that dealt with the Here and Now. So when you increase the funding by a factor of 15 the talent wasn’t available. So new topics were introduced, and one of them was climate impacts. Now this had nothing to do with understanding the physics of climate. If you were working on cockroaches, and you said my grant is to study the role of climate on cockroaches you got funded.
So you have all these impacts: climate and obesity, climate and diabetes, and so on. They wanted a piece of the action and they all became “climate scientists.” It’s worth remembering for instance, in 1990 my department at MIT no one called themselves a climate scientist. There were good reasons for that: climate was a very comprehensive thing. I was working on Dynamic meteorology, colleagues were working on oceanography, there were Marine geochemists. None of us pretended to comprehensive knowledge of everything about climate.
But all of a sudden you have people who know nothing about the physics
who are climate scientists because they got a grant
to find out whether diabetes was related to climate.
BN: You say that climate variability is actually the thing that we should be looking at to understand what is changing our climate and not human activity. Can you summarize the difference between anthropogenic climate change and climate variability, and why it is that you believe it’s climate variability that we should be looking at and not human activity
RL: Oh I’m not saying you shouldn’t look at things. People should be free to look at what they want. But we do know that long before there were even people, climate was changing markedly. Even before the Industrial Revolution there was alittle ice age. It had all sorts of documents, for instance villages in the Alps saying the ice is overtaking our village. You had the ice ages every hundred thousand years in which you had massive glaciation.
And you know this had nothing to do with people,
so you would need to understand those differences.
There was progress with the ice ages. A man called Milankovitch noticed that ice ages bore a relationship to orbital variations. It took a while but there were there was a climate program trying to find out how this worked. And we have a pretty good idea at this point of why that worked and Milankovitch was pretty much right. He said it would depend very much on the solar radiation in summer at high latitudes. And that was a well-known feature of glaciology: whether a glacier grows or not doesn’t depend so much on winter which are always cold in the northern hemisphere. But in summer if the snow that accumulated in Winter melts, you don’t build a glacier.
If the summer is cool and the glacier snow doesn’t fully melt,
then you build up each year.
You have thousands of years to build up your glacier.
Well you know it turns out for instance that CO2 follows temperature in the ice ages and it changes enough to change the flux about a watt per square meter. On the other hand when you look at the Milankovitch parameter, the incoming solar radiation over the course of this Ice Age cycle varies on the order of a hundred watts per square meter. That’s much more significant.
But then you have people say: “Well yeah I know that since CO2 is following that you can’t say CO2 caused it. But it must be CO2 amplification that was important.” But I mean it makes no sense: one watt versus a hundred.
BN: When I spoke to Dr Judith Curry, her story was just a very unfortunate reflection of what happened to dissenting voices. And she said that she’s essentially unhirable and so she had to leave for the private sector. What have you had to face as a result of going against the grain and the consensus for so many decades?
RL: Well you know Judith at first was a strong supporter of global warming and attacking anyone who questioned it. It’s interesting that she changed. I don’t know what to say. There are a couple of things that happened. First of all I’m older, so I had a senior position. I was doing research in a lot of areas and the National Science Foundation was funding my research in fluid mechanics. That continued a while so I sort of did climb on the side. The department of energy at first tried to fund people on all sides subjectively, but by the 90s they were told to quit that. And so the research manager there did me a favor. I had not fully expended my funding and she let me keep it past the due date without adding anything to it so that allowed things to continue a bit longer.
With publication again I was well known in the field and so I published some papers in the American Meteorological society’s monthly Bulletin and they got through. They were reviewed but the editors were all fired immediately after publication. And the paper was never rejected but I immediately invited people to criticize it. When the criticisms were published, we were not permitted to answer for six months, which was very unusual.
BN: That’s the manipulation of the justice system. How the situation is rigged to support the narrative and the complicity of politicians and scientists.
RL: Yes the situation was rigged, it was very much a March through the institutions. And that’s a problem for professional societies. Whether you are a member of the American physical Society or American Meteorological Society, or for that matter the American musicological society, you’re a member of a group of people who have a professional interest. And they elect a president and an executive manager to take care of the public relations so on
I think the people pushing this issue realized all you had to do is turn an official, the executive manager or something, and he ends up speaking for the whole group, never having actually sampled the people. And so you take over the American Meteorological Society, the National Academy, the American Academy, all of them are top-down organizations with managers. And they’ve done a terrific job of that
So you have some naive hypothesis that something as complex as climate is controlled by a single control knob of a minor gas that controls a couple of watts per meter squared out of hundreds. You can only promote this if you have a public, including political officials, who are totally illiterate or enumerate versus science.
You mentioned to all these people who are getting support. You find that scientists only have to say something like they think CO2 increasing will give some warming and they leave it to the politicians to say this means the end of the world is coming. And their backup position is: I never said that.
BN: Are there any anthropogenic elements that humans could increase or continue with, like fossil fuel consumption, that will possibly have catastrophic consequences?
RL: You know a nuclear war could do that but driving your SUV? I guess it appeals to certain people’s vanity that we are all powerful.
BN: Just to close off: What would you recommend as a way out of this situation that feels a little bit like a trap?
RL: It’s a very serious question. When you co-opt the institutional structure, then you have people like the world economic Forum, the EU full of bureaucrats who are just infatuated with the power they might have. It’s got to be very difficult to break out, either there are political parties that are opposed to this. One hopes maybe they’ll gain power and just trash this. Time will of course play a role but I hope we don’t have to wait to see the destruction of modern society and realize it had nothing to do with climate. I’d like to think we can get out of this before then.
BN: As it stands are we at risk or in any way getting close to a climate catastrophe?
RL: I suppose it depends on how you define it. If you define a catastrophe as having three inches of extra rain one year, then we’re all in their catastrophe. If you really mean an existential threat, the answer is: No, we’re nowhere near that. It just makes no sense. These are scare stories you especially want to give to kindergarten kids because they have no defense mechanism.
You know there may be some hope that the developing world, I mean clearly China, India, Russia are ignoring this. They know it’s nonsense so they’re sitting by and watching the West self-destruct while wondering about what divine good luck they have. You know they’re not going to do anything about it. If you’re really worried about CO2 you know we’ve spent trillions of dollars trying to reduce it and get to Net Zero. And you look at CO2 versus time and it continues to increase.without any change So we’ve had no impact upon that. So you’d ask yourself:
If we have no impact, and we’re worried about it,
why aren’t we building resilience?
Do we want to make ourselves more vulnerable
so we’ll be properly punished? That’s nuts.
BN: It does sound like you’re reading the message between the lines of the environmentalists.
RL: Yeah, it seems as though they hate Humanity, they want Power and they don’t give a damn about the environment. And they certainly give no attention to feeding starving people, when that is in fact a real problem.
Addendum:
In a previous publication Lindzen sets the record straight about the “March through Institutions” with names and maneuvers which have crippled efforts to answer questions about the functioning of earth’s climate system.
When an issue becomes a vital part of a political agenda, as is the case with climate, then the politically desired position becomes a goal rather than a consequence of scientific research. This paper deals with the origin of the cultural changes and with specific examples of the operation and interaction of these factors. In particular, we will show how political bodies act to control scientific institutions, how scientists adjust both data and even theory to accommodate politically correct positions, and how opposition to these positions is disposed of.
By taking a few minutes to read his text (link in red above), you can learn from Lindzen some important truths:
♦ How science was perverted from a successful mode of enquiry into a source of authority;
♦ What are the consequences when fear is perceived to be the basis for scientific support rather than from gratitude and the trust associated with it;
♦ How incentives are skewed in favor of perpetuating problems rather than solving them;
♦ Why simulation and large programs replaced theory and observation as the basis of scientific investigation;
♦ How specific institutions and scientific societies were infiltrated and overtaken by political activists;
♦ Specific examples where data and analyses have been manipulated to achieve desired conclusions;
♦ Specific cases of concealing such truths as may call into question global warming alarmism;
♦ Examples of the remarkable process of “discreditation” by which attack papers are quickly solicited and published against an undesirable finding;
♦ Cases of Global Warming Revisionism, by which skeptical positions of prominent people are altered after they are dead;
♦ Dangers to societies and populations from governments, NGOs and corporations exploiting climate change.
Summary: Thanks to Richard Lindzen and others for putting on the record how broken is the field of climate science. It is dangerous in itself, and it also extends into other domains, threatening the scientific basis of modern civilization. Fixing such scientific perversions will be difficult and lengthy, but it can only start with acknowledging how bad it is. It truly is worse than we thought.
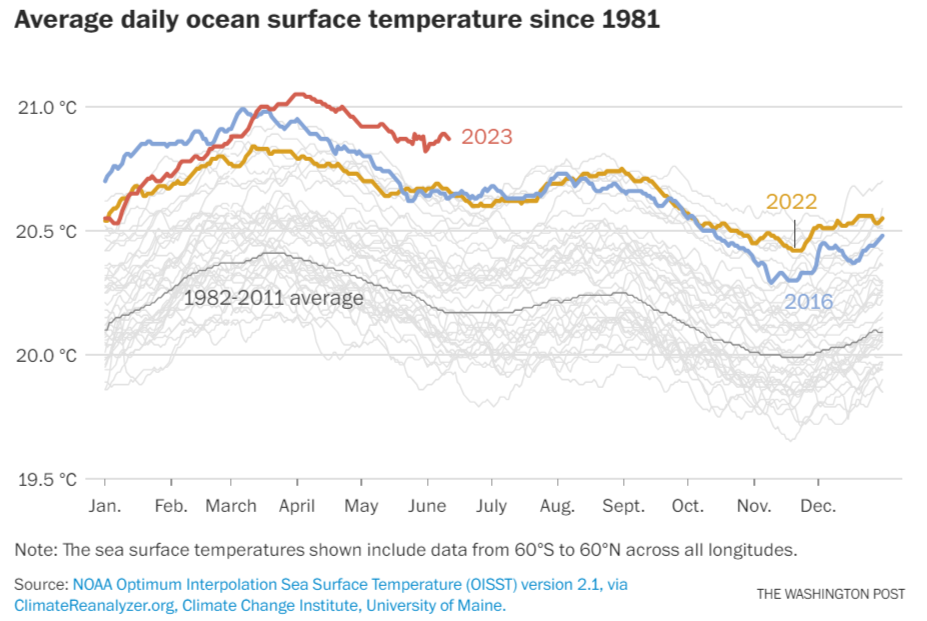
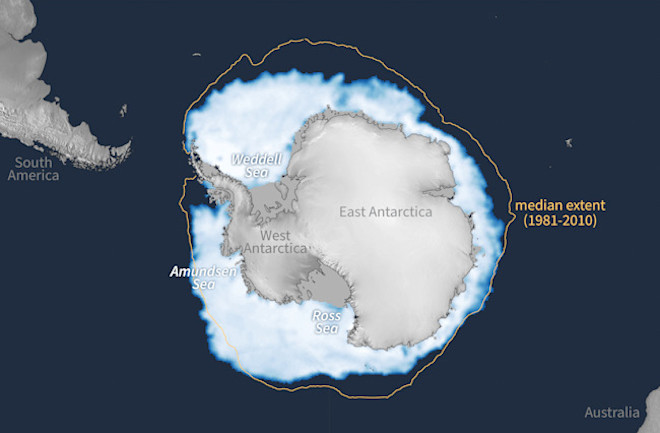
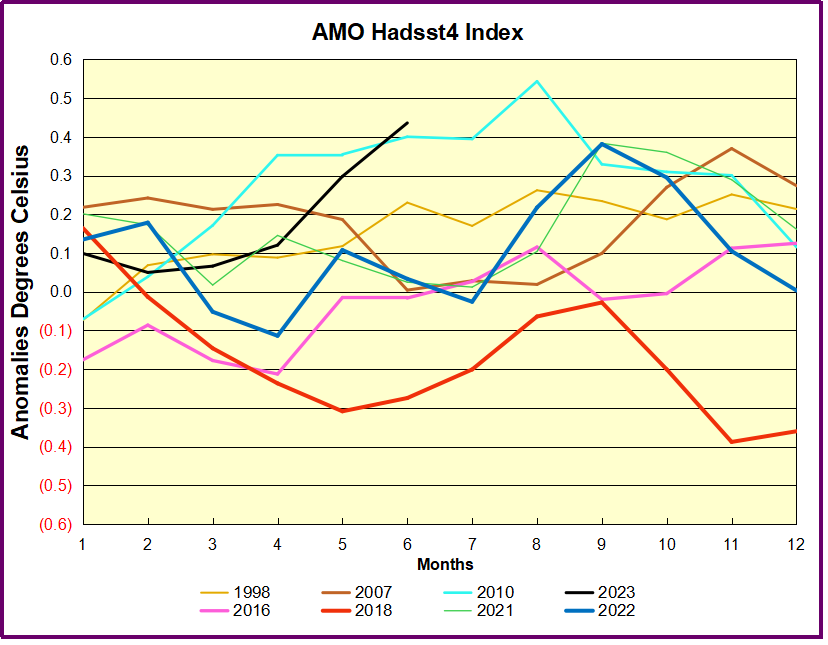


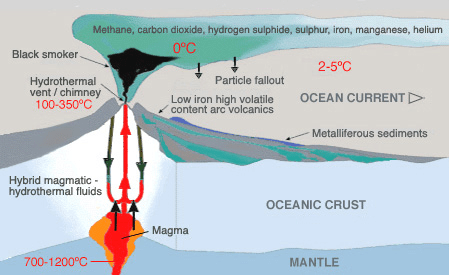
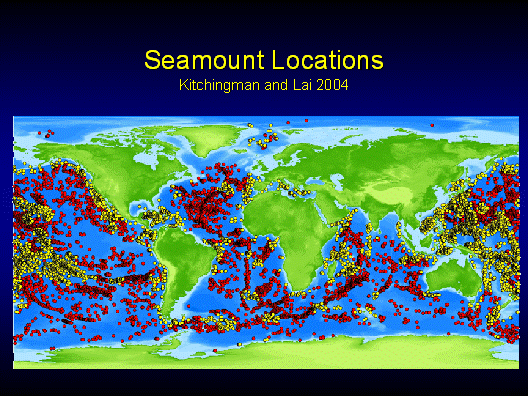


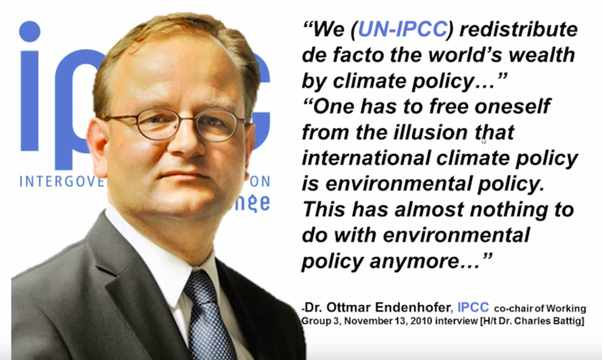
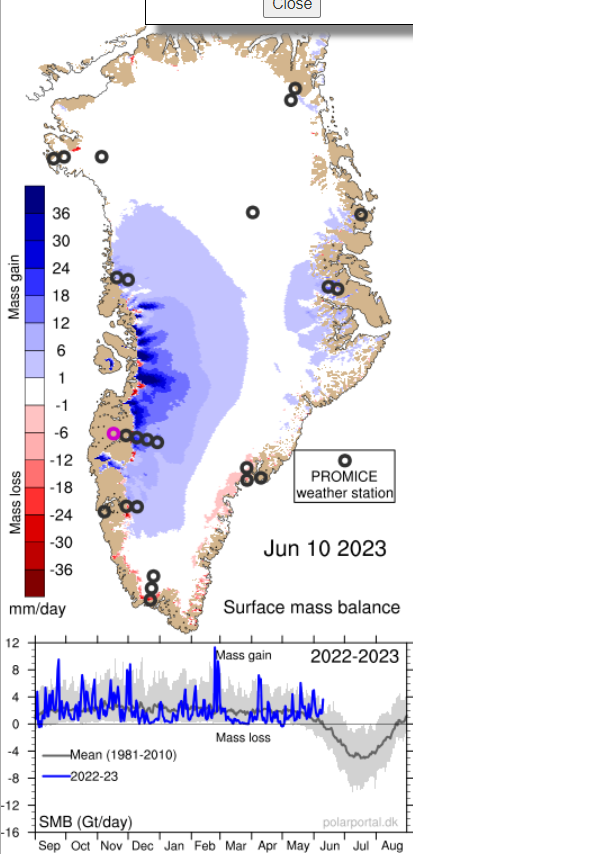
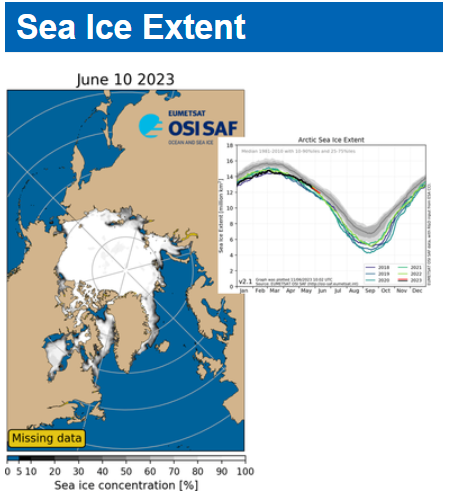
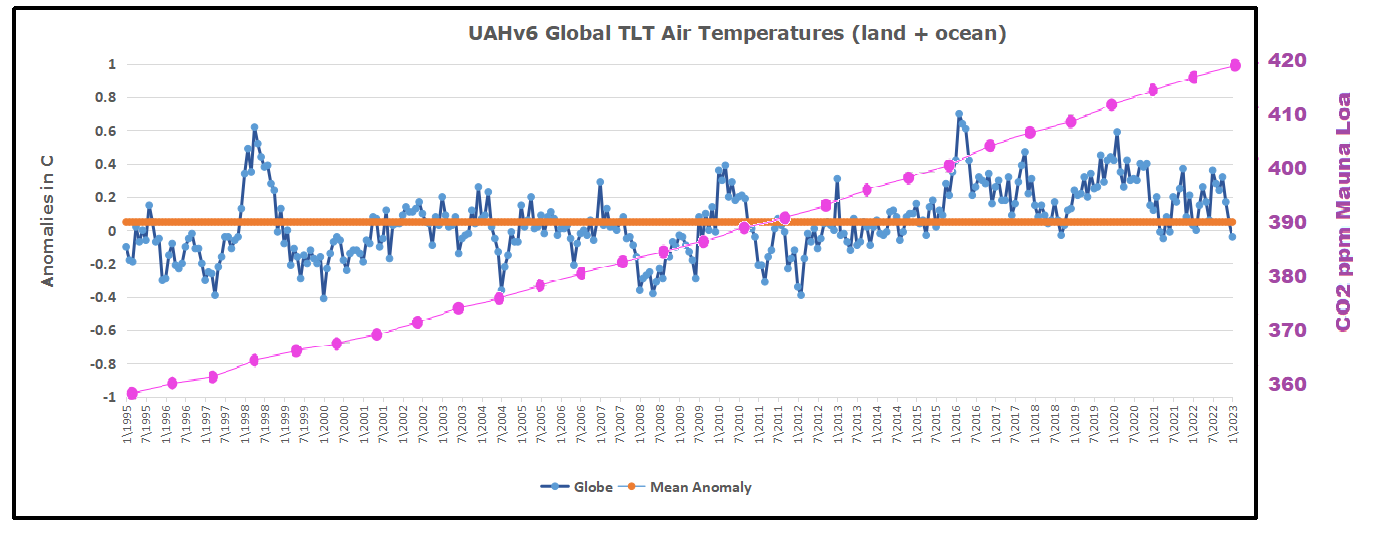
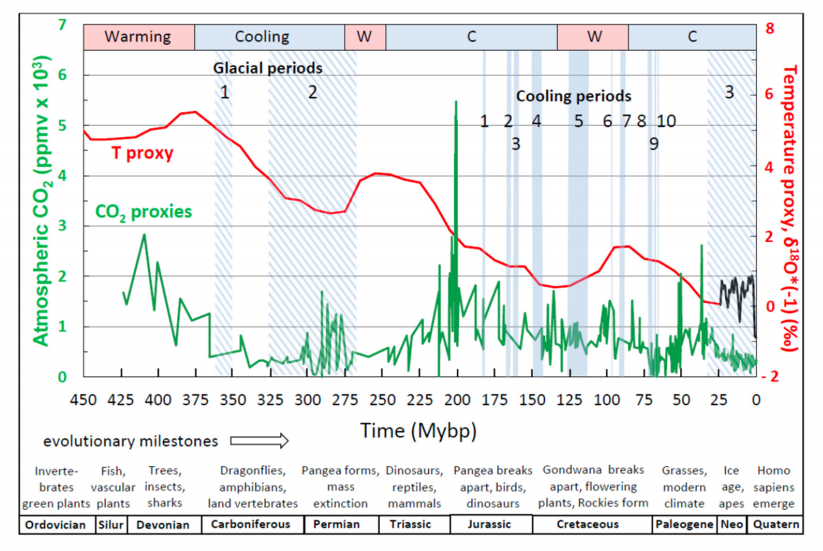


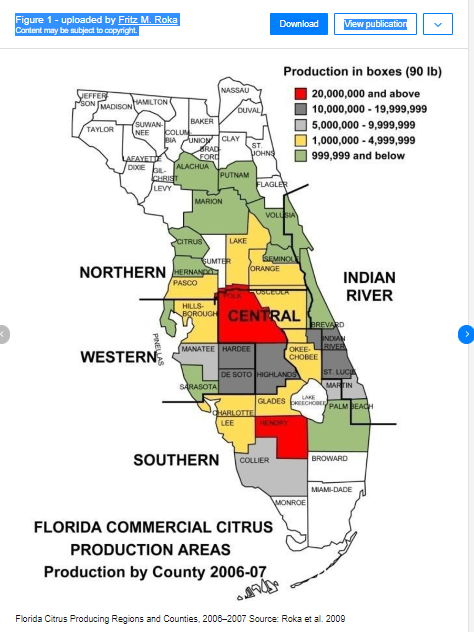
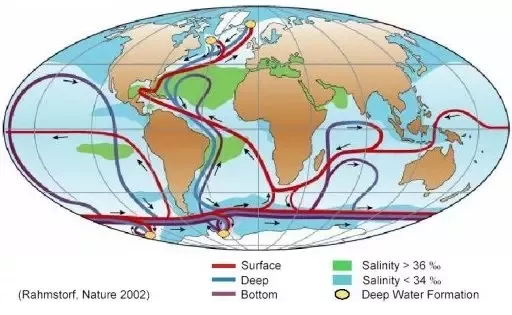
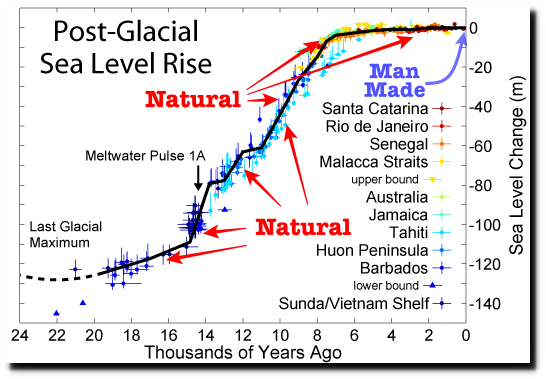
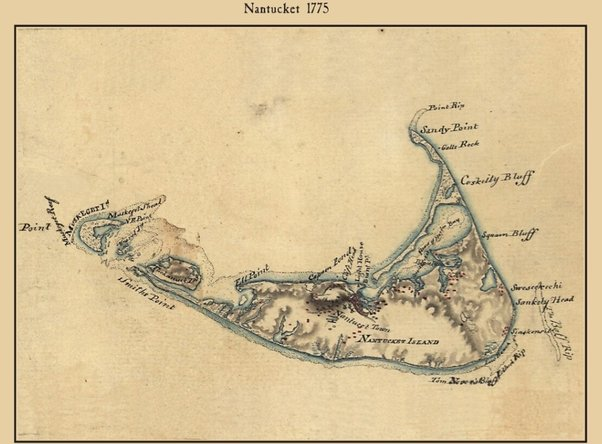
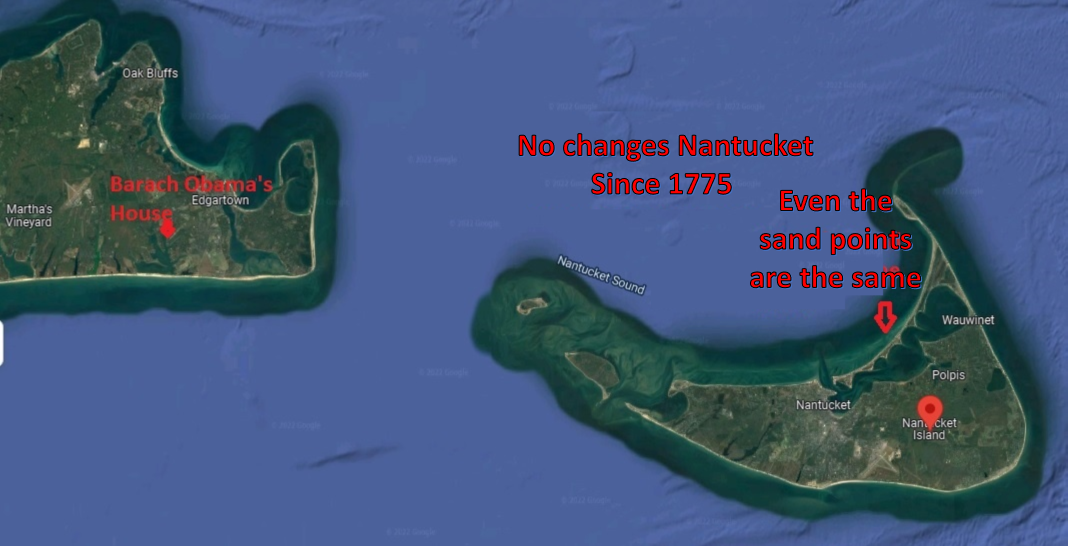
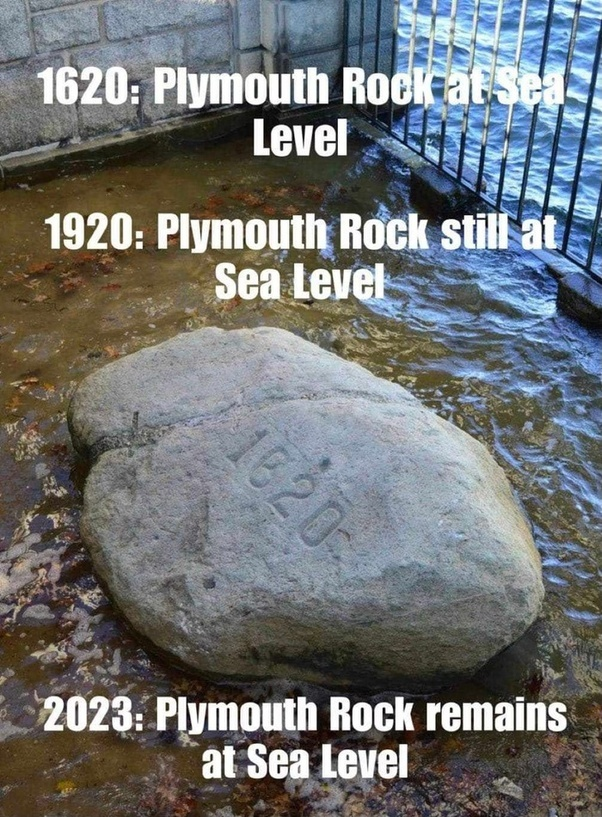

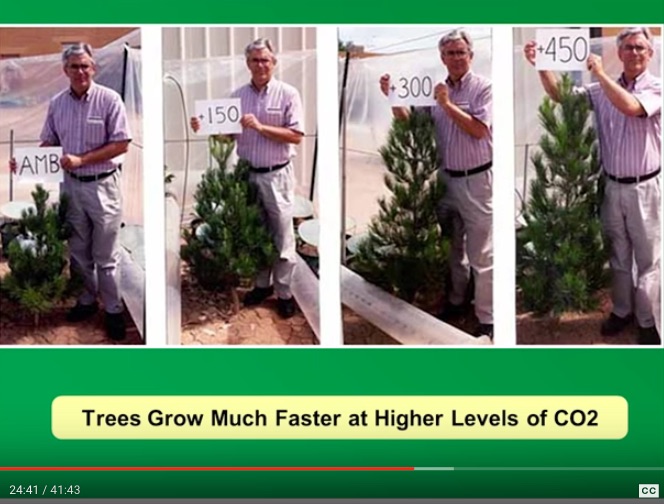
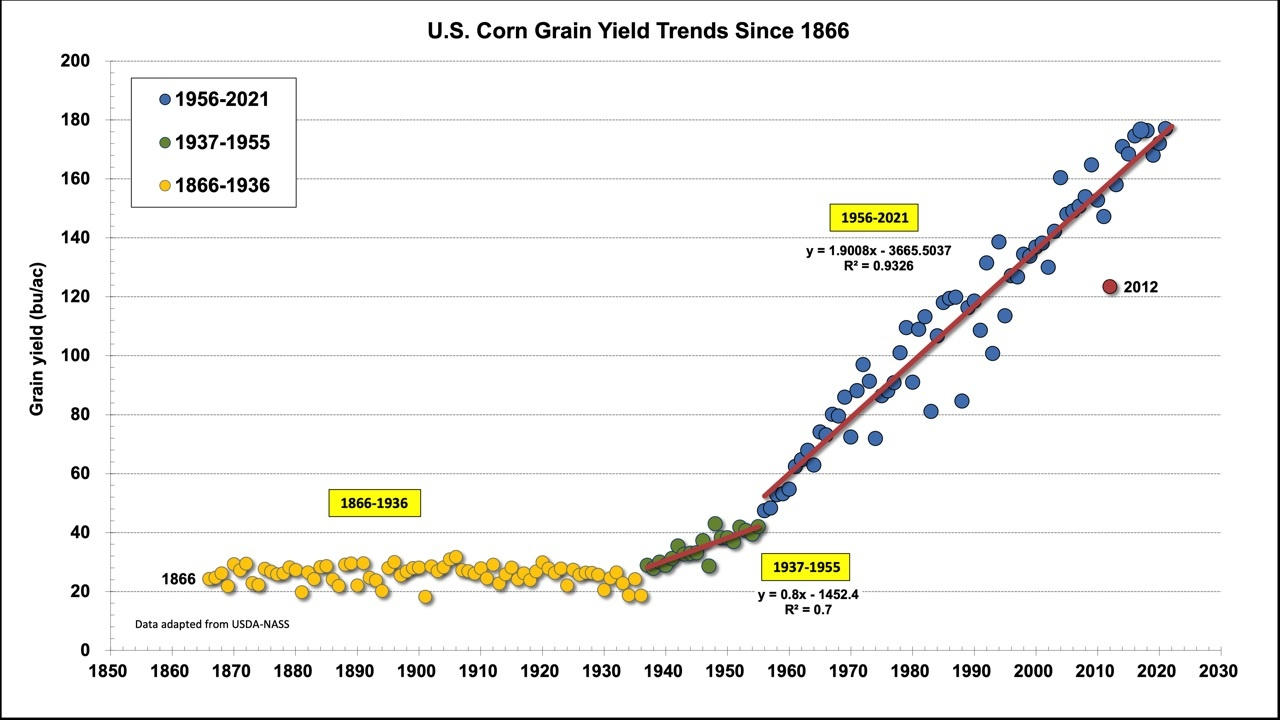
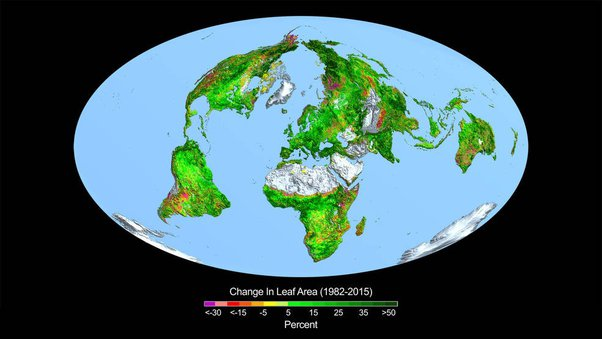
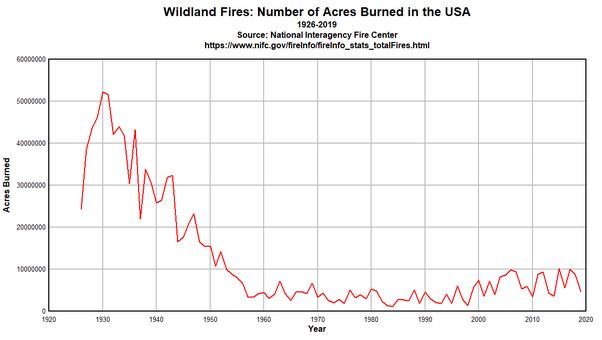
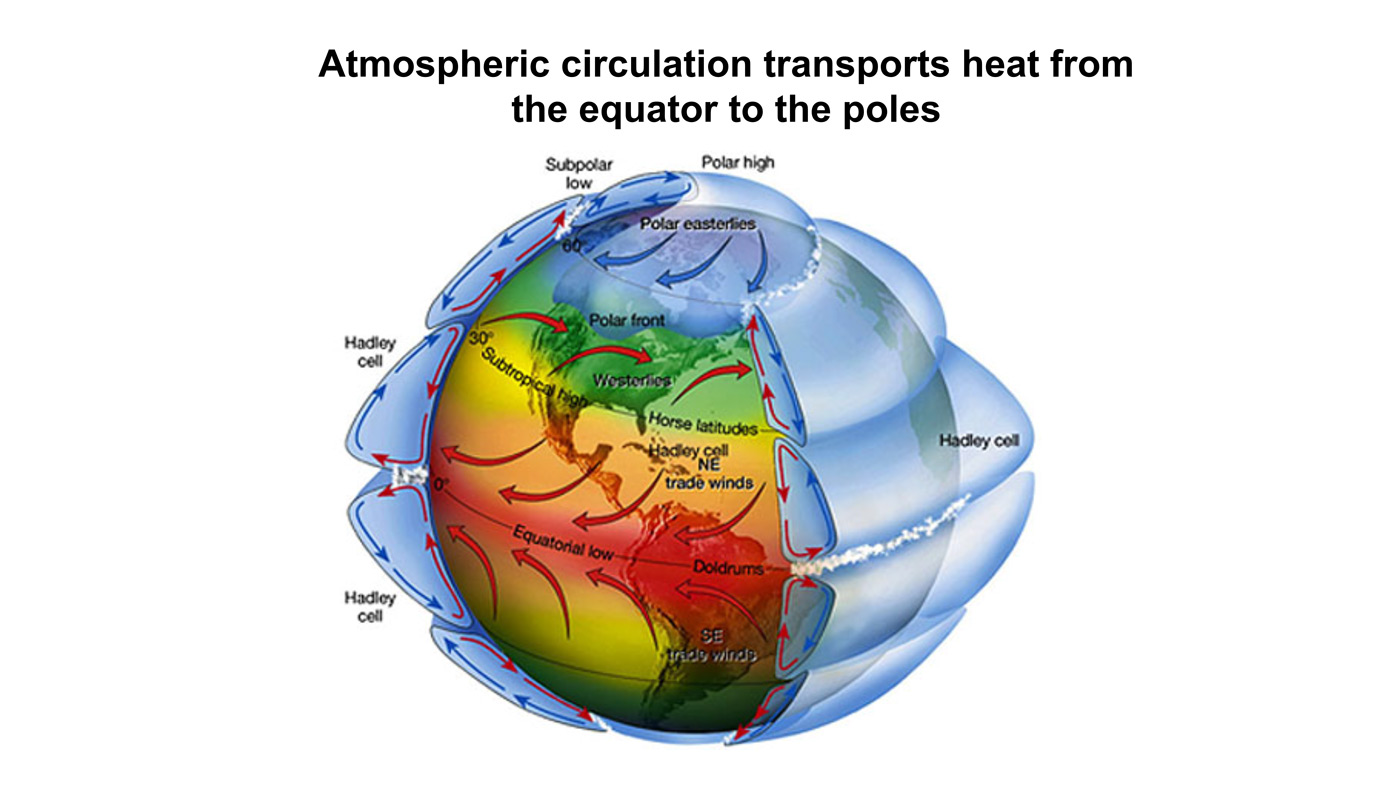

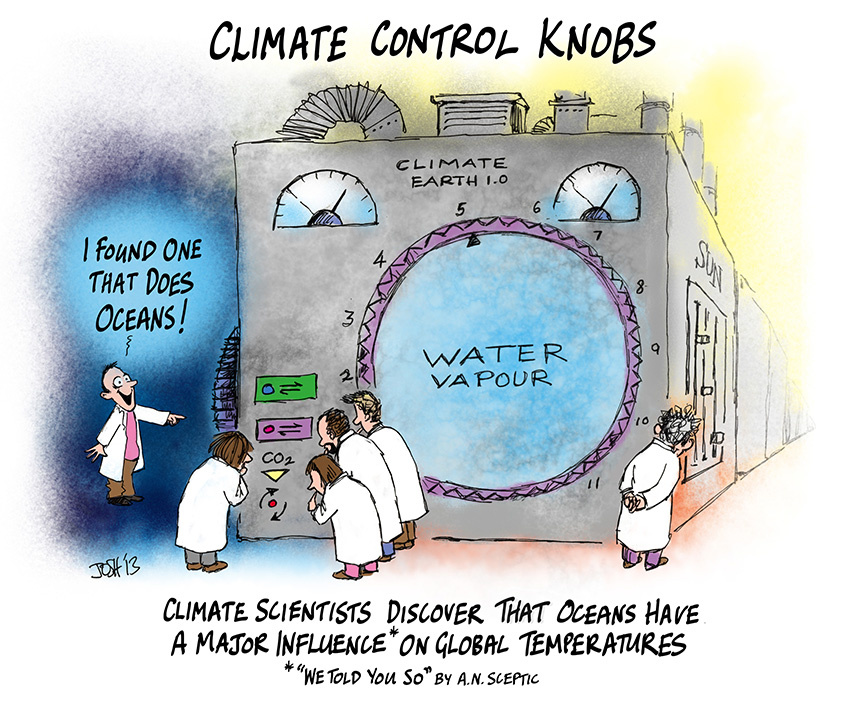
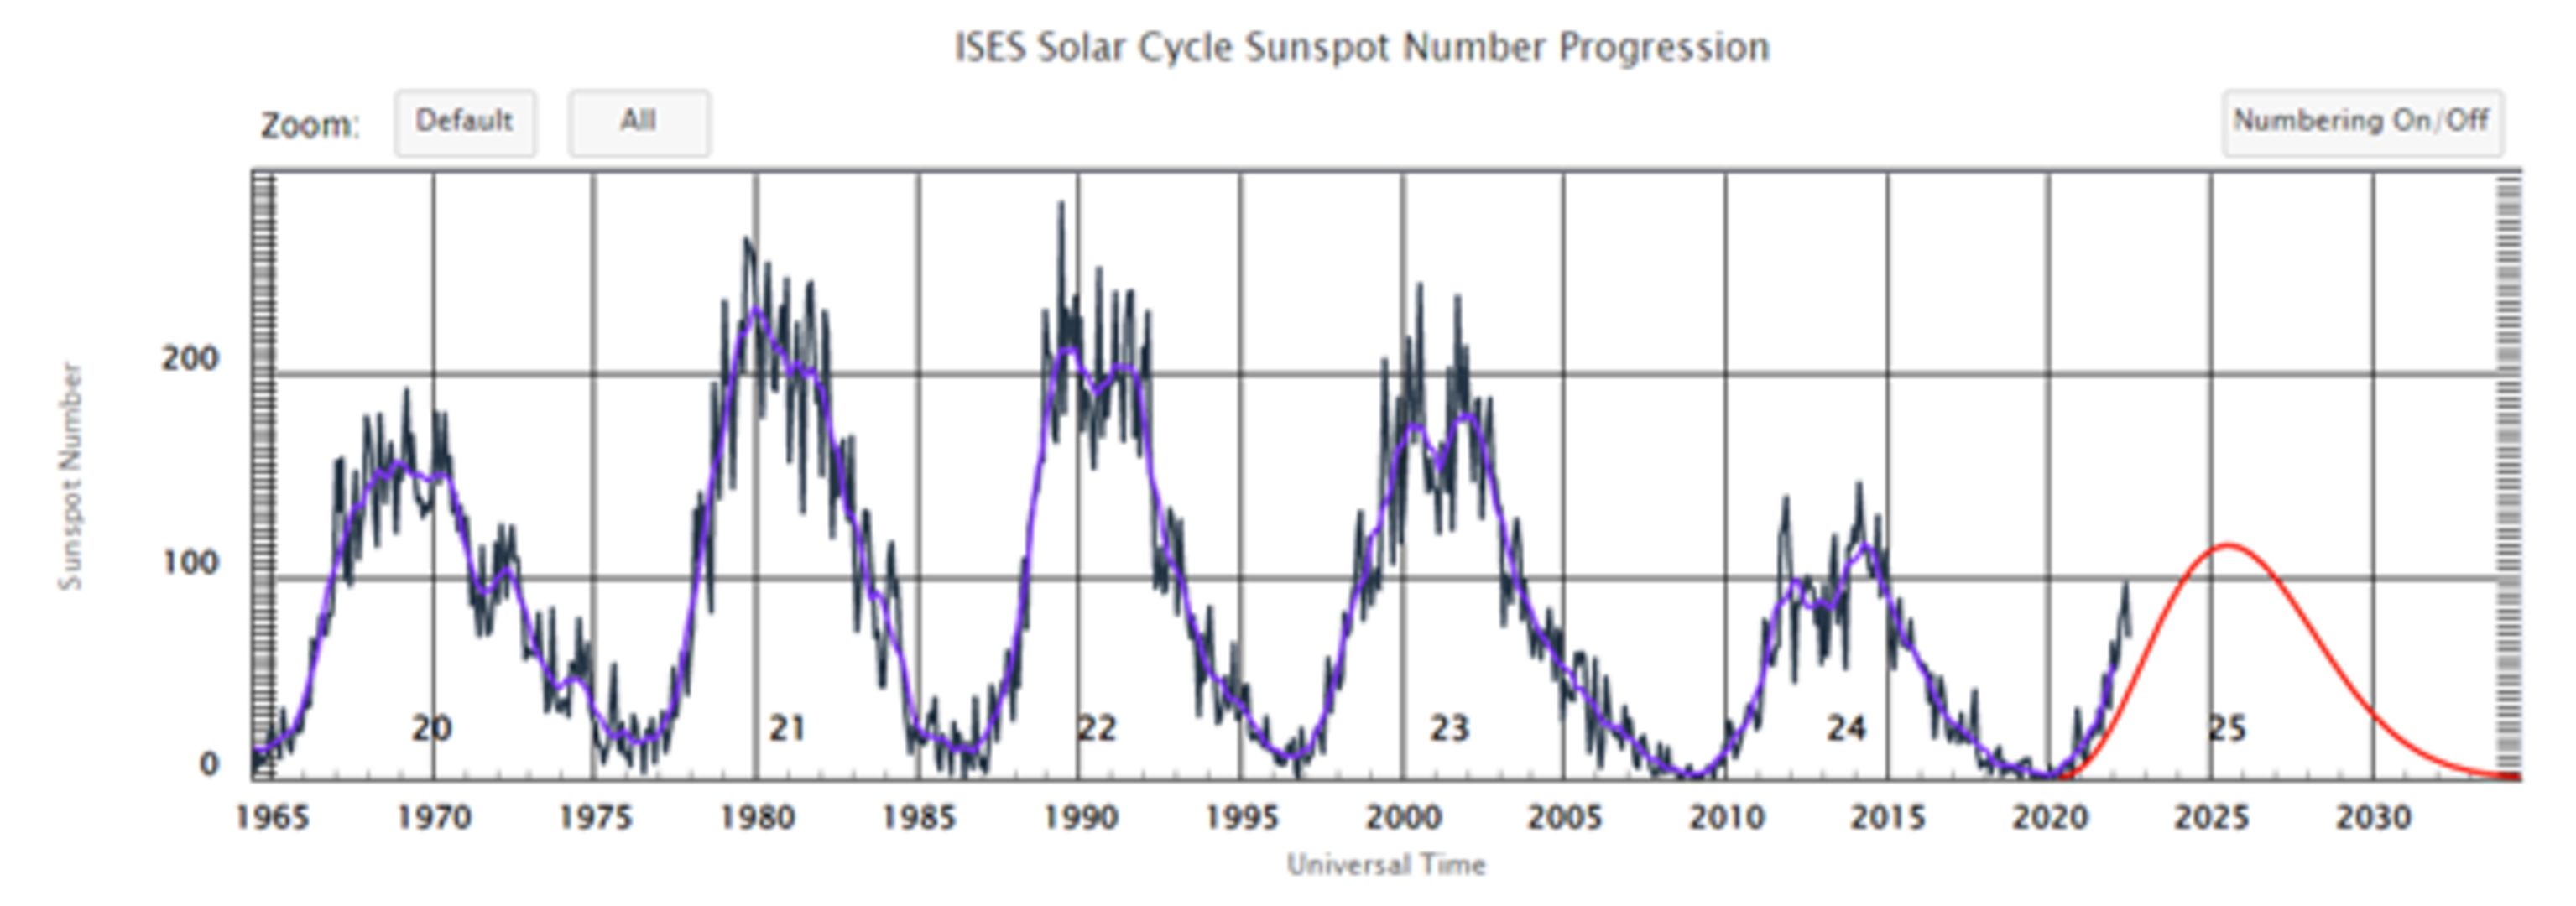
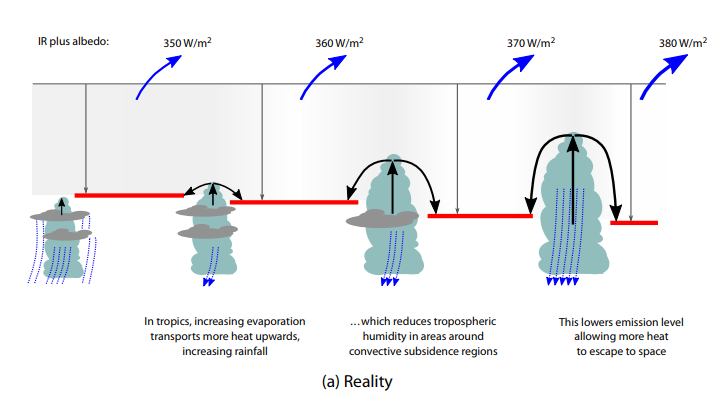
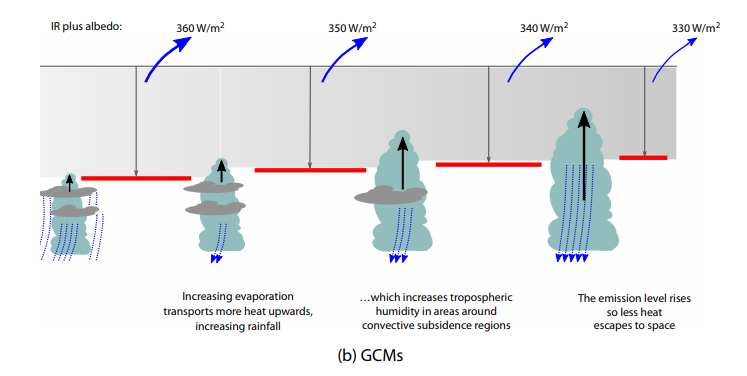


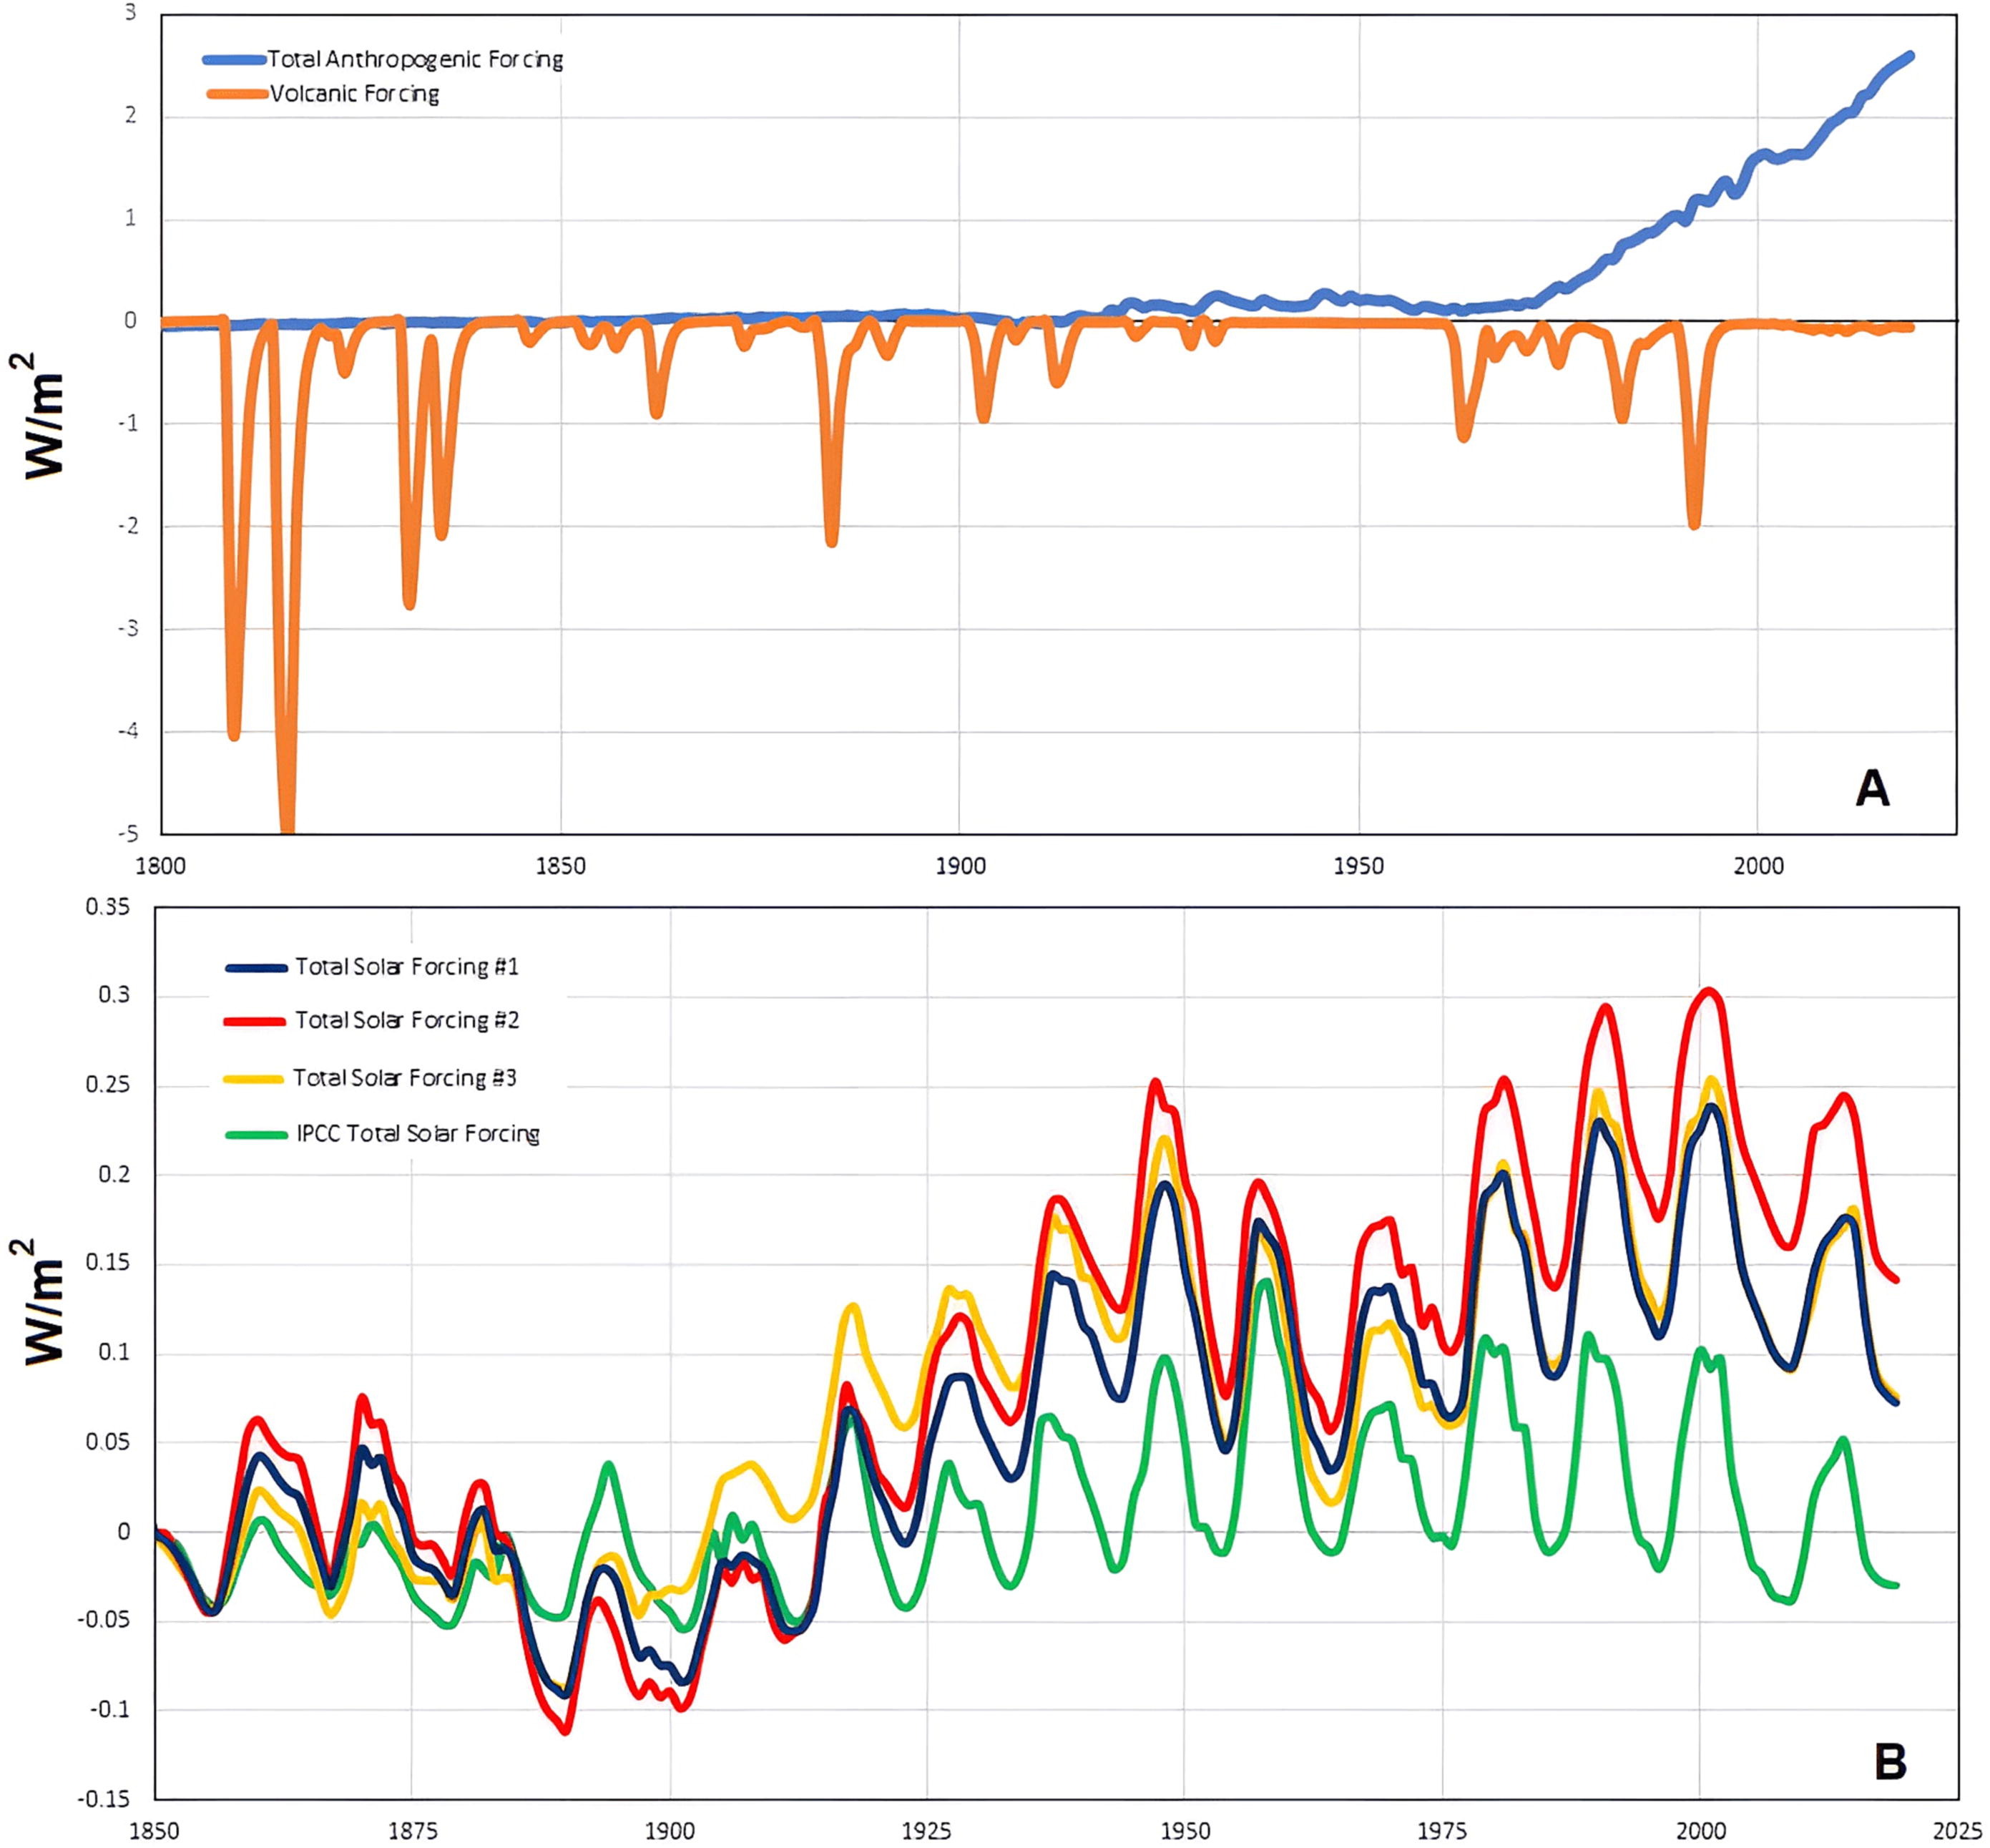
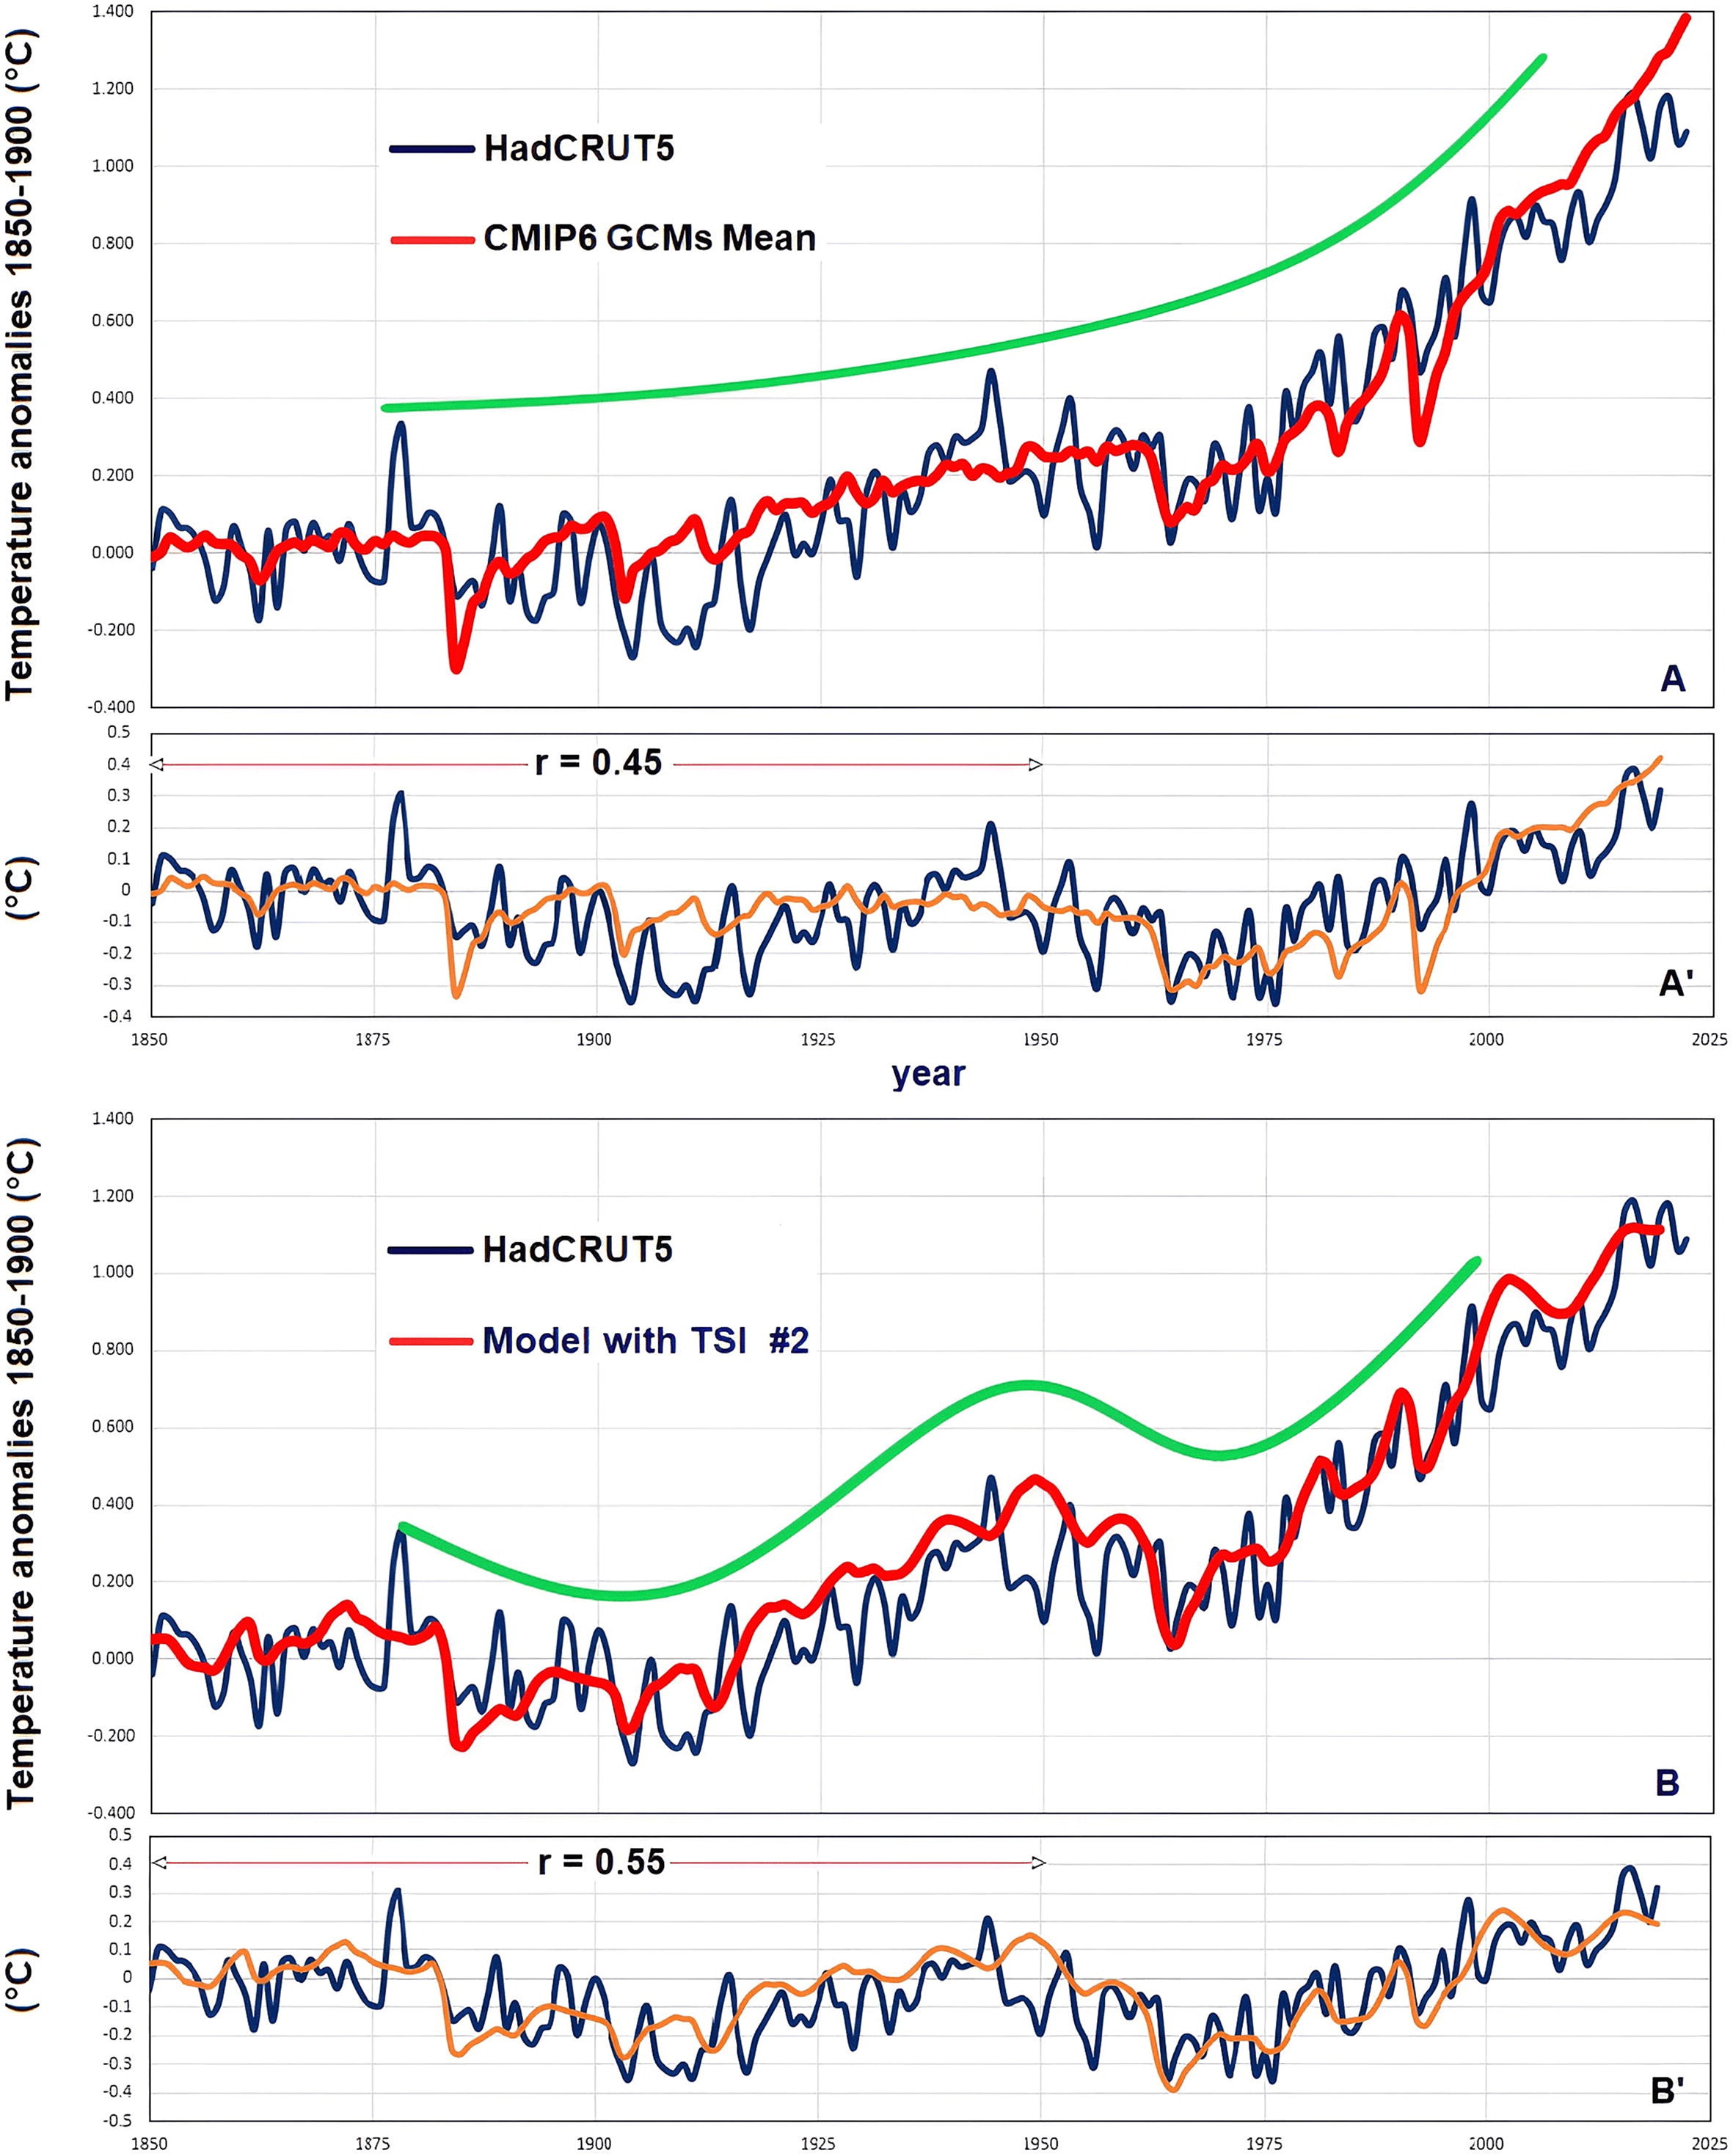
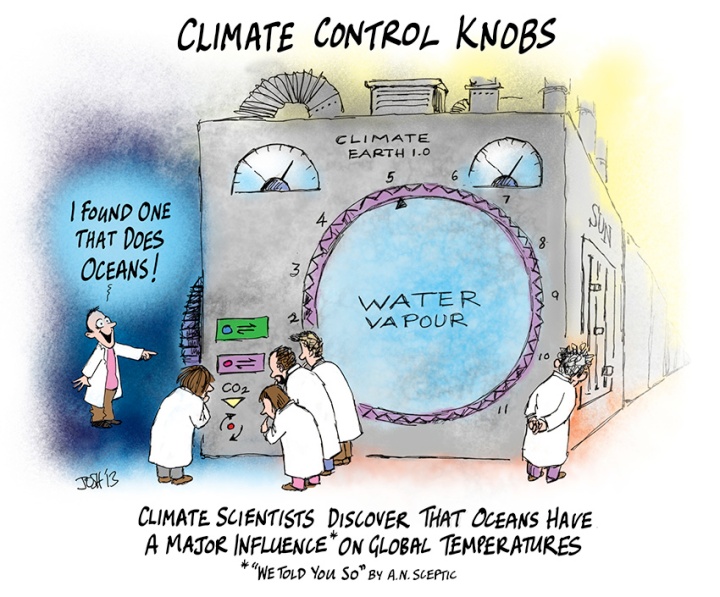
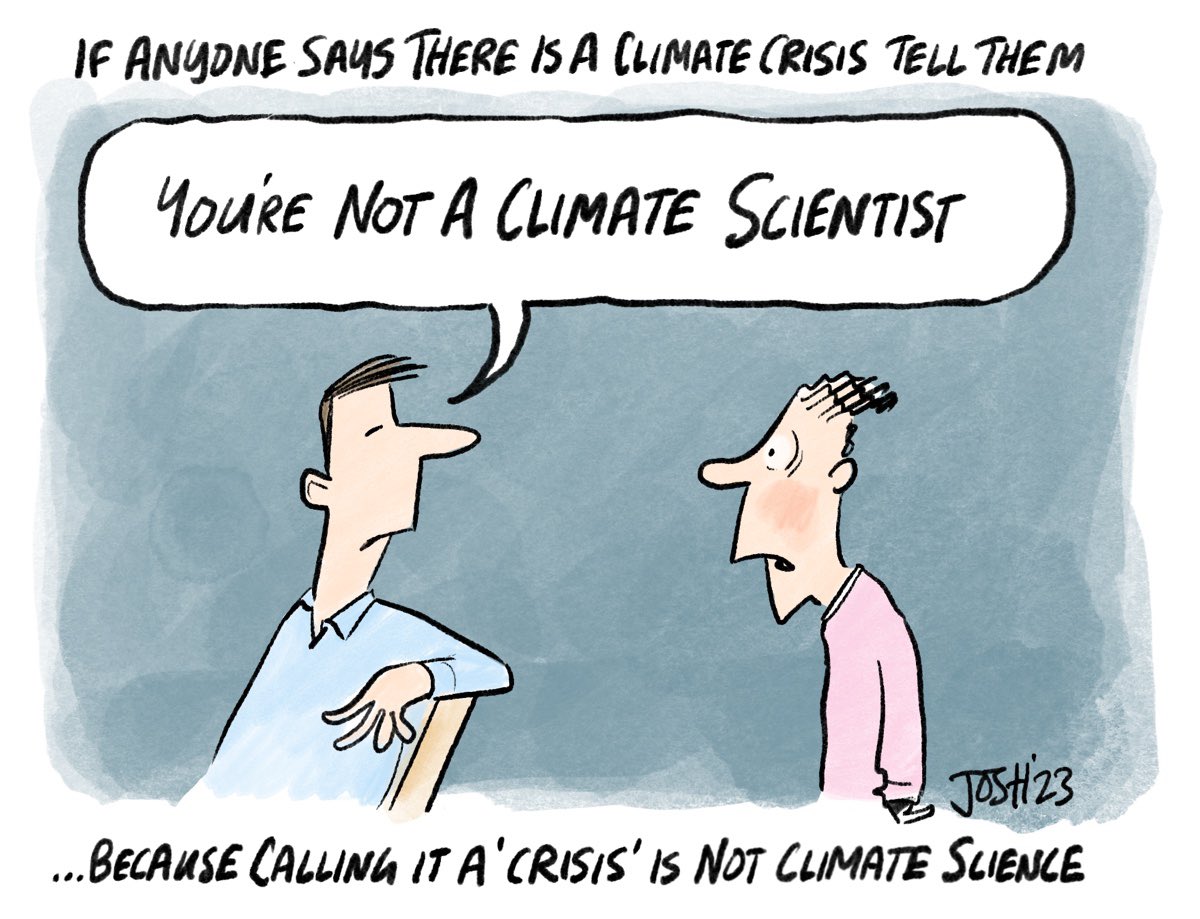


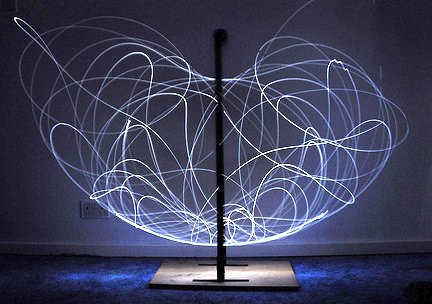
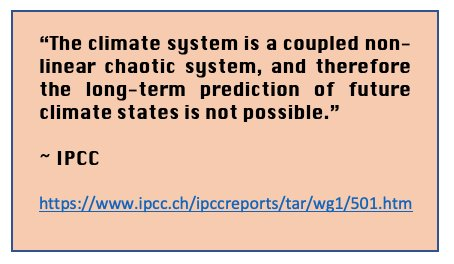
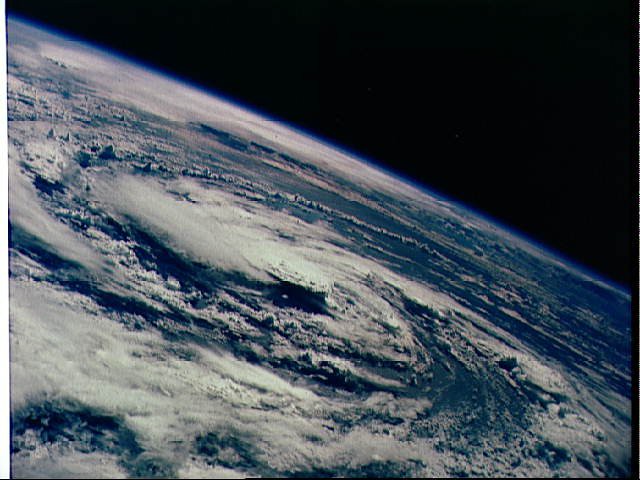


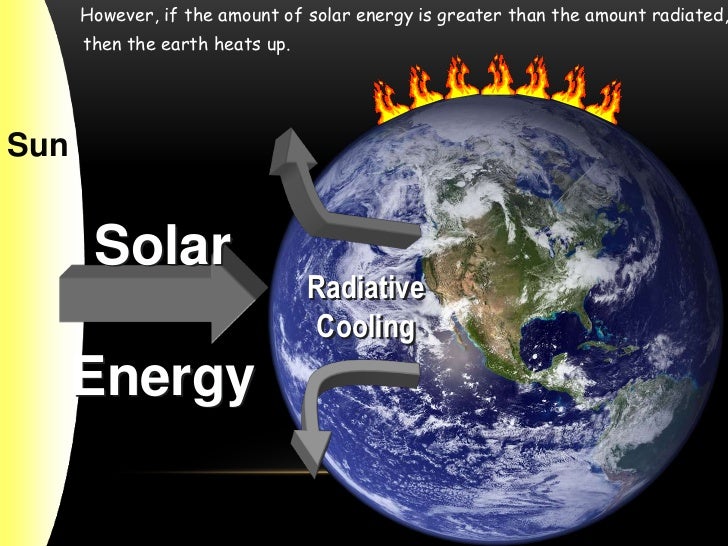
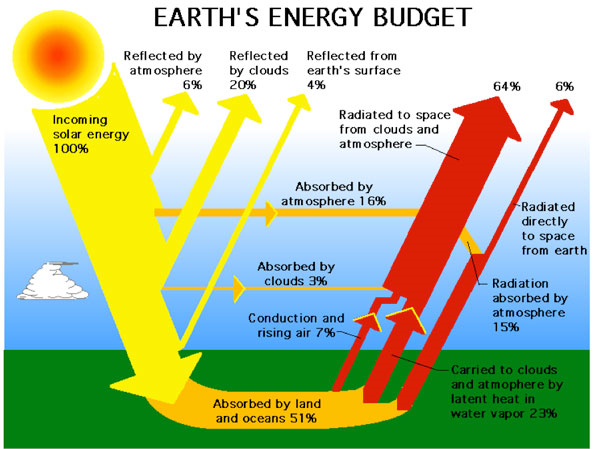

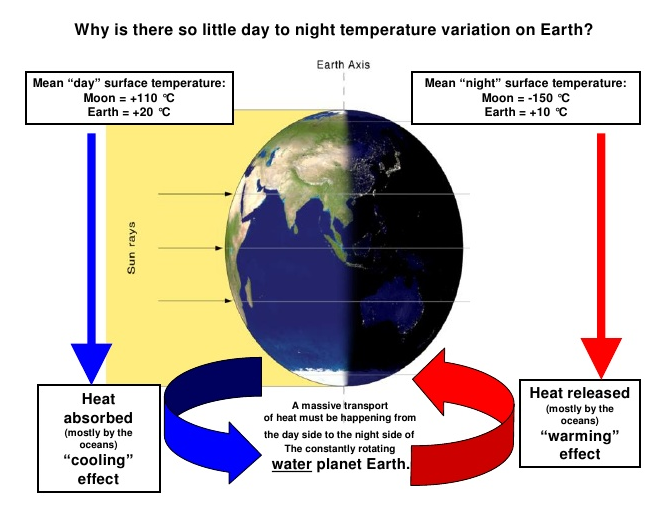


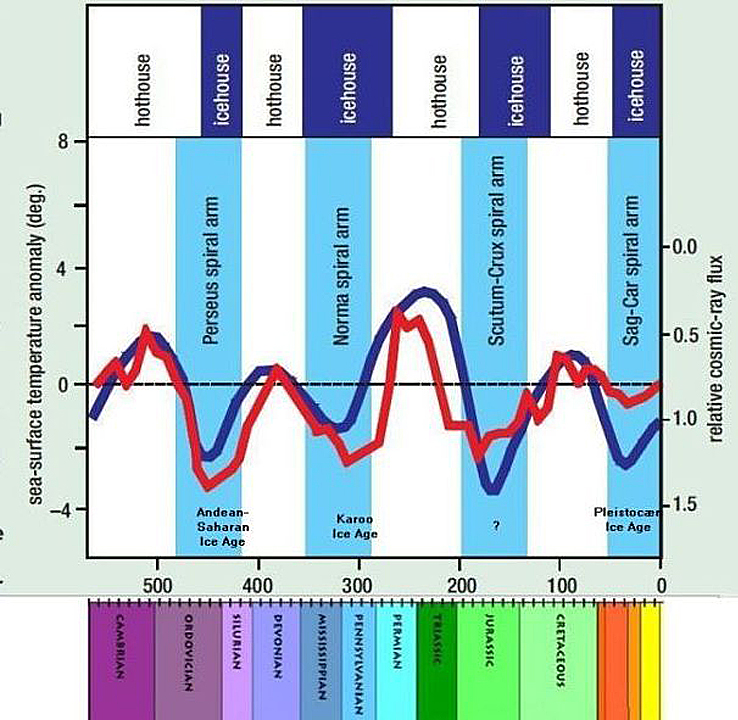
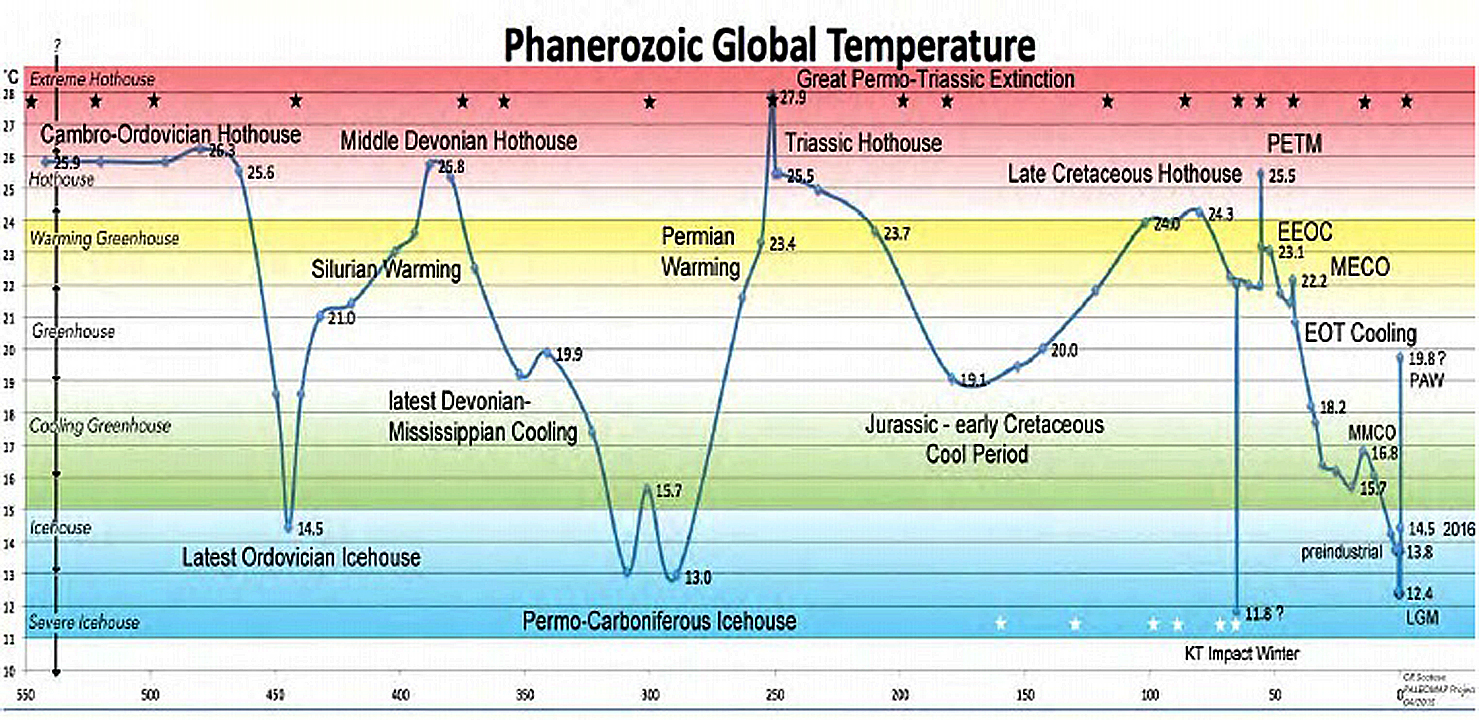


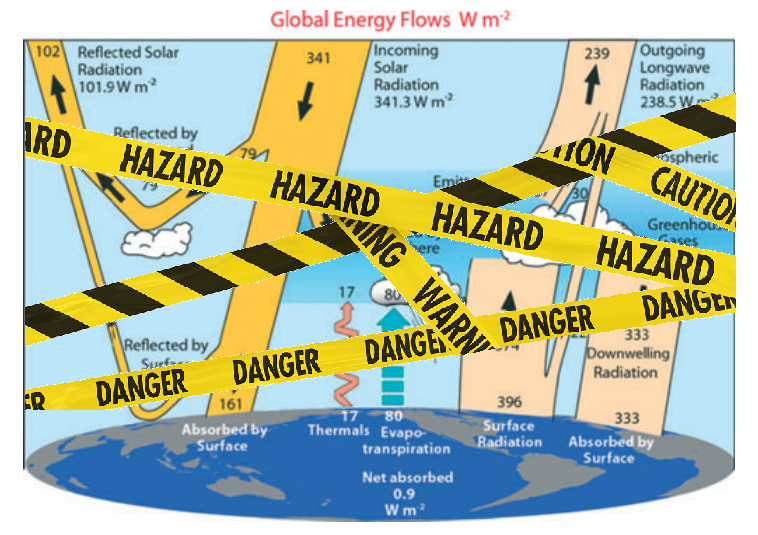
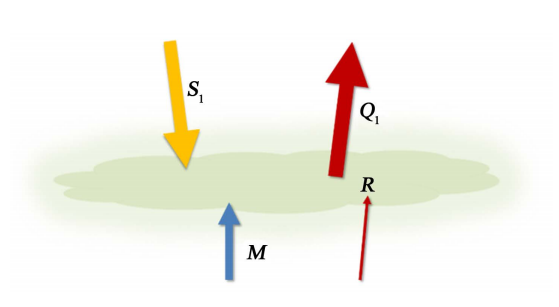
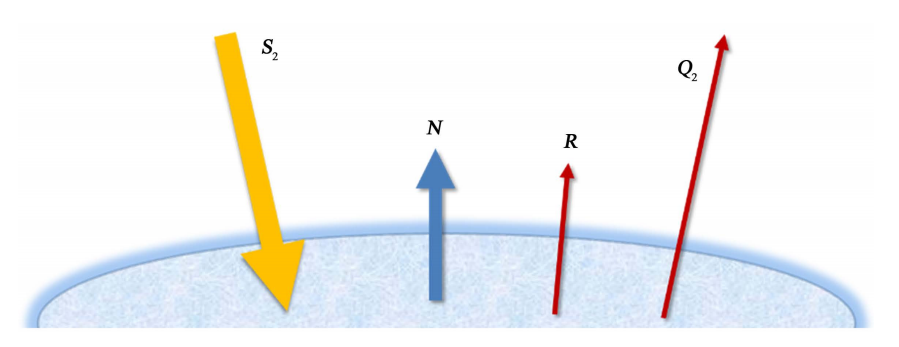
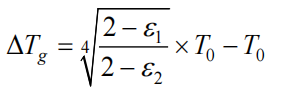
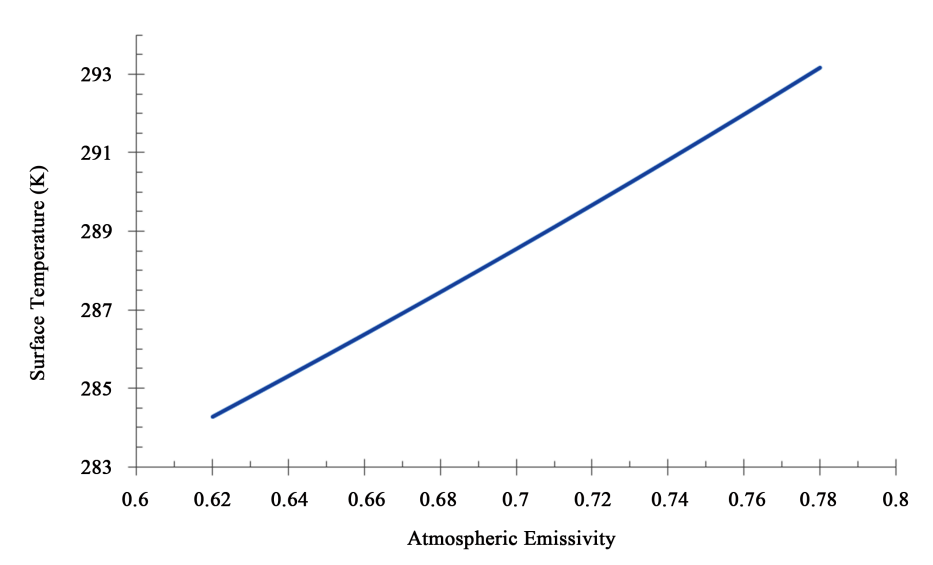
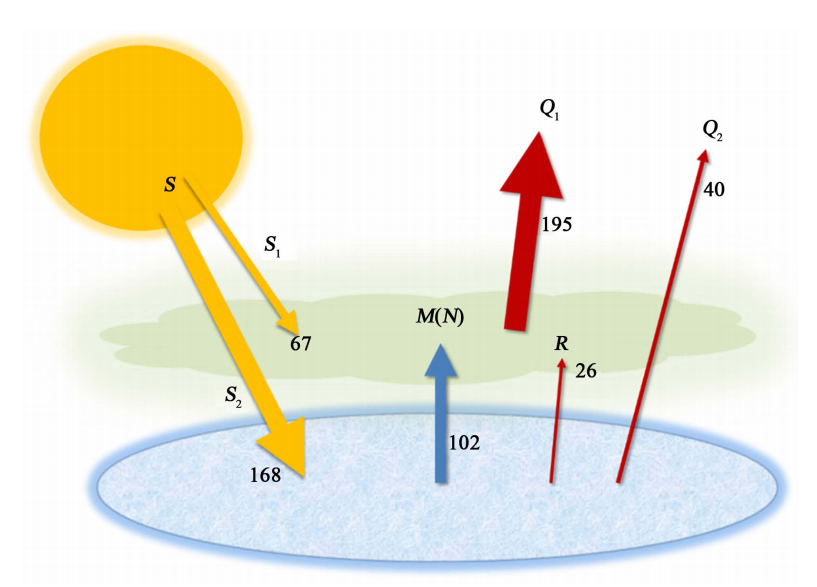
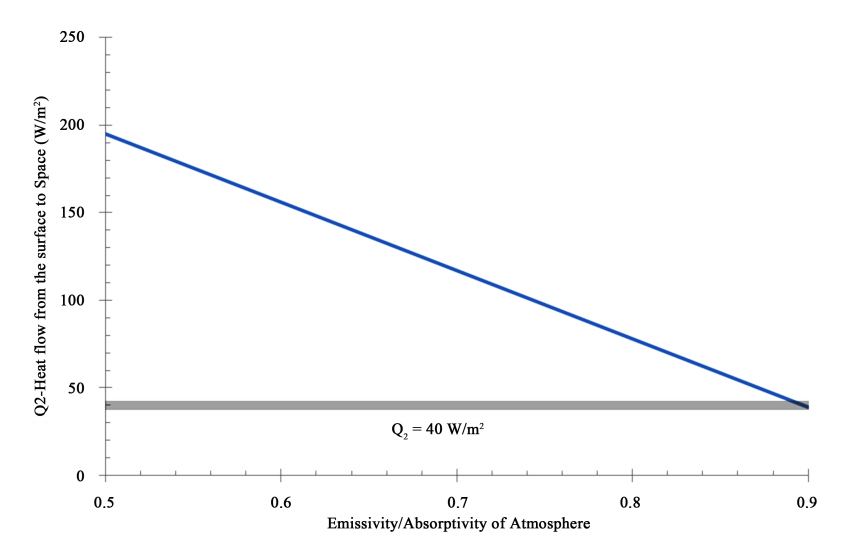
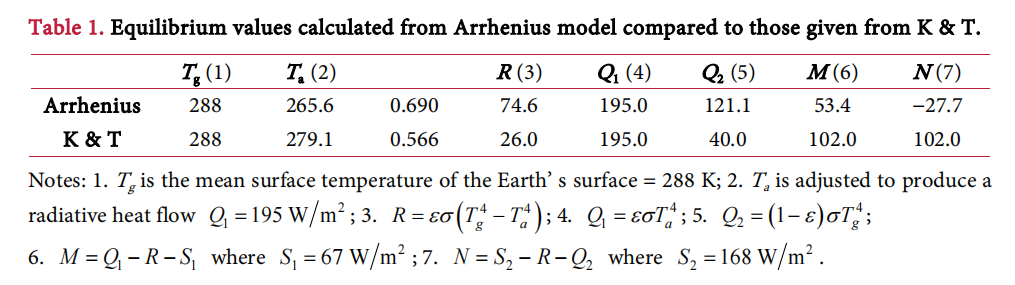
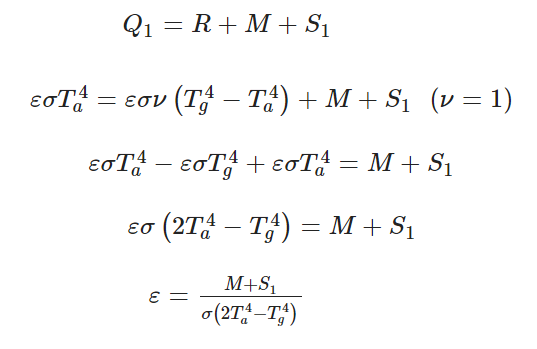
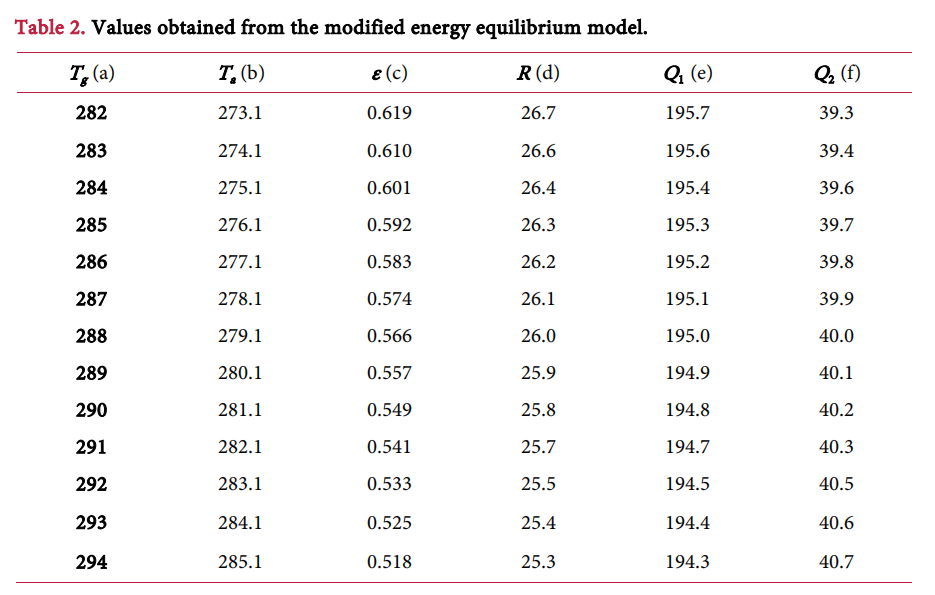
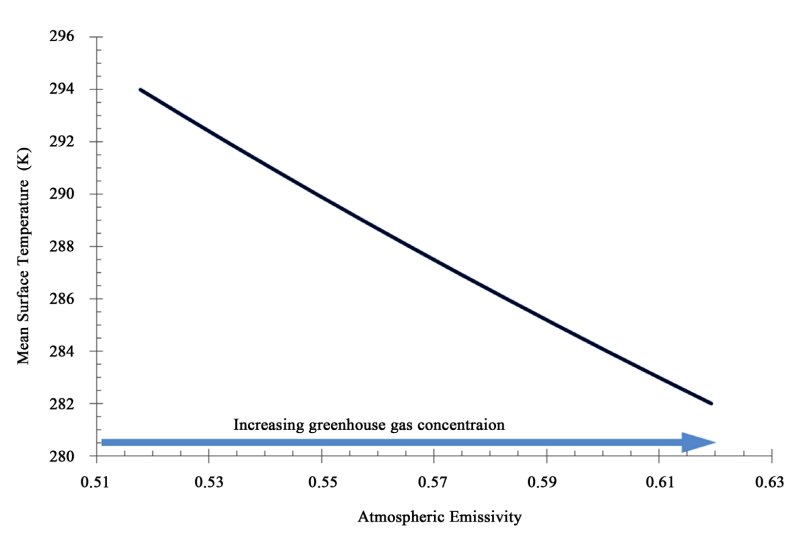
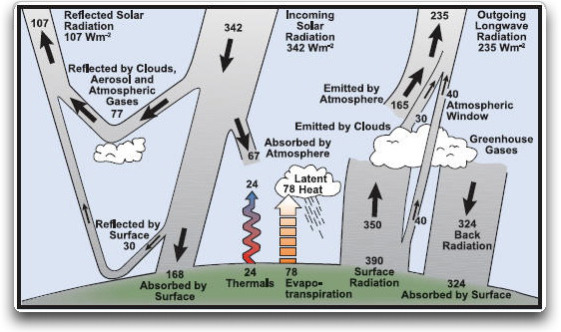
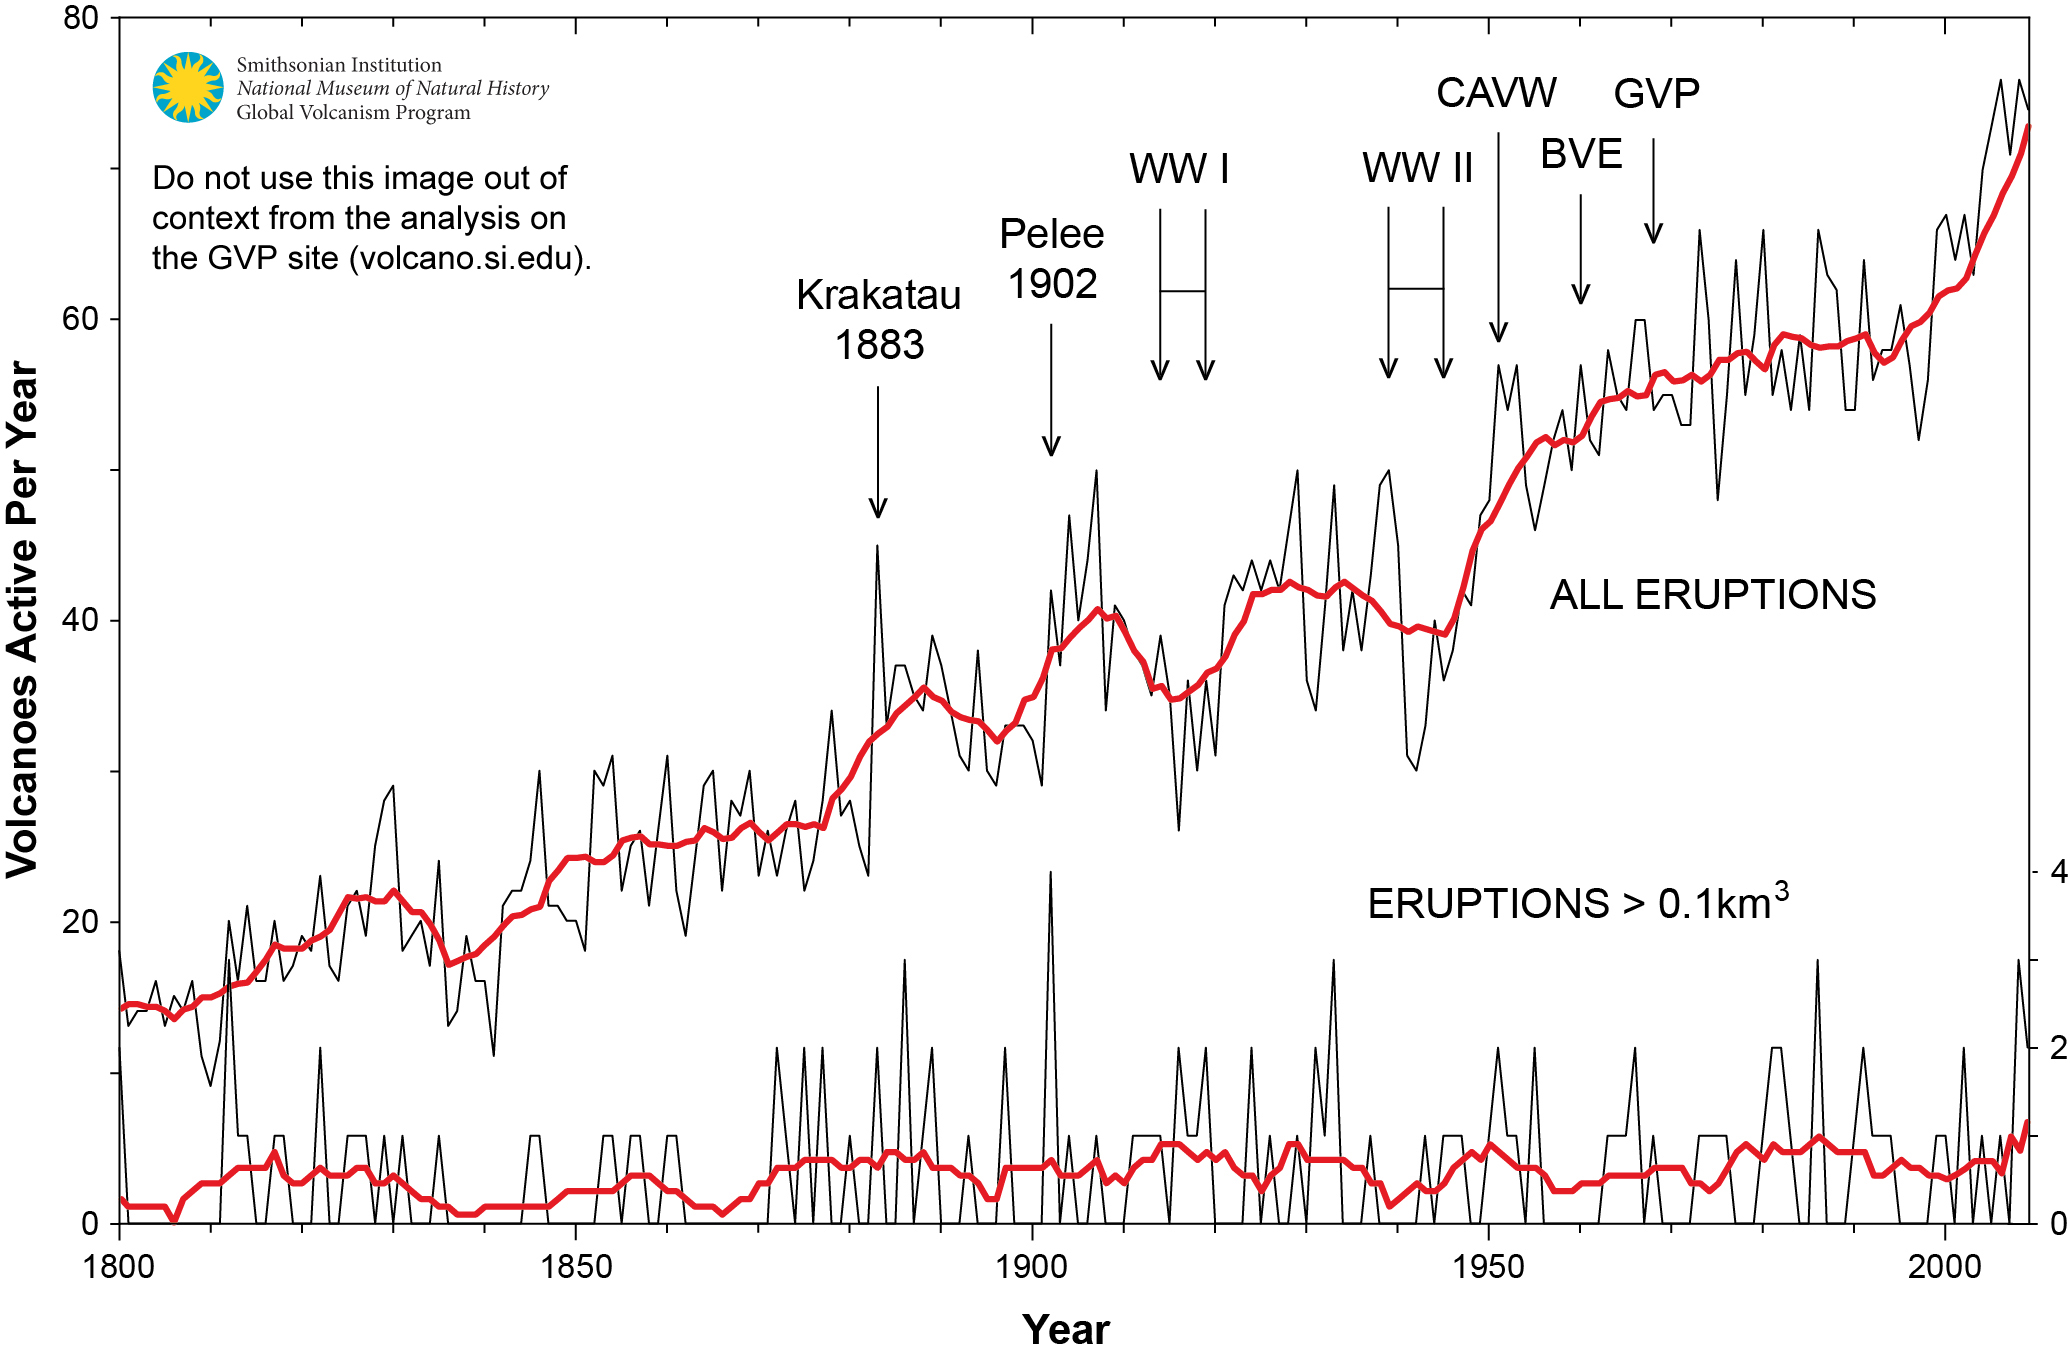
 When I presented this diagram to my warmist friends, they would respond, “But you don’t know what caused the LIA or what ended it!” To which I would say, “True, but we know it wasn’t due to burning fossil fuels.” Now I find there is a body of evidence suggesting what caused the LIA and why the temperature rebound may be over. Part of it is a familiar observation that the LIA coincided with a period when the sun was lacking sunspots, the Maunder Minimum, and later the Dalton.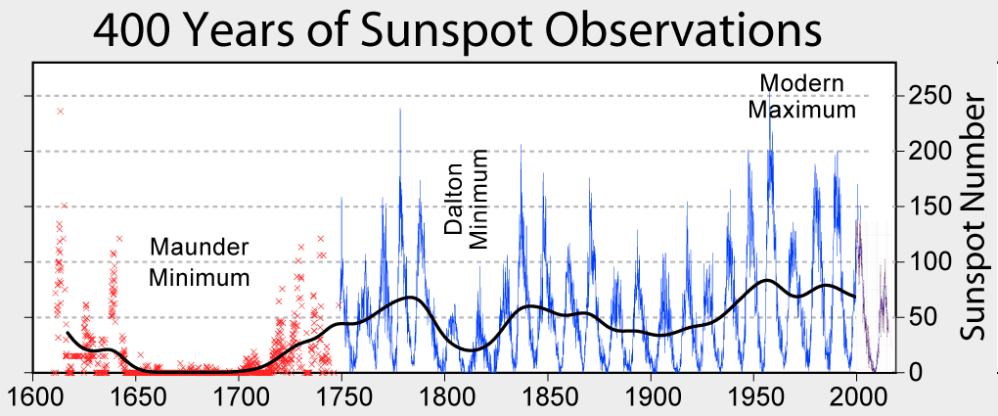
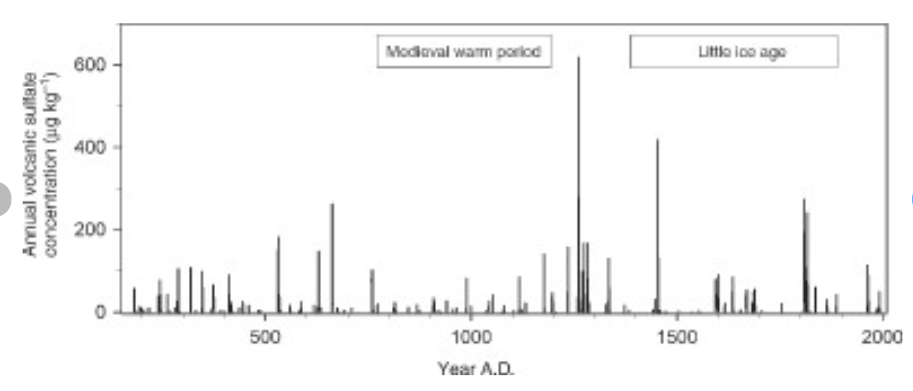
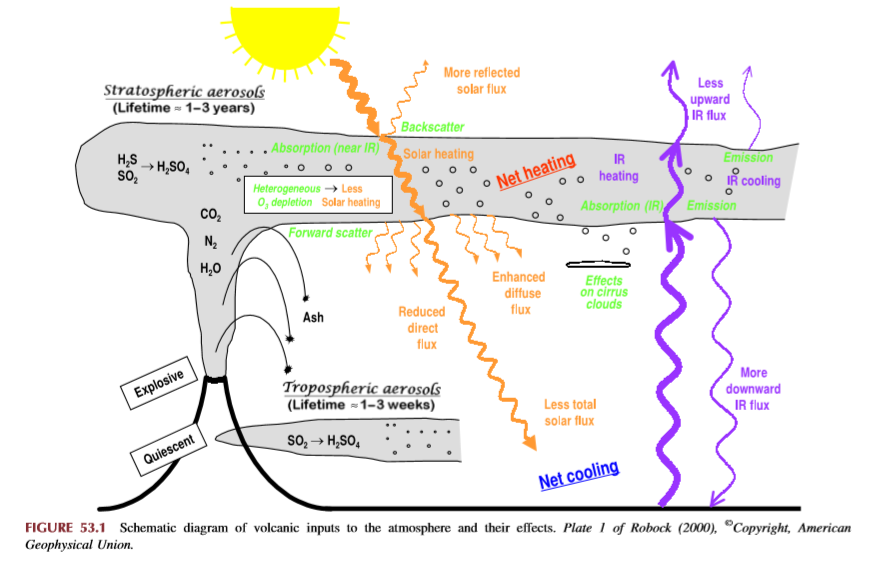
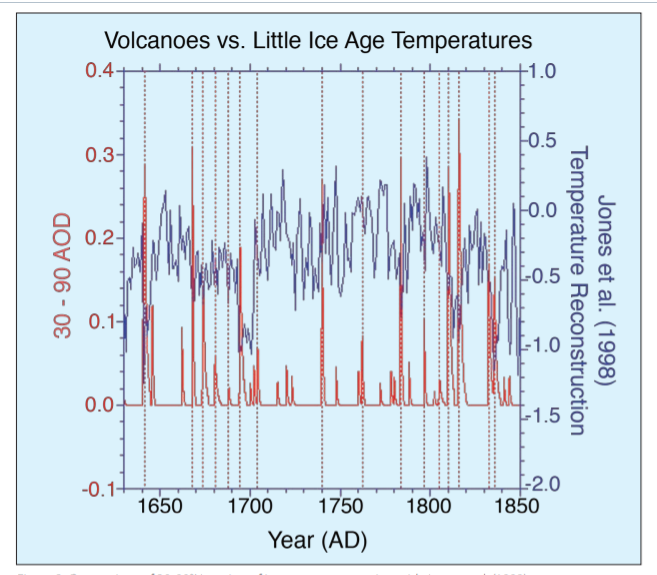

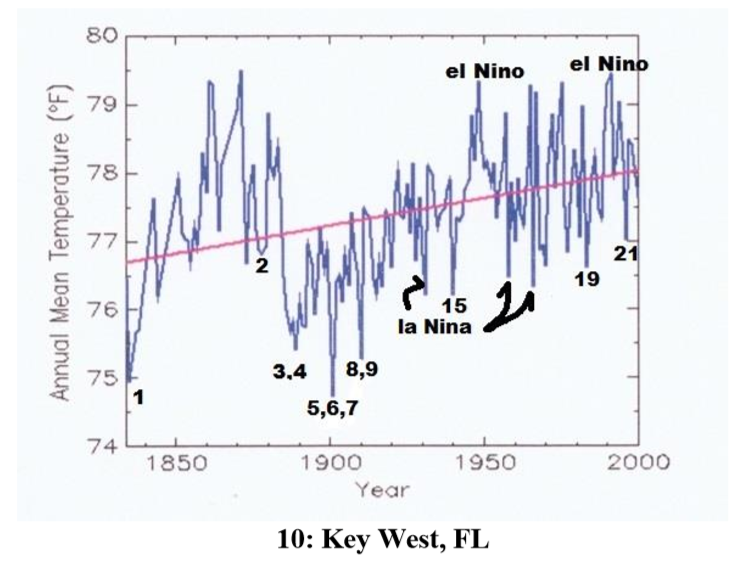
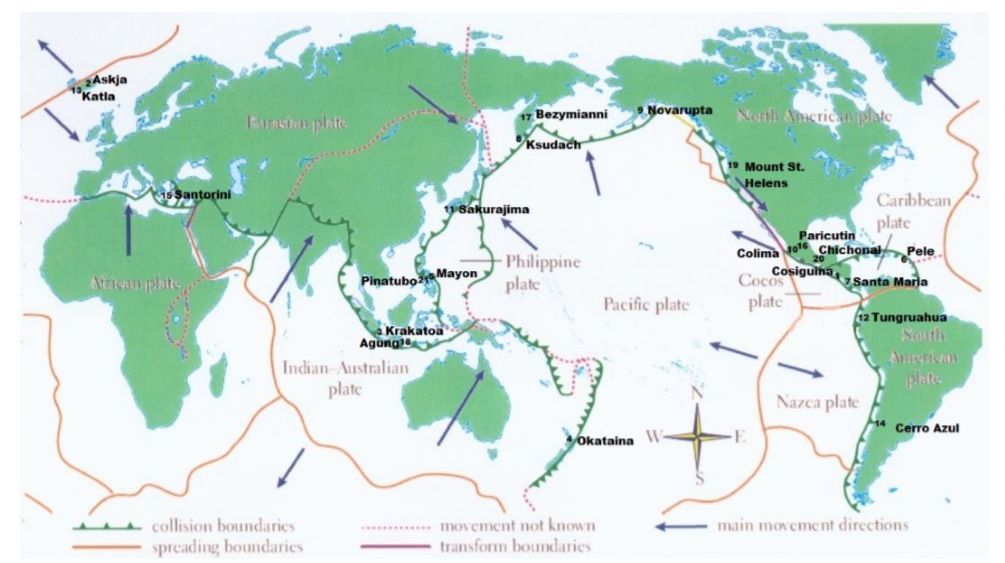


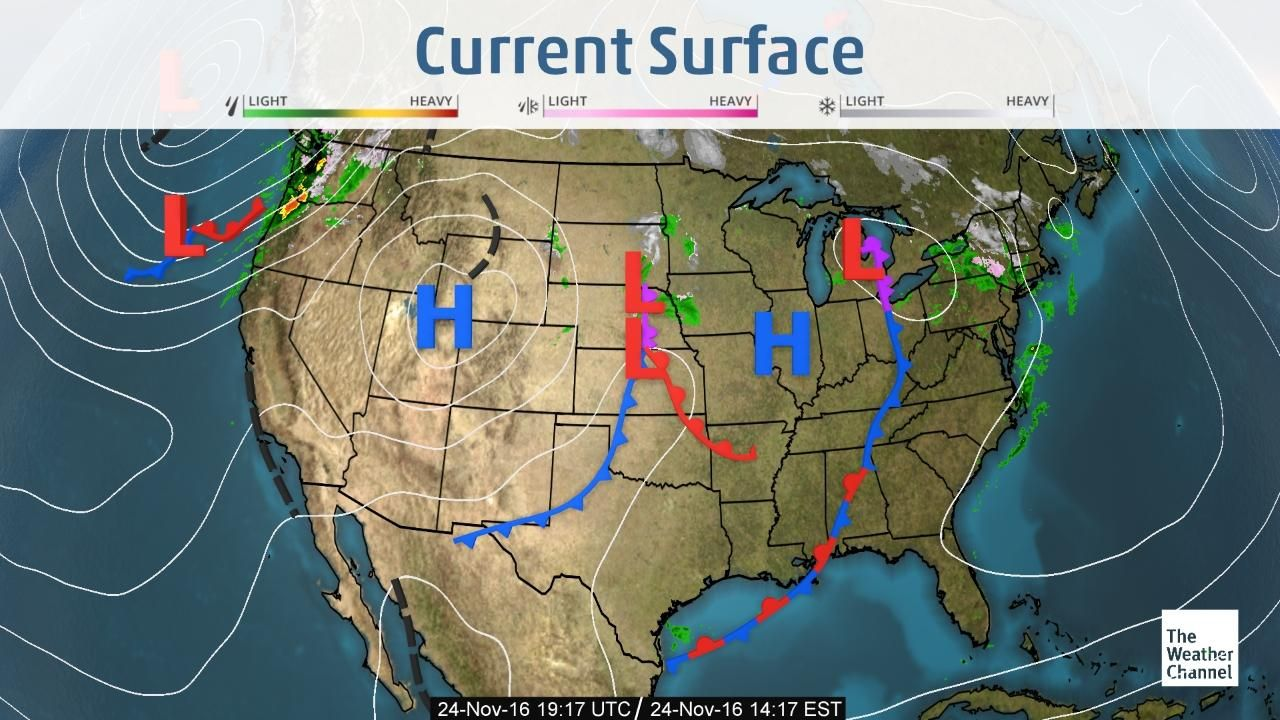

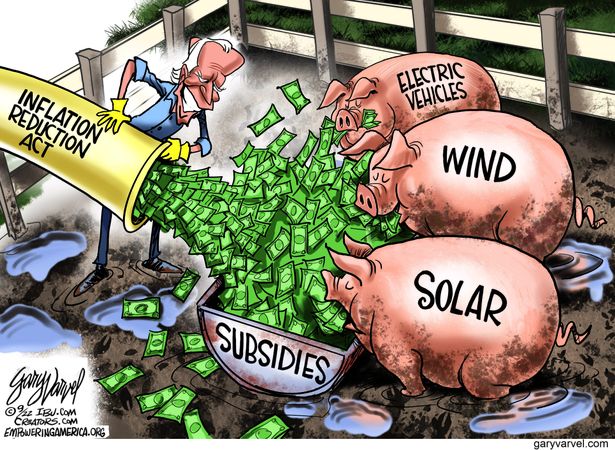



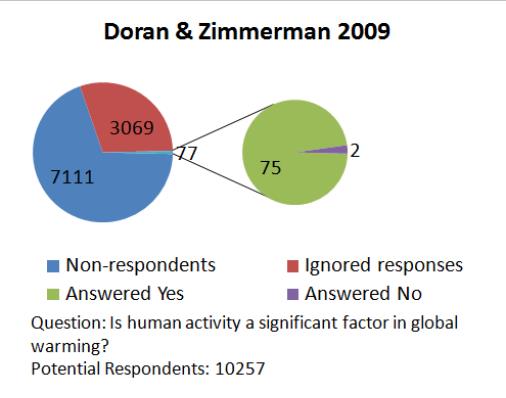

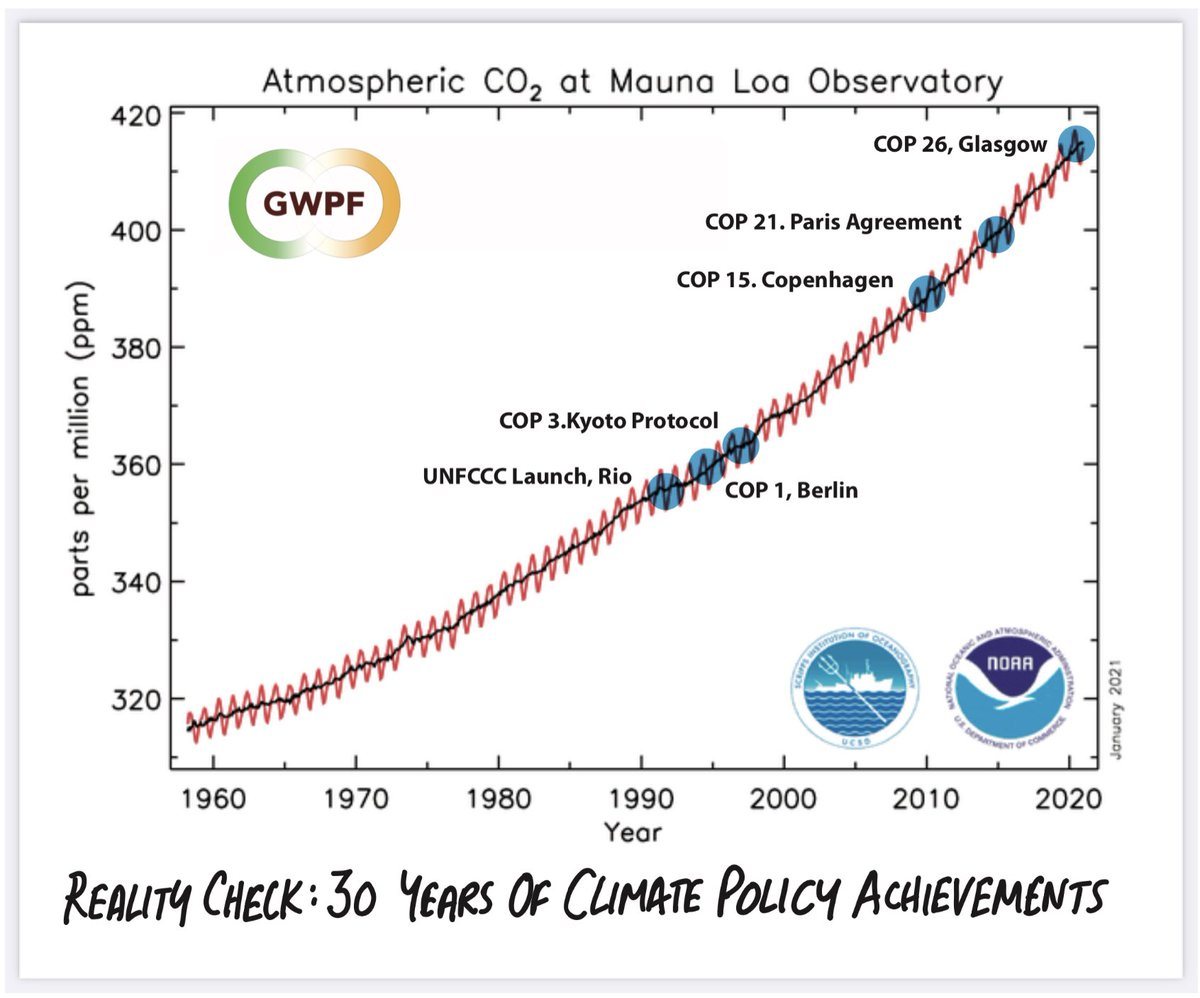

 Science Matters
