One of the major points in discussion of the anthropogenic global warming (AGW) scenario is the time the added carbon dioxide (CO2) stays in the atmosphere. In an extensive study, Solomon concluded that the residence time of carbon atoms in the atmosphere is of the order of 10 years [1], see Table 1. Such a short time would undermine the prime tenet of AGW, since a molecule of CO2 will not have time to contribute to any greenhouse effect before it disappears to sinks where it cannot do any thermal harm.
However, some claim that the residence time (the amount of time a molecule on average spends in the atmosphere before it disappears from it) is not relevant for this discussion; what matters is the adjustment time (or relaxation time or (re)-equilibration time), the time it takes for a new equilibrium to establish, the time constant seen in the observed transient, and, allegedly, these two are different. In a recent work, Cawley explains it as [3]
… natural fluxes into and out of the atmosphere are closely balanced and, hence, comparatively small anthropogenic fluxes can have a substantial effect on atmospheric concentrations.
In the current work, we use these exact two concepts, with turnover time called residence time. We also focus on first-order systems mentioned here by the IPCC. We discuss the difference between residence time on the one hand, and adjustment time on the other hand, and test the hypothesis that the adjustment time can be longer than the residence time by mathematical methods. After having addressed this core point, we perform a calculation based on the available data to see how they fit.
2. Residence Time and Adjustment Time (Methods, Data, Results and Analysis)
Figure 1. Two-box model of the carbon dioxide cycle. The top box represents the atmosphere, with a total carbon dioxide mass of 3403 Gt. Humans add 38 Gt per year to the system. Nature adds Fn+ and takes away Fn− to a sink represented by the bottom box. That sink has a total CO2 mass equal to S. The residence time in the atmosphere, τa is well known and estimated to be 5 years, the residence time in the sink τs is not well known.
In what follows, we will use a simple two-box first-order model, see Figure 1. The atmosphere has a mass of carbon dioxide equal to A. CO2 molecules can be captured into a sink and this occurs at a certain rate, a fraction of the molecules being trapped per time unit. Each individual molecule has a certain probability to be captured over time. In other words, a molecule has a residence time τa in the atmosphere (also sometimes called the ’turnover time’), which is the reciprocal of the rate, ka. Likewise, in the sink, there is a carbon dioxide mass equal to S, where molecules have a residence time τs; an individual molecule has a certain probability over time to be released by the sink into the atmosphere, or a rate ks.
Humans add an extra flux into the atmosphere labeled Fh. On the basis of this, we can determine the adjustment time τ of the atmosphere in terms of the residence times. This requires solving a simple mathematical differential equation; we do not have to worry at this moment about the thermodynamics and explain why the reaction constants are what they are. The questions we ask are, if we add an amount of carbon dioxide ΔA to it:
What are the new equilibrium values of A and S?
How long does it take to establish this new equilibrium?
Figure 2. (a) A two-box simulation of atmosphere (A) and sink (S) of Figure 1.
Before injection of 100 into the atmosphere, the atmosphere-sink system was in equilibrium at 100 each, with the residence ‘times’ in both atmosphere and sink 1000 iterations. At each iteration A/τa is moved from atmosphere to sink and S/τs moved from sink to atmosphere. As can be seen, the observed adjustment time (relaxation time) of the system is 500 iterations, as predicted by Equation (9). After 500 iterations, the surplus quantity in the atmosphere relative to the new equilibrium has been reduced to 1/e, a level indicated by a horizontal dashed line. Further, a half-life can be defined, a time at which half of the transient amplitude has passed, t1/2=τln(2)= 347. This is indicated by a dotted line. (b) The adjustment time τ, as a function of the sink residence time τs, normalized by the atmospheric residence time τa. The dot indicates the value of the plot in (a), τs=τa, resulting in τ=τa/2 .
As can be seen, the adjustment time is shorter than the atmospheric residence time
for all values of the sink residence time, with, for large τs,
the adjustment time τ approaching the atmospheric residence time τa.
“individual carbon dioxide molecules have a short life time of around 5 years in the atmosphere. However, when they leave the atmosphere, they are simply swapping places with carbon dioxide in the ocean. The final amount of extra CO2 that remains in the atmosphere stays there on a time scale of centuries.”
Their flawed reasoning is that the adjustment time (relaxation time) is the massperturbation in the atmosphere divided by the flux balance, and, so goes the reasoning, while fluxes can be great (and the residence time short), the balance is close to zero and the relaxation time can then approach infinity.
3. Scenarios
We can now do a more detailed analysis based on the available data.
Table 2. Carbon dioxide facts, with the natural outflux Fn− derived from the mass in the atmosphere and the residence time. Other important parameters, influx Fn+, sink mass S, and sink residence time τs are less well known and should be considered adjustable.
The residence time in the atmosphere can be estimated quite well from the above-ground atomic bomb tests [1], which makes us happy that these at least served the purpose of advancing atmospheric science, if nothing else. The best estimate is about τa= 5 years [9]. Other references mention different times, with the IPCC mentioning the shortest (4 years) in their 5th Assessment Report (p. 1457 of Ref. [4]), showing that this value is not settled yet; we will use 5 years in this work. The equilibrium amount of carbon dioxide in the atmosphere is open for debate, but, for this purpose, we might use the consensus value of 280 ppm (A∗= 2250 Gt). To estimate the amount of CO2 in the sink is very difficult. However, there seems to be a general view that it is fifty times more than in the atmosphere,S=50A=113,400 Gt (relatively unchanged since pre-industrial times). Using the combination of these values does not allow for consistent bookkeeping, as the reader can easily verify. Something has to yield. In what follows, we will try out some scenarios based on specific assumptions.
3.1. Scenario: Pre-Industrial Atmosphere Was at Equilibrium
First we assume that the pre-industrial level of 280 ppm was indeed an equilibrium value with influx equal to outflux in the absence of human flux, as we are wont to believe, but that the mass in the sink S and the residence time τs in the sink are unknown.
Figure 4. Above-ground atomic-bomb explosions produced a lot of 14 C that stopped in the 1960s. From a fit (dashed line) of data from 1965, we find an adjustment time of τ = 14.0 a, and an amplitude of ΔA = 740, with a final value of A′∞ = 30. This enables stating that the sink must be at least 24 times larger than the atmosphere. Data from Enting (blue) found in a work of Perruchoud [11] and Nydal et al. [10] (green), extracted with WebPlotDigitizer [12].
It seems that the idea of the pre-industrial level stable at 280 ppm (with Fn+=Fn−at 280 ppm) is untenable. It seems very likely that the sink was already off-balance and emitting amounts of carbon dioxide at the beginning of the industrial era and the increase in the atmospheric CO2 at any time in human history is not solely due to human activity. This would also explain the large pre-Mauna-Loa values found with chemical methods summarized by Beck [13] and Slocum [14]. For instance, values of 500 ppm have been observed around 1940. Ignoring these facts, on the other hand, would be equivalent to throwing entire generations of scientists under the bus.
[Comment: CO2 higher concentrations prior to 20th century are also indicated by use of plant stomata as paleo proxies for CO2 estimations.]
3.2. Scenario: The Sink Is Fifty Times Larger Than the Atmosphere
Next, we adopt the assumption that the sink at this moment really has 50 times more carbon than the atmosphere, in other words, S=50A= 170,000 Gt, and release the restriction that the atmosphere was stable at 280 ppm; in pre-industrial times there can have been a flux imbalance.
We see indeed a tremendous outgassing from the sink in pre-industrial times. The system was far from equilibrium, with an imbalance being a net influx of F∗n+−F∗n−= 207 Gt/a. Where, at the moment, there is a net natural flux of 18 Gt/a out of the atmosphere, in pre-industrial times, in this two-box first-order model with a sink 50 times larger than the atmosphere, there was a net natural influx of 207 Gt/a.
Somewhere, we must have passed the equilibrium value and,
considering the above numbers, this value must be
rather close to today’s concentration of 420 ppm.
3.3. Scenario: Residence Time in the Sink Is Much Larger Than in the Atmosphere
If we only assume that the residence time in the sink is much larger than in the atmosphere, τs≫τa, then we can get a good idea of what has happened to our anthropogenic contribution to the carbon in the atmosphere, Fh, based on the two-box model.
Figure 3. (a) Yearly global CO 2 emissions from fossil fuels. (b) Cumulative emissions (integral of left plot). The yellow curve is the remainder of the anthropogenic CO 2 in the atmosphere if we assume a residence time in the sink much longer than the 5-year residence time in the atmosphere; in this case τs=50τa was used. (Source of data: Our World In Data [8]).
Figure 3 shows the yearly carbon dioxide emissions into the atmosphere (left panel; data source: Our World In Data [8]). The total amount so far emitted is 1696.5 Gt. The right panel shows the cumulative emissions, ∑yeariFh(i). If at every year we apply the fluxes according to Equation (1), then we can see at each year how much of the anthropogenic CO2 is still in the atmosphere. The right panel of Figure 3 shows this for τs=50τa.
We see that only 202.3 Gt of the total injected 1696.5 Gt is still in the atmosphere.
In these years, the amount of CO2 in the atmosphere has risen from 280 ppm (2268 Gt) to 420 ppm (3403 Gt), an increment of 1135 Gt. Of these, 202.3 Gt (17.8%) would be attributable to humans and the rest, 932.7 Gt (82.2%), must be from natural sources.
In view of this, curbing carbon emissions seems rather fruitless;
even if we destroy the fossil-fuel-based economy (and human wealth with it),
we would only delay the inevitable natural scenario by a couple of years.
3.4. Scenario: Abandoning Constant Residence Times
We have seen here how the first-order-kinetics two-box model results in conclusions contrary to data. We could, of course, change our model. We could abandon the idea of first-order kinetics (where flux is proportional to mass), but that would be problematic to justify with physics.
We could also add more boxes to the system, distinguishing the sinks, or differentiating between deep ocean and shallow ocean, dissolved carbon dioxide gas, CO2 (aq), and dissolved organic carbon (sea-shells), or between CO2 disappearing in the oceans and being sequestered in biological matter on land, etc.
However, we expect the most likely improvement to the model to come from
abandoning the idea that the residence times τa and τs are constant.
They, in fact, are very much dependent on temperature. As an example, the ratio between the two that tells us the concentrations (and, thus, the masses) between carbon dioxide in the atmosphere and in the sink, if we assume this sink to be the oceans, is governed by Henry’s Law, and this concentration ratio is then dependent on temperature.
When including such effects, we might even conclude that the entire concentration of carbon dioxide in the atmosphere is fully governed by such environmental parameters and fully independent of human injections into the system. A is simply a function of many parameters, including the temperature T, but not Fh. It is as if the relaxation time is extremely short and any disturbances introduced by humans, or by other means, rapidly disappear, rapidly reaching the equilibrium determined by nature.
This fits very nicely with the recent finding that the stalling of the economy and the accompanying severe reduction in carbon emissions during the Covid pandemic had no visible impact on the dynamics of the atmosphere whatsoever [15]. The result of that research, the hypothesis that the carbon dioxide increments in the atmosphere were fully due to natural causes and not humans, fits the experimental data very well, and the hypothesis that humans are fully responsible for the increments can equally be rejected scientifically. This then also agrees with the conclusions of Segalstad that “The rising atmospheric CO2 is the outcome of rising temperature rather than vice versa” [16].
The pre-industrial atmosphere might indeed have been in equilibrium,
and we are currently also in, or close to, equilibrium.
That seems to us to be the most likely scenario.
Once we admit the possibility of non-anthropogenic sources of carbon dioxide, we can start finding out what they might be. Examples such as volcanic sources, planetary and solar cycles spring to mind. It might well be that the climate puzzle is solved in such areas as the link between solar activity and seismic activity and climate [17].
This is, however, not the focus of this work. We conclude here by summarizing the major findings of this analysis using a first-order-kinetics two-box model:
(1) The adjustment time is never larger than the residence time and is less than 5 years.
(2) The idea of the atmosphere being stable at 280 ppm in pre-industrial times is untenable.
(3) Nearly 90% of all anthropogenic carbon dioxide has already been removed from the atmosphere.
Footnote: Human CO2 Emissions Flat Last Decade
Annual total global CO2 emissions – from fossil and land-use change – between 2000 and 2021 for both the 2020 and 2021 versions of the Global Carbon Project’s Global Carbon Budget. Shaded area shows the estimated one-sigma uncertainty for the 2021 budget. Data from the Global Carbon Project; chart by Carbon Brief using Highcharts.
Previously, the GCP data showed global CO2 emissions increasing by an average of 1.4 GtCO2 per year between 2011 and 2019 – prior to Covid-related emissions declines. The new revised dataset shows that global CO2 emissions were essentially flat – increasing by only 0.1GtCO2 per year from 2011 and 2019. When 2020 and 2021 are included, the new GCP data actually shows slightly declining global emissions over the past decade, though this should be treated with caution due to the temporary nature of Covid-related declines. Source: Global CO2 emissions have been flat for a decade, new data reveals
[Comment: Note the earlier chart above showing MLO atmospheric CO2 rising continuously while human emissions were flat.]
E.M. Smith provides an helpful critique of a recent incomplete theory of earth’s climate functioning in his Chiefio blog post So Close–Missing Convection and Homeostasis. Excerpts in italics with my bolds and added images.
It is Soooo easy to get things just a little bit off and miss reality. Especially in complex systems and even more so when folks raking in $Millions are interested in misleading for profit. Sigh.
Sabine Hosenfelder does a wonderful series of videos ‘explaining’ all sorts of interesting things in and about actual science and how the universe works. She is quite smart and generally “knows her stuff”.But… It looks like she has gotten trapped into the Radiative Model of Globull Warming.
The whole mythology of Global Warming depends on having you NOT think about anything but radiative processes and physics. To trap you into the Radiative Model. But the Earth is more complex than that. Much more complex. Then there’s the fact that you DO have some essential Radiative Physics to deal with, so the bait is there. However…
It is absolutely essential to pay attention to convection in the lower atmosphere
and to the “feedback loops” or homeostasis in the system.
The system acts to restore its original state. There is NO “runaway greenhouse” or we would have never evolved into being since the early earth had astoundingly high levels of CO2 and we would have baked to death before getting out of our slime beds as microbes.
Figure 16. The geological history of CO2 level and temperature proxy for the past 400 million years. CO2 levels now are ~ 400ppm. Source: Davis, W. J. (2017).
OK, I’ll show you her video. It is quite good even with the “swing and a miss” at the end. She does 3 levels of The Greenhouse Gas Mythology so you can see the process evolving from grammar school to high school to college level of mythology. But then she doesn’t quite make it to Post-Doc Reality.
Where’s she wrong? (Well, not really wrong, but lacking…)
I see 2 major issues. First off, she talks about the “lower atmosphere warming”. Well, yes and no. It doesn’t “warm” in the sense of getting hotter, but it does speed up convection to move the added heat flow.
In English “heating” has 2 different meanings. Increasing temperature.
Increasing heat flow at a temperature.
We see this in “warm up the TV dinner in the microwave” meaning to heat it up from frozen to edible; and in the part where the frozen dinner is defrosting at a constant temperature as it absorbs heat but turns it into the heat of fusion of water. So you can “warm it up” by melting at a constant temperature of frozen water (but adding a LOT of thermal energy – “heat”) then later as increasing temperature once the ice is melted. It is very important to keep in mind that there are 2 kinds of “heating”. NOT just “increasing temperature”.
In the lower atmosphere, the CO2 window / Infrared Window is already firmly slammed shut. Sabine “gets that”. Yay! One BIG point for her! No amount of “greenhouse gas” is going to shut that IR window any more. As she points out, you get about 20 meters of transmission and then it is back to molecular vibrations (aka “heat”).
So what’s an atmosphere to do? It has heat to move! Well, it convects. It evaporates water.
Those 2 things dominate by orders of magnitude any sort of Radiative Model Physics. Yes, you have radiation of light bringing energy in, but then it goes into the ocean and into the dirt and the plants and even warms your skin on a sunny day. And it sits there. It does NOT re-radiate to any significant degree. Once “warmed” by absorption, heat trying to leave as IR hits a slammed shut window.
The hydrological cycle. Estimates of the observed main water reservoirs (black numbers in 10^3 km3 ) and the flow of moisture through the system (red numbers, in 10^3 km3 yr À1 ). Adjusted from Trenberth et al. [2007a] for the period 2002-2008 as in Trenberth et al. [2011].
So what does happen? Look around, what do you see? Clouds. Rain. Snow. (sleet hail fog etc. etc.)
Our planet is a Water Planet. It moves that energy (vibrations of atoms, NOT radiation) by having water evaporate into the atmosphere. (Yes, there are a few very dry deserts where you get some radiative effects and can get quite cold at night via radiation through very dry air, but our planet is 70% or so oceans, so those areas are minor side bars on the dominant processes). This water vapor makes the IR window even more closed (less distance to absorption). It isn’t CO2 that matters, it is the global water vapor.
What happens next?
Well, water holds a LOT of heat (vibration of atoms and NOT “temperature”) as the heat of vaporization. About 540 calories per gram (compared to 80 for melting “heat of fusion” and 1 for specific heat of a gram of water). Compare those numbers again. 1 for a gram of water. 80 for melting a gram of ice. 540 for evaporating a gram of water. It’s dramatically the case that evaporation of water matters a lot more than melting ice, and both of them make “warming water” look like an irrelevant thing.
Warming water is 1/80 as important as melting ice, and it is 1/540 th as important as evaporation of the surface of the water. Warming air is another order of magnitude less important to heat content.
So to have clue, one MUST look at the evaporation of water from the oceans as everything else is in the small change.
Look at any photo of the Earth from space. The Blue Marble covered in clouds. Water and clouds. The product of evaporation, convection, and condensation. Physical flows carrying all that heat (“vibration of atoms” and NOT temperature, remember). IF you add more heat energy, you can speed up the flows, but it will not cause a huge increase in temperature (and mostly none at all). It is mass flow that changes. The number of vibrating molecules at a temperature, not the temperature of each.
In the end, a lot of mass flow happens, lofting all that water vapor with all that heat of vaporization way up toward the Stratosphere. This is why we have a troposphere, a tropopause (where it runs out of steam… literally…) and a stratosphere.
What happens when it gets to the stratosphere boundary? Well, along the way that water vapor turns into water liquid very tiny drops (clouds) and eventually condenses to big drops of water (rain) and some of it even freezes (hail, snow, etc.). Now think about that for a minute. That’s 540 calories per gram of heat (molecular vibration NOT temperature, remember) being “dumped” way up high in the top of the troposphere as it condenses, and another 80 / gram if if freezes. 620 total. That’s just huge.
This is WHY we have a globe covered with rain, snow, hail, etc. etc. THAT is all that heat moving. NOT any IR Radiation from the surface. Let that sink in a minute. Fix it in your mind. WATER and ICE and Water Vapor are what moves the heat, not radiation. We ski on it, swim in it, have it water our crops and flood the land. That’s huge and it is ALL evidence of heat flows via heat of vaporization and fusion of water.
It is all those giga-tons of water cycling to snow, ice and rain, then falling back to be lofted again as evaporation in the next cycle. That’s what moves the heat to the stratosphere where CO2 then radiates it to space (after all, radiation toward the surface hits that closed IR window and stops.) At most, more CO2 can let the Stratosphere radiate (and “cool”) better. It can not make the Troposphere any less convective and non-radiative.
Then any more energy “trapped” at the surface would just run the mass transport water cycle faster. It would not increase the temperature.
More molecules would move, but at a limit on temperature. Homeostasis wins. We can see this already in the Sub-Tropics. As the seasons move to fall and winter, water flows slow dramatically. I have to water my Florida lawn and garden. As the seasons move to spring and summer, the mass flow picks up dramatically. Eventually reaching hurricane size. Dumping up to FEET of condensed water (that all started as warm water vapor evaporating from the ocean). It is presently headed for about 72 F today (and no rain). At the peak of hurricane season, we get to about 84 or 85 F ocean surface temperature as the water vapor cycle is running full blast and we get “frog strangler” levels of rain. That’s the difference. Slow water cycle or fast.
IF (and it is only an “if”, not a when) you could manage to increase the heat at the surface of the planet in, say, Alaska: At most you would get a bit more rain in summer, a bit more snow in winter, and MAYBE only a slight possible, of one or two days that are rain which could have been snow or sleet.
Then there’s the fact that natural cycles swamp all of that CO2 fantasy anyway. The Sun, as just one example, had a large change of IR / UV levels with both the Great Pacific Climate Shift (about 1975) and then back again in about 2000. Planetary tilt, wobble, eccentricity of the orbit and more put us in ice ages (as we ARE right now, but in an “interglacial” in this ice age… a nice period of warmth that WILL end) and pulls us out of them. Glacials and interglacials come and go on various cycles (100,000 years, 40,000 years, and 12,000 year interglacials – ours ending now, but slowly). The simple fact is that Nature Dominates, and we are just not relevant. To think we are is hubris of the highest order.
Figure 9: Two contrasting views of the effects of how the continuous intensification of deep cumulus convection would act to alter radiation flux to space. The top (bottom) diagram represents a net increase (decrease) in radiation to space
Footnote
There are two main reasons why investigators are skeptical of AGW (anthropogenic global warming) alarm. This post intends to be an antidote to myopic and lop-sided understandings of our climate system.
CO2 Alarm is Myopic: Claiming CO2 causes dangerous global warming is too simplistic. CO2 is but one factor among many other forces and processes interacting to make weather and climate.
Myopia is a failure of perception by focusing on one near thing to the exclusion of the other realities present, thus missing the big picture. For example: “Not seeing the forest for the trees.” AKA “tunnel vision.”
2. CO2 Alarm is Lopsided: CO2 forcing is too small to have the overblown effect claimed for it. Other factors are orders of magnitude larger than the potential of CO2 to influence the climate system.
Lop-sided refers to a failure in judging values, whereby someone lacking in sense of proportion, places great weight on a factor which actually has a minor influence compared to other forces. For example: “Making a mountain out of a mole hill.”
There is no other issue over the past 20 and probably 30 years that has more obtained the attention of the world’s press than global warming.
I know there have been others. But none has had such a continuous and insistent presence.
No other issue has had the sweet, soft, giddy support of the big networks, the great corporations, the trendy school boards, every mad virtue-signalling politician (the chieftain of which is Prime Minister Justin Trudeau), and the whole wide and multitudinous, amoeba-replicative (and dreadful) NGOS — think of the various foundations, of which I nominate the Suzuki Foundation as the Canadian prince of these dull harrying grouplets — as global warming.
I am aware I am using the old and opportunistically discarded
brand-name here: global warming.
Global warming was the term du jour when the thesis was we were heading into thermal crisis, the snow caps were to disappear, glaciers would go all water in the next 30 years or so, skiers would stare down snow-clean slopes, the seas would swamp New York and Tokyo, and children would weep at bared un-snowed hill-slides.
Alas. Snow kept falling. Seas refused to swell to city-destroying levels. Some winters remained … cold. Ski slopes had snow. And children still in all their sweet joy sledded down the still snow-blanketed hills.
Imagine — the planet’s weather refused to follow Greenpeace’s furious warnings.
Elizabeth May’s hothouse weepings, the latest bulletins from various second-tier folk singers, and people who slept on multimillion-dollar yachts on the French Riviera who deplored those who drove pickup trucks in Northern Alberta.
It was for naught. The Earth has its own ideas. And may probably continue to have them. Presuming the cosmos itself doesn’t go woke.
So it was obvious that “global warming,” the doomster’s environmental taglinerequired what the communication shops call a “re-branding.” And there being no set more adjusted to the miracles of communications management than the herd of apocalyptic global warming warriors, they — perhaps with much polling, and certainly with much cuteness — changed the brand to “climate change.”
Climate change. There’s a conceptual “get out of jail” brand.
A useful digression: I come from dear, sweet Newfoundland. And I know this will not mean much for you who are not from my province — but I grew up in Placentia Bay.
In Placentia Bay the climate changes every six minutes. And on rough days, every four. Climate change is a beautiful redundancy. It always changes. And if it didn’t … well, it wouldn’t be climate.
So the new brand of “climate change” had this going for it — it gave a blanket rationalefor every twitch and tingle or every “weather event” of any kind, wet or cold, hot or dry, a justification under its pure and infinitely elastic designation.
And every TV station, every “weather specialist” was on board with pointing
to “climate change” as the universal cause.
CBC and TV Ontario kept up the silly surmise, having aired Al Gore’s ridiculous, abysmally ignorant An Inconvenient Truth as if it was a script from Sinai, not on stone tablets of course, but “verified” by the “scientists” at the Academy Awards.
Climate change as a brand and a switch-name has gone unchallenged by the main media. Most of them have endorsed a silence on respectable, authoritative, independent and resolute minds who offer more than a different view, but a neutral, rational, and science-based contesting opinion on what has become more of a doxology than matter for exchange, debate, and informed challenge.
Consider Dr. Richard Lindzen. His qualifications on atmospheric science are superb. He is not a “culture warrior.” He is not “political.” He is a great thinking mind — that last term is a very high compliment.
He recently gave a long — nearly two hours — interview with Jordan Peterson, on “climate change,” all conducted with great calm and a backand-forth that followed no script. It was, to my view, one of the cleanest discussions of this issue I have seen.
Dr. Lindzen has the authority of real knowledge on this topic, and therefore his reasonings are worth full and wide attention.
The interview is a model of intellectual exchange, something long lost on our big networks with their fixed views and hollow coverage.
Dr. Lindzen is a font of clear thought, non-agenda-driven deliberation, and direct statement.
It would be a wild wish to see Peterson’s interview with Dr. Lindzen on CBC or TVO. It would break the hearts of their morning agenda meeting attendees. And would threaten their “diversity” and climate change mandates, which are, apparently, whatever the Suzuki foundation and Steven Guilbeault think are correct must be correct.
Watch this interview, even if you are committed to “global warming” theorizations.
And, to Ms. Catherine Tait, CBC president currently wandering the great Canadian landscape arguing CBC’S relevance and point. Here’s a thought: diversity is a quality of mind and intellect. It is not a submission to current faddishness.
Try airing the interview with Dr. Lindzen as an experiment with diversity of thought.
It may be a strange thing to say, but a broadcaster, subsidized and leaning on past glories, should earn its present-day respect by looking around and giving a glimpse at opinions and perspectives outside the glass case of its own treasured ever-so-correct eidolons of virtue-speak.
Doctors for Disaster Preparedness are concerned to be ready for real disasters and not be distracted by irrational fears like global warming/climate change. They have provided a useful resource for people to test and deepen their knowledge of an issue distorted for many people by loads of misinformation and exaggerations.
From David Wojick:
A new lesson set called the Climate Change IQ (CCIQ) provides a good skeptical critique of ten top alarmist claims. The format is succinct and non-technical. Each alarmist claim is posed as a question, followed by a short skeptical answer, which is highlighted with a single telling graphic.
Then there is a link to a somewhat longer answer, which in turn includes links to a few online sources of more information. Each lesson is also available in a printable PDF version, suitable for classroom use. This compact format is potentially very useful.
CCIQ comes from a long-standing skeptical group called the Doctors for Disaster Preparedness (DDP). Despite the name, DDP gives attention to pointing out scares that are not disasters waiting to happen. Not surprisingly climate alarmism gets a lot of this attention.
The ten topic questions are wide ranging, including the following. Each speaks to a popular pro-alarmist news hook.
Is climate change the most urgent global health threat?
Are government-sponsored climate scientists the only credible sources of information relating to climate-change policy?
Is the increase in atmospheric CO2 making wildfires worse?
Why can’t all States emulate California’s proposed “clean” energy standards?
What would happen if atmospheric CO2 concentration dropped by half, say to less than 200 ppm?
Are human CO2 emissions acidifying the oceans and endangering shell-making animals?
Will Manhattan and Florida soon be under water if humans do not curtail use of “fossil fuels”?
Do 97% of climate scientists agree that catastrophic climate change will result if humans do not curtail use of “fossil fuels”? (This one includes the dynamite John Christy graph showing the rapidly growing divergence of climate model global temperature forecasts with real world observations.)
Note: Each question title links to a pdf with a longer answer and references. Question 1 link is in red above as an example. See the CCIQ questionnaire for links to all 10 pdfs
Check it out. Inquiring minds want to know.
Footnote:
“The reason some of us are skeptical about man-made global warming, or climate change, isn’t that we’re in “denial” or the pay of Big Oil. It’s the alarmists’ long run of lurid failed predictions. The models “run hot.” Arctic ice hasn’t vanished. The coral hasn’t died. We haven’t been overrun by rats and super-itchy poison ivy.” John Robson National Post Canada
S. Fred Singer (1924 – 2020) passed away on April 6, 2020 at the age of 95.
Dr. Singer is the author, coauthor, and editor of many books, including Climate Change Reconsidered (several volumes), a comprehensive critique of the assessment reports of the United Nations’ Intergovernmental Panel on Climate Change. He was a senior fellow of The Heartland Institute and research fellow with the Independent Institute.
Dr. Singer published more than 200 technical papers in peer-reviewed scientific journals, His editorial essays and articles have appeared in Cosmos, The Wall Street Journal, New York Times, New Republic, Newsweek, Journal of Commerce, Washington Times, Washington Post, and many other publications. His accomplishments have been featured in front-cover stories appearing in Time, Life, and U.S. News & World Report
Dr. Singer was an elected Fellow of the American Association for the Advancement of Science (AAAS), American Geophysical Union, American Physical Society, and American Institute for Aeronautics and Astronautics. Dr. Singer gave hundreds of lectures and seminars on global warming, including to the science faculties at leading universities around the world.
This post commemorates his steadfast labors to expose the truth of climate change as a natural variability and to neutralize the poison of claiming humans are causing a climate crisis or emergency. To this end below is a synopsis of his analysis originally published Sept. 10, 2001 in the Wall Street Journal. The source is Water Vapor Rules the Greenhouse System at ClimateCite.
Just how much of the “Greenhouse Effect” is caused by human activity?
It is about 0.28%, if water vapor is taken into account– about 5.53%, if not.
This point is so crucial to the debate over global warming that how water vapor is or isn’t factored into an analysis of Earth’s greenhouse gases makes the difference between describing a significant human contribution to the greenhouse effect, or a negligible one.
Water vapor constitutes Earth’s most significant greenhouse gas, accounting for about 95% of Earth’s greenhouse effect (4). Interestingly, many “facts and figures’ regarding global warming completely ignore the powerful effects of water vapor in the greenhouse system, carelessly (perhaps, deliberately) overstating human impacts as much as 20-fold.
Water vapor is 99.999% of natural origin. Other atmospheric greenhouse gases, carbon dioxide (CO2), methane (CH4), nitrous oxide (N2O), and miscellaneous other gases (CFC’s, etc.), are also mostly of natural origin (except for the latter, which is mostly anthropogenic).
For those interested in more details a series of data sets and charts have been assembled below in a 5-step statistical synopsis.
Note that the first two steps ignore water vapor.
♦ 1. Greenhouse gas concentrations
♦ 2. Convertingconcentrations to contribution
♦ 3. Factoring in water vapor
♦ 4. Distinguishing natural vs man-made greenhouse gases
♦ 5. Putting it all together
Note: Calculations are expressed to 3 significant digits to reduce rounding errors, not necessarily to indicate statistical precision of the data. All charts were plotted using Lotus 1-2-3.
Caveat: This analysis is intended to provide a simplified comparison of the various man-made and natural greenhouse gases on an equal basis with each other. It does not take into account all of the complicated interactions between atmosphere, ocean, and terrestrial systems, a feat which can only be accomplished by better computer models than are currently in use.
1. The following table was constructed from data published by the U.S. Department of Energy (1) and other sources, summarizing concentrations of the various atmospheric greenhouse gases. Because some of the concentrations are very small the numbers are stated in parts per billion. DOE chose to NOT show water vapor as a greenhouse gas!
TABLE 1.The Important Greenhouse Gases (except water vapor) U.S. Department of Energy, (October, 2000) (1)
Table 1 is not a very meaningful view because 1) the data has not been corrected for the actual Global Warming Potential (GWP) of each gas, and 2) water vapor is ignored. But these are the numbers one would use if the goal is to exaggerate human greenhouse contributions:
The various greenhouse gases are not equal in their heat-retention properties though, so to remain statistically relevant % concentrations must be changed to % contribution relative to CO2. This is done in Table 2, below, through the use of GWP multipliers for each gas, derived by various researchers.
2. Using appropriate corrections for the Global Warming Potential of the respective gases provides the following more meaningful comparison of greenhouse gases, based on the conversion:
( concentration )X( the appropriate GWP multiplier (2) (3) of each gas relative to CO2 )= greenhouse >contribution.:
TABLE 2.Atmospheric Greenhouse Gases (except water vapor)
adjusted for heat retention characteristics, relative to CO2
NOTE: GWP (Global Warming Potential) is used to contrast different greenhouse gases relative to CO2.
Compared to the concentration statistics in Table 1, the GWP comparison in Table 2 illustrates, among other things:
♦ Total carbon dioxide (CO2) contributions are reduced to 72.37% of all greenhouse gases (368,400 / 509,056)– (ignoring water vapor).
Also, from Table 2 (but not shown on graph):
♦ Anthropogenic (man-made) CO2 contributions drop to (11,880 / 509,056) or 2.33% of total of all greenhouse gases, (ignoring water vapor).
♦ Total combined anthropogenic greenhouse gases becomes(28,162 / 509,056) or 5.53% of all greenhouse gas contributions, (ignoring water vapor).
To properly represent the total relative impacts of Earth’s greenhouse gases Table 3 (below) factors in the effect of water vapor on the system.
3. Table 3, shows what happens when the effect of water vapor is factored in, and together with all other greenhouse gases expressed as a relative % of the total greenhouse effect.
TABLE 3.Role of Atmospheric Greenhouse Gases (man-made and natural) as a % of Relative
Contribution to the “Greenhouse Effect”
Total atmospheric carbon dioxide (CO2) — both man-made and natural– is only about 3.62% of the overall greenhouse effect— a big difference from the 72.37% figure in Table 2, which ignored water!
Water vapor, the most significant greenhouse gas, comes from natural sources and is responsible for roughly 95% of the greenhouse effect (4). Among climatologists this is common knowledge but among special interests, certain governmental groups, and news reporters this fact is under-emphasized or just ignored altogether.
Conceding that it might be “a little misleading” to leave water vapor out, they nonetheless defend the practice by stating that it is “customary” to do so!
4. Of course, even among the remaining 5% of non-water vapor greenhouse gases, humans contribute only a very small part (and human contributions to water vapor are negligible).
Constructed from data in Table 1, the charts (below) illustrate graphically how much of each greenhouse gas is natural vs how much is man-made. These allocations are used for the next and final step in this analysis– total man-made contributions to the greenhouse effect. Units are expressed to 3 significant digits in order to reduce rounding errors for those who wish to walk through the calculations, not to imply numerical precision as there is some variation among various researchers.
5. To finish with the math, by calculating the product of the adjusted CO2 contribution to greenhouse gases (3.618%) and % of CO2 concentration from anthropogenic (man-made) sources (3.225%), we see that only (0.03618 X 0.03225) or 0.117% of the greenhouse effect is due to atmospheric CO2 from human activity. The other greenhouse gases are similarly calculated and are summarized below.
TABLE 4a.Anthropogenic (man-made) Contribution to the “Greenhouse Effect,” expressed as % of Total (water vapor INCLUDED)This is the statistically correct way to represent relative human contributions to the greenhouse effect.
From Table 4a, both natural and man-made greenhouse contributions are illustrated in this chart, in gray and green, respectively. For clarity only the man-made (anthropogenic) contributions are labeled on the chart.
♦ Water vapor, responsible for 95% of Earth’s greenhouse effect, is 99.999% natural (some argue, 100%). Even if we wanted to we can do nothing to change this.
♦ Anthropogenic (man-made) CO2 contributions cause only about 0.117% of Earth’s greenhouse effect, (factoring in water vapor). This is insignificant!
♦ Adding up all anthropogenic greenhouse sources, the total human contribution to the greenhouse effect is around 0.28% (factoring in water vapor).
The Kyoto Protocol calls for mandatory carbon dioxide reductions of 30% from developed countries like the U.S. Reducing man-made CO2 emissions this much would have an undetectable effect on climate while having a devastating effect on the U.S. economy. Can you drive your car 30% less, reduce your winter heating 30%? Pay 20-50% more for everything from automobiles to zippers? And that is just a down payment, with more sacrifices to come later.
Such drastic measures, even if imposed equally on all countries around the world, would reduce total human greenhouse contributions from CO2 by about 0.035%.
My Comment
Readers may have wondered, as I have, how the typical Earth Energy Balance diagrams can show surface solar radiation amounting to ~161 W/m2 and downwelling IR atmospheric radiation ~333 W/m2, more than twice as much. This despite the fact that shorter wavelengths are more energetic and longer wavelengths have less energy.
Part of the problem lies in calculating the conversion from radiation amounts to energy. The formula is Energy level E = pV, where p is the Planck constant and V is the frequency. Too often the shortcut is to assume the average frequency of visible light as the conversion factor. That is a reasonable assumption for sunlight, but greatly exaggerates the energy of LWIR, which is 10 to 20 times longer than sunlight wavelengths.
In the tables above Dr. Singer did all the calculations considering each GHG’s volume and adjusted it by its ability to absorb IR radiation and the energy carried by each IR frequency.
Footnote
A comment below dismisses Fred Singer’s expertise, likely based on a popular climate paradigm that is logical, simple and wrong. To understand the flaws in thinking about earth’s climate, see this post:
In 1896, Svante Arrhenius proposed a model predicting that increased concentration of carbon dioxide and water vapour in the atmosphere would result in a warming of the planet. In his model, the warming effects of atmospheric carbon dioxide and water vapour in preventing heat flow from the Earth’ s surface (now known as the “Greenhouse Effect”) are counteracted by a cooling effect where the same gasses are responsiblefor the radiation of heat to space from the atmosphere. His analysis found that there was a net warming effect and his model has remained the foundation of the Enhanced Greenhouse Effect—Global Warming hypothesis.
This paper attempts to quantify the parameters in his equations but on evaluation his model cannot produce thermodynamic equilibrium. A modified model is proposed which reveals that increased atmospheric emissivity enhances the ability of the atmosphere to radiate heat to space overcoming the cooling effect resulting in a net cooling of the planet. In consideration of this result, there is a need for greenhouse effect—global warming models to be revised.
1. Introduction
In 1896 Arrhenius proposed that changes in the levels of “carbonic acid” (carbon dioxide) in the atmosphere could substantially alter the surface temperature of the Earth. This has come to be known as the greenhouse effect. Arrhenius’ paper, “On the Influence of Carbonic Acid in the Air upon the Temperature of the Ground”, was published in Philosophical Magazine. Arrhenius concludes:
“If the quantity of carbonic acid in the air should sink to one-half its present percentage, the temperature would fall by about 4˚; a diminution to one-quarter would reduce the temperature by 8˚. On the other hand, any doubling of the percentage of carbon dioxide in the air would raise the temperature of the earth’s surface by 4˚; and if the carbon dioxide were increased fourfold, the temperature would rise by 8˚ ” [ 2 ].
It is interesting to note that Arrhenius considered this greenhouse effect a positive thing if we were to avoid the ice ages of the past. Nevertheless, Arrhenius’ theory has become the foundation of the enhanced greenhouse effect―global warming hypothesis in the 21st century. His model remains the basis for most modern energy equilibrium models.
2. Arrhenius’ Energy Equilibrium Model
Arrhenius’ proposed a two-part energy equilibrium model in which the atmosphere radiates the same amount of heat to space as it receives and, likewise, the ground transfers the same amount of heat to the atmosphere and to space as it receives. The model contains the following assumptions:
• Heat conducted from the center of the Earth is neglected.
• Heat flow by convection between the surface and the atmosphere and throughout the atmosphere remains constant.
• Cloud cover remains constant. This is questionable but allows the model to be quantified.
Part 1: Equilibrium of the Air
The balance of heat flow to and from the air (or atmosphere) has four components as shown in Figure 1. The arrow labelled S1 indicates the solar energy absorbed by the atmosphere. R indicates the infra-red radiation from the surface of the Earth to the atmosphere, M is the quantity of heat “conveyed” to the atmosphere by convection and Q1 represents heat loss from the atmosphere to space by radiation. All quantities are measured in terms of energy per unit area per unit time (W/m2).
Figure 1. Model of the energy balance of the atmosphere. The heat received by the atmosphere ( R+M+S1 ) equals the heat lost to space (Q1). In this single layer atmospheric model, the absorbing and emitting layers are one and the same.
Part 2: Thermal Equilibrium of the Ground
In the second part of his model, Arrhenius describes the heat flow equilibrium at the “ground” or surface of the Earth. There are four contributions to the surface heat flow as shown in Figure 2. S2 is the solar energy absorbed by the surface, R is the infra-red radiation emitted from the surface and transferred to the atmosphere, N is the heat conveyed to the atmosphere by convection and Q2 is the heat radiated to space from the surface. Note: Here Arrhenius uses the term N for the convective heat flow. It is equivalent to the term M used in the air equilibrium model.
Figure 2. The energy balance at the surface of the Earth. The energy received by the ground is equal to the energy lost.
3. Finding the Temperature of the Earth
Arrhenius combined these equations and, by eliminating the temperature of the atmosphere which according to Arrhenius “has no considerable interest”, he arrived at the following relationship:
ΔTg is the expected change in the temperature of the Earth for a change in atmospheric emissivity from ε1 to ε2. Arrhenius determined that the current transparency of the atmosphere was 0.31 and, therefore the emissivity/absorptivity ε1 = 0.69. The current mean temperature for the surface of the Earth can be assumed to be To = 288 K.
Figure 3. Arrhenius’ model is used to determine the mean surface temperature of the Earth as a function of atmospheric emissivity ε. For initial conditions, ε = 0.69 and the surface temperature is 288 K. An increase in atmospheric emissivity produces an increase in the surface temperature of the Earth.
Arrhenius estimated that a doubling of carbon dioxide concentration in the atmosphere would produce a change in emissivity from 0.69 to 0.78 raising the temperature of the surface by approximately 6 K. This value would be considered high by modern climate researchers; however, Arrhenius’ modelhas become the foundation of the greenhouse-global warming theory today. Arrhenius made no attempt to quantify the specific heat flow values in his model. At the time of his paper there was little quantitative data available relating to heat flow for the Earth.
4. Evaluation of Arrhenius’ Model under Present Conditions
More recently, Kiehl and Trenberth (K & T) [ 3 ] and others have quantified the heat flow values used in Arrhenius’ model. K & T’s data are summarised in Figure 4.
The reflected solar radiation, which plays no part in the energy balance described in this model, is ignored. R is the net radiative transfer from the ground to the atmosphere derived from K & T’s diagram. The majority of the heat radiated to space originates from the atmosphere (Q1 > Q2). And the majority of the heat lost from the ground is by means of convection to the atmosphere (M > R + Q2).
Figure 4. Model of the mean energy budget of the earth as determined by Kiehl and Trenberth.
Q2=(1−ε)σνT4e(5)
Substituting ε = 0.567, ν = 1.0 and Tg = 288 K we get: Q2=149.2 W/m2
Using Arrhenius value of 0.69 for the atmospheric emissivity Q2 = 120.9 W/m2.
Both values are significantly more than the 40 W/m2 determined by K & T.
The equation will not balance, something is clearly wrong.
Figure 5 illustrates the problem.
Equation (5) is based on the Stefan-Boltzmann law which is an empirical relationship which describes the amount of radiation from a hot surface passing through a vacuum to a region of space at a temperature of absolute zero. This is clearly not the case for radiation passing through the Earth’s atmosphere and as a result the amount of heat lost by radiation has been grossly overestimated.
No amount of adjusting parameters will allow this relationship to produce
sensible quantities and the required net heat flow of 40 W/m2.
This error affects the equilibrium heat flow values in Arrhenius’ model and the model is not able to produce a reasonable approximation of present day conditions as shown in Table 1. In particular, the convective heat flow takes on very different values from the two parts of the model. The values M and N in the table should be equivalent.
5. A New Energy Equilibrium Model
A modified model is proposed which will determine the change in surface temperature of the Earth caused by a change in the emissivity of the atmosphere (as would occur when greenhouse gas concentrations change). The model incorporates the following ideas:
1) The total heat radiated from the Earth ( Q1+Q2Q1+Q2 ) will remain constant and equal to the total solar radiation absorbed by the Earth ( S1+S2S1+S2 ).
2) Convective heat flow M remains constant. Convective heat flow between two regions is dependent on their temperature difference, as expressed by Newton’s Law of cooling1. The temperature difference between the atmosphere and the ground is maintained at 8.9 K (see Equation 7(a)). M = 102 W/m2 (K & T).
3) A surface temperature of 288 K and an atmospheric emissivity of 0.567 (Equation (7b)) is assumed for initial or present conditions.
Equation (9) represents the new model relating the emissivity of the atmosphere ε to the surface temperature Tg. Results from this model are shown in Table 2. The table shows the individual heat flow quantities and the temperature of the surface of the Earth that is required to maintain equilibrium:
The table shows that as the value of the atmospheric emissivity ε is increased less heat flows from the Earth’s surface to space, Q2 decreases. This is what would be expected. As well, more heat is radiated to space from the atmosphere; Q1 increases. This is also expected. The total energy radiated to space Q1+Q2=235 W/m2 . A plot of the resultant surface temperature Tg versus the atmospheric emissivity ε is shown below Figure 6.
Figure 6. Plot of the Earth’s mean surface temperature as a function of the atmospheric emissivity. This model predicts that the temperature of the Earth will decrease as the emissivity of the atmosphere increases.
6. Conclusion
Arrhenius identified the fact that the emissivity/absorptivity of the atmosphere increased with increasing greenhouse gas concentrations and this would affect the temperature of the Earth. He understood that infra-red active gases in the atmosphere contribute both to the absorption of radiation from the Earth’s surface and to the emission of radiation to space from the atmosphere. These were competing processes; one trapped heat, warming the Earth; the other released heat, cooling the Earth. He derived a relationship between the surface temperature and the emissivity of the atmosphere and deduced that an increase in emissivity led to an increase in the surface temperature of the Earth.
However, his model is unable to produce sensible results for the heat flow quantities as determined by K & T and others. In particular, his model and all similar recent models, grossly exaggerate the quantity of radiative heat flow from the Earth’s surface to space. A new energy equilibrium model has been proposed which is consistent with the measured heat flow quantities and maintains thermal equilibrium. This model predicts the changes in the heat flow quantities in response to changes in atmospheric emissivity and reveals that Arrhenius’ prediction is reversed. Increasing atmospheric emissivity due to increased greenhouse gas concentrations will have a net cooling effect.
It is therefore proposed by the author that any attempt to curtail emissions of CO2
will have no effect in curbing global warming.
The climate realists at Creative Society have put together a short video with pithy statements skewering the CO2 theory of climate change. Above is the video and below a transcript with exhibits and the speakers’ identities.
Dr. Harold Burnett
Over time the atmospheric levels of carbon dioxide have radically fluctuated throughout the earth’s geologic history. They have been in the past as much as 5000 parts per million. Currently they are about 420 parts per million. So over long periods of time they have fluctuated, but in general they have fallen.
Gregory Wrightstone
There doesn’t seem to be any correlation whatsoever with increasing CO2 and temperature. And in fact one of the things we’re being asked to believe is that our modern temperatures are unusual and unprecedented, as thought we’ve never seen temperatures like this in thousands of years. That’s just not the case.
Prof. Ole Ellestad
We have a map showing temperature changes over the last 11,000 years. These are Greenland ice cores and we can see a thousand years ago, about 2000 years ago and about 3000 years ago we had warm periods. And everything indicates that these were periods of global warming.
Hans Borge
It was long before man-made CO2 emissions had any considerable volume. Therefore we know that the natural variability can be large.
Jan-Eric Solheim
In this graph we also show what the IPCC does. It prolongs more or less this curve going to infinite. So it becomes warmer and warmer because of the CO2 release or climate. And that’s what we think is wrong. Our prediction is that it will soon start Cooling and we have to be prepared for that.
Gregory Wrightstone
The warming trend we’re in right now though started more than 300 years ago. But again 250 years of warming took place before we started adding CO2. But we’re asked to believe that those natural forces that have been driving temperatures since the dawn of time suddenly ceased in the 20th century.
Hans Borge
CO2 is a gas that has very little effect on the climate. The IPCC models assume that the higher the CO2 level, the higher the water vapor level, and water vapor is a gas with the greatest impact on the climate. But the assumption that the more CO2, the more water vapor, has never been proved.
Jan-Eric Solheim
With some colleagues I have done experiments to see if CO2 can heat or carry heat. So we have built small greenhouses and tried to heat it by the sun outside or inside with artificial heating. We were able to show that carbon dioxide stops radiation, but we were not able to show any heating. So it’s a mystery how CO2 cannot heat, but what can heat is the water.
Gregory Wrightstone
The water vapor temperature changes first and then CO2 levels follow that. It’s not the other way around. If man increasing CO2 is going to drive temperature, CO2 should change first and then temperature should change.
Jan-Eric Solheim
The blue curve is the temperature of the sea that is the ocean surface temperatures. The red is the land temperature which we get in this case from HadCRUT, which is an official temperature series. First comes the change in the sea temperature, a little bit later the land temperature (red) and then about one year, 10 or 11 months the carbon dioxide changes. And when temperature at the sea surface goes down, the carbon dioxide goes down 10 or 11 months later.
Hans Borge
Well let me show you another table that might tell you a little bit about the CO2 content. Take a look: there are 3 000 billion tons of CO2 in the atmosphere and the total man-made emissions per year are 20 to 30 billion tons. But if you look at the ocean, it has far more CO2. So the exchange of CO2 between the ocean and the atmosphere totally overshadows human activity.
Jan-Eric Solheim
So a more detailed analysis telling that this red part here is apparently what anthropogenic yes or mankind produced carbon dioxide, which is about three percent of the increase from 1960. But nature produces the rest, this variable curve here. So 97 percent of the increase comes from nature, according to these scientists.
Prof. Ole Ellestad
The IPCC also claims that the sun has no effect on us. It’s a great paradox; not clear how they arrive at that. Moreover today we see that the warming is happening not only on our planet but also on other planets and on the moon too, where there’s a completely different atmosphere that has nothing to do with CO2. So clearly there is a sun factor which is missing in their model.
Gregory Wrightstone
Well, the iIPCC if you look back on their charter it was formed to present the data that supports warming. They weren’t tasked to provide all the data. They started with an assumption and went from there. So if that’s their task, they’re doing a darn good job at it. You better have some good science behind you, and it’s just not there.
Dr. Harold Burnett
The world’s governments through the UN formed the UN Framework Convention on Climate Change. Now you would think that would be studying climate change, but they specified that you study the human causes of climate change. So they ruled out all natural factors. They said no no: we’re not going to study whether the sun plays a role; we’re not going to study whether volcanoes play a role; we’re not going to study whether ocean current shifts play a role. And we really don’t understand clouds, so we’re not going to count them much. What we’re going to study is human CO2 emissions because that’s what we can get a handle on.
That’s not the way science is supposed to work. If you make faulty or incomplete assumptions, your models are going to be weak, because they’re only as good as the accuracy of the stuff that’s put in them. Now climate models have failed to accurately reflect past temperatures; they fail to accurately represent present temperatures; but we’re told we can trust their projections of future temperatures. That doesn’t seem reasonable to me.
Gregory Wrightstone
If on the other hand, you like the scientific process, we’re not getting much data out there. Dr Will Happer is our chairman here at the CO2 coalition and he’s got a paper that he and Dr. Van Wijngaarden have done on climate sensitivities. They’re not able to get it in any prestigious journals, yet it’s a landmark study. They need to shut people like me down: I was just banned on linkedin, which should be a professional network, a social media network. I don’t talk those things that are controversial; I post scientific facts, and they were being removed. And they came back and said: No, you’re done. We don’t allow that kind of information on linkedin.
Prof. Ole Ellestad
This debate is so violent that if you go to the media you can express your opinion, but you will be strongly criticized, and then you won’t really have an opportunity to defend yourself. But most importantly, you won’t get into the media with your first articles.
Hans Borge
This is what we see now in the academic world, for example at universities. Academic freedom is so endangered. I have to say that many people who joined the ranks of climate realists do so when they retire; because until retirement they just don’t dare. Researchers who claim something different don’t get grants; they don’t have their say in either published media or in edited journals.
Dr. Harold Burnett
First off you’re having a difficult time getting published because journals won’t hear it. Well, that affects your tenure track position and your colleagues are frowning at you. And you’re not getting government grants because government doesn’t give grants to study natural factors for climate change or to study things that prove humans aren’t causing climate change. Because government has a motive: expanding its its reach. I know researchers who’ve left the field because they feel like they can’t give their honest assessment and get it either published or get tenure.
Prof. Ole Ellestad
Climate and environment are often lumped together. But being against climate doesn’t mean being against the environment. That is, we are not against climate, but we are skeptical of CO2, which is not the same as being skeptical of the environment. So important environmental issues should be discussed and resolved.
Dr. Harold Burnett
That subsurface volcanic activity in Antarctica and even in parts of Greenland and Iceland are contributing to the melting of the glaciers there. That is not controlled by CO2. We don’t control the ocean currents; we don’t control the magnetism of the earth’s magnetic poles and how it shifts or can shift over time. We don’t control our orbit.
We don’t control those things and they’re really what’s driving things. That’s why we should study them, because they’re really what’s driving climate change. And if we think it’s bad, we should know that too.
I want an adaptable society. An adaptable society is one that does not lock us into solving the wrong problem.
The supercontinent Gondwana hundreds of million years ago at its primary stages, and the directions pieces drifted away
That question is the title of Ian Plimer’s Spectator Australia article What Climate Crisis?Excerpts in italics with my bolds and added images.
For more than 80 per cent of time, Earth has been a warm wet greenhouse planet with no ice. We live in unusual times, when ice occurs on continents. This did not happen overnight. The great southern continent, Gondwanaland, formed about 550 million years ago. It occupied 20 per cent of the area of our planet and included Antarctica, South America, Australia, South Africa and the Indian subcontinent.
Gondwanaland was covered by ice when it drifted across the South Pole 360-255 million years ago. Evidence for this ice age is in the black coal districts of Australia, South Africa and India.
If Antarctica is to lose its ice sheets to end the current ice age, plate tectonics must move the continent northwards or fragment Antarctica into smaller land masses. Parts of Antarctica are currently being fragmented which is why there are more than 150 hot spots and volcanoes in rift valleys beneath Antarctic ice. Plate tectonics must also widen the Bering Strait to allow more warm Pacific Ocean water to enter and warm the Arctic.
Arctic ice formed 2.5 million years ago when plate tectonic-driven volcanoes in central America joined North America to South America and stopped Pacific and Atlantic Ocean waters from mixing. This was exacerbated by a supernova explosion that bombarded Earth with cosmic particles to produce cloudiness and cooling.
Figure 16. The geological history of CO2 level and temperature proxy for the past 400 million years. CO2 levels now are ~ 400ppm. Source: Davis, W. J. (2017).
The Earth has been slowly cooling for the last 50 million years from times when life thrived and rapidly diversified. In these warmer times, there were no mass extinctions due to natural warming and, if the planet is warming today, the past shows us that life will thrive and diversify even more.
Once the Antarctic ice formed, ice sheets waxed and waned depending on whether Earth was closer or more distant from the Sun. Within these cycles there were smaller cycles driven by variations in energy emitted from the Sun producing many short warm spikes during long glaciations and very short cold spikes during short interglacials with average temperature rises and falls of more than 10°C a decade.
On a scale of tens of millions of years or more, the Earth’s climate is driven by plate tectonics.
On a scale of hundreds of thousands of years, the Earth’s climate is driven by orbital cycles which bring Earth closer to or more distant from the Sun.
On a scale of thousands of years to decades, the Earth’s climate is driven by variations in energy emitted from the Sun.
If governments, the UN or climate activists want to stop the normal planetary process
of climate change, then they need to stop plate tectonics, stop variations in the Earth’s orbit and stop variations in solar output.
Even the omnipotent, omnipresent Kevin Rudd couldn’t manage this!
No past warming events have been driven by an increase in carbon dioxide in the atmosphere. No past cooling events were driven by a decrease in atmospheric carbon dioxide.
Six of the six most recent ice ages were initiated when the Earth’s atmospheric carbon dioxide was far higher than at present. Atmospheric temperature rise occurs before the carbon dioxide content of the atmosphere rises. It has never been proven that human emissions of carbon dioxide drive global warming despite numerous requests to climate activist scientists for the published evidence. Trillion-dollar bankrupting decisions on energy policy are being made using invalid science.
The peak of the last orbitally-driven interglacialwas 7,000 to 4,000 years ago and for the last 4,000 years the Earth has been cooling as the climate changes from an interglacial into glaciation. There were solar-driven warm spikes such as the Minoan Warming, Roman Warming, Medieval Warming and the Modern Warming and cold spikes (e.g. Dark Ages, Little Ice Age) during this 4,000-year cooling trend.
Solar cycle 25 prediction, NOAA, July 2022
In 2020, we entered the Grand Solar Minimum which is calculated to end in 2053. Whether there will be a solar-driven cooling, similar to the Little Ice Age (1300-1850 AD), or a full-blown orbitally-driven glaciation, such as the last glaciation from 116,000-14,400 years ago, is unknown. The former cooling could last for hundreds of years whereas the latter would last for at least 90,000 years. If there was another period of sustained subaerial volcanism, cooling would be accelerated.
During the last glaciation, Europe was covered with ice north of the Alps, as was Russia; Canada and northern and alpine USA were covered by ice; southern South America and the Andes were covered by ice; Himalayan ice expanded to lower altitudes; and alpine Australia, Tasmania and the South Island of NZ were covered by ice as were the southern and elevated portions of Africa.
In the last glaciation, vegetation contracted and tropical areas such as the Amazon Basin only had copses of trees occupying some ten per cent of the area of the current Amazonian rainforests; large areas of inland Australia, China, India, USA and Africa were covered by sand deposited from cold dry cyclonic winds; inland lakes evaporated; sea level was 130 metres lower than at present; there was no Great Barrier Reef; sea ice isolated Greenland, Iceland, northern Russia and northern Canada; Antarctic sea ice extended hundreds of kilometres north and there was a reduction in rainfall and plant and animal species. Areas that now support pastoral and grain-growing activities were sandy wastelands during the last glaciation.
Humans struggled as hunter-gatherers around the edge of ice sheets and at lower latitudes.
We are putting all our efforts and wasting trillions of taxpayers’ dollars into trying to prevent mythical human-induced global warming, yet we still don’t prepare for the inevitable annual floods, droughts and bushfires, let alone longer-term solar – and orbitally – driven global cooling.
We have a crisis of single-minded stupidity exacerbated by a dumbed-down education system supported by incessant propaganda, driven by financial interests and political activist authoritarianism.
BizNews TV interviewed Dr. John Christy last week as shown in the video above. For those who prefer to read what was said, I provide a lightly edited transcript below in italics with my bolds and added images. BN refers to questions from the interviewer and JC refers to responses from Christy.
BN: Joining me today is Dr John Christy, climate scientist at the University of Alabama in Huntsville and Alabama State climatologist since 2000. Dr Christy, thank you so much for your time. You’ve described yourself as a climate nerd and apparently you were 12 when your unwavering desire to understand weather and climate started. Why climate?
JC: Well I think it was more like 10 years old when I was fascinated with some unusual weather events that happened in my home area of California. So that began a fascination for me, and I wanted to try to figure out why things happen the way they did. Why did one year have more rain–that’s a big story in California, does it rain or not–and another year would be very dry. Why were the mountains covered with snow in one April and not another. In fact I have here April 1967 that I recorded as a teenager. This has been a passion of mine forever, and as it turns out now that I’m as old as I am, I still can’t figure out why one year is wetter than the other.
BN: Well you seem to be getting a lot closer than most people would. I think it was in 1989 when you and NASA scientist Roy Spencer pioneered a new method of measuring and monitoring temperature recordsvia satellites, since that time up until now. Why did you feel you needed to develop a new method to begin with, and how did it differ in terms of the readings of established methods at the time?
JC: Well the issue was we only had surface temperature measurements and they are scattered over the world. They don’t cover much of the world at all, actually mainly just the land regions and scattered places on the ocean. And the measurement itself is not that robust. The stations move, the instruments changed through time, and so it’s a very difficult thing to detect. In fact a small little change in the area right around the station can really affect the temperature of that station
So Roy Spencer and Dick Mcknight came up with an idea about looking at some satellite data. This is the temperature of the deep layer of the atmosphere, so this is like the surface to about 8000 meters. And so if we could see the temperature of that bulk atmospheric layer, we would have a very robust measurement, and the microwave sensors on the NOAA Polo orbiting satellites did precisely that. And so we were the first to really put those data into a simple data set that had the temperature, at that time, for month by month since about November 1978.
BN: Okay, and how do readings differ from the climate science at the time?
JC:First of all they differed because we had a global measurement. We really did see the entire Globe from satellite, because the orbit of that satellite is polar and the Earth spins around underneath. So every day we have 14 orbits as the Earth spins around underneath. We see the entire planet so that’s one big difference.
The other one is that the actual result did not show as much warming as what the surface temperatures showed. And we’re doing even more work now to demonstrate that a lot of the surface stations are spuriously affected by the growth of an infrastructure around them. And so there’s kind of a false warming signal there. You don’t get the background climate signal with surface temperature measurements; you get a bit of what’s happening in the local area.
BN: Your research has to do with testing the theories posited by climate model forecasts, so you don’t actually do any modeling yourself. But what criteria do you use to test these theories?
JC: That’s a very good question, because in climate you hear all kinds of claims and theories being thrown out there. For a lot of people who don’t really understand the climate system it’s a quick and easy answer just to say: Oh humans caused that, you know it’s global warming, something like that is the answer. When in fact the climate system is very complex, so we look at these claims and Roy Spencer and I are just a few of the people around the world that actually build data sets from scratch. I mean we start with the photon counts of the satellite radiometers, or the original paper records of 19th century East Africa, for example. We do all this from scratch so that we can test the claims that people make.
Once we build the data set, we test it to make sure we have confidence in the data set, that it’s telling us a truth about what’s happening over time. And then we check the claim. So for example, we make surface temperature data sets that go back to the 19th century. Someone will say: Well this is now the hottest decade, or that more records happen this decade than in the past. And we can demonstrate, in the United States especially, that’s not the case. You would need to go back to the 1930s if you want to see real record temperatures that occurred at that time.
And for climate models we like to use the satellite data set since it’s a robust deep layer measurement; it’s measuring lots of mass of the atmosphere, the heat content really. That’s a direct value we can get out of the climate model, so we are comparing Apples to Apples: What the satellite produces and observes is what the climate model also generates, and we can compare them one to one.
In a paper Ross McKitrick and I wrote a couple of years ago, we found that 100 of the climate models we’re warming the atmosphere faster than it was actually warming. So that’s not a good result if you’re trying to test your theory of how the climate works with the model against what actually happens.
BN: How much do you think the deeply over-exaggerated predictions of Doom and Gloom have to do with the methodology substantiated by confirmation bias?
JC: That’s an interesting question because we’re a bit confused as well. We have been publishing these papers since 1994 that have demonstrated models warm too much relative to the actual climate, and yet we don’t see an improvement in climate models and trying to match reality with their model output. Now I think a number of modelers understand that: yes the there is a difference there and the models are just too hot. But what is the process that’s gone wrong in the models is a difficult question for these folks. Because models have hundreds of places you can turn a little knob, change a coefficient, and that will change the result. It’s not a physical thing, it’s not based on physics; it’s the model parameterizations— the little pieces of the model that try to represent an actual part of the atmosphere. For example, when do clouds form? That’s a pretty big question. How much humidity in the atmosphere is required to create a cloud? Because once the cloud forms it reflects sunlight and cools the Earth. So that’s it that’s one of the big questions.
So in testing the models we like to use the bulk atmospheric temperature; it’d a very direct measurement that models produce and so we can then say there’s a problem here with climate models.
BN: To what degree did your observation on data differ from their forecasts?
Generally it’s about a factor of two. At times it’s been more, but on average the latest models (CMIP6) for the Deep layer of the atmosphere are warming about twice too fast, and that’s a real problem. I think when now we’re looking at over 40 years with which we can test these models, and they’re already that far off.
Figure 8: Warming in the tropical troposphere according to the CMIP6 models. Trends 1979–2014 (except the rightmost model, which is to 2007), for 20°N–20°S, 300–200 hPa.
So we should not use them to to tell us what’s going to happen in the future since they haven’t even gotten us to the right place in the last 40 years.
BN: Given that your real world data refuted what the forecasts were every time for decades, why then (and I recognize that this is conjecture) why are, let’s say, 97 or 99 % of scientists so firmly behind climate crisis narrative?
JC: Yeah I don’t know how many are really fully behind that crisis climate narrative. I saw a recent survey where about 55 percent might have been of the opinion that the climate warming was going to be a problem. Warming itself is not a problem: I mean the Earth has been warmer in the past than it is today, so the Earth has survived that before. And I don’t think putting extra plant food in the atmosphere is going to be a real problem for us to overcome. I do think the world is going to warm some from the extra CO2, but there are a lot of benefits that come from that.
You’re you’re dealing with a question about human nature and funding and so on. I think we all know that the more dramatic the story is, especially in the political world, the more attention you will get. Therefore your work can be highlighted and that helps you with funding and attention and so on. And part of what’s going on here. Then there’s the other real stronger political narrative: that there are groups and in the world political Elite that like to have a narrative that scares people, so that they can then offer a solution. And so it’s a simple way to say: elect me to this office and I will be able to solve this problem.
Then you are facing people like us who actually produce the data and we can report on extreme events and so on and say: Well you know there isn’t any change in these extreme events, so what’s the problem you’re trying to solve? And then we look at the other side of that issue and say: Okay if you actually implement this regulation or this law, it’s not going to make any difference on the climate end, so it’s a you kind of lose on two ends on that story.
BN: You’re a distinguished professor of atmospheric science and also director of Earth Sciences also at Alabama in Huntsville, these are prominent positions. How have you managed to hold on to them with climate views that are so divergent from the norm?
JC: Well the environment in the state of Alabama is different than what you have in Washington. I’m from California way across the country, and I tell people that one of the reasons I like to live in Alabama because in Alabama you can call a duck a duck; that you can just be direct about what’s going on and and you’re not going to be given the evil eye or cast out. As it is now in the climate establishment, you know, saying that all the models are warming too much and that there is not a disaster arising that causes great consternation.Because the narrative has been built over the last 30 years that we are supposed to be in a catastrophe. To come out and say, well here’s the data and the data show there is no catastrophe looming; we’re doing fine, the world is doing fine, human life is thriving in places it’s allowed to. So what’s the problem here you’re trying to solve.
BN:Did you ever manage to get your findings to policy makers that have influence to do something about it?
[An important proof against the CO2 global warming claim was included in John Christy’s testimony 29 March 2017 at the House Committee on Science, Space and Technology. The text and diagram below are from that document which can be accessed here.
IPCC Assessment Reports show that the IPCC climate models performed best versus observations when they did not include extra GHGs and this result can be demonstrated with a statistical model as well.
Figure 5. Simplification of IPCC AR5 shown above in Fig. 4. The colored lines represent the range of results for the models and observations. The trends here represent trends at different levels of the tropical atmosphere from the surface up to 50,000 ft. The gray lines are the bounds for the range of observations, the blue for the range of IPCC model results without extra GHGs and the red for IPCC model results with extra GHGs.The key point displayed is the lack of overlap between the GHG model results (red) and the observations (gray). The nonGHG model runs (blue) overlap the observations almost completely.
JC: Well, I’ve been to Congress 20 times, testified before hearings. So the information is there and available, but I can’t force Congress to make legislation that matches the real world. The Congressional world is a political world, and things happen there that are kind of out of my reach and ability to influence.
BN: According to your research, you’ve also said that the climate models underestimate negative feedback loops. Can you explain to me what is this mechanism and the effect of overestimation of the loops on understanding climate for what it is?
JC: That’s a very complicated issue, and I don’t understand it all for sure, but we can say just from some general results and general observation what’s going on here. One of those General observations is that when a climate model warms up the atmosphere one degree Kelvin, it sends out 1.4 watts per metersquared so the air atmosphere warms up and energy escapes to space 1.4 watts. When we use actual observations of the atmosphere, when the real atmosphere warms up one Kelvin it sends out 2.6 watts of energy. That’s almost twice as much so that tells you right there that the climate models are retaining or holding on to energy that the real world allows to escape when it warms. So that’s a negative feedback: as the atmosphere warms for a bit the real real world knows how to let that heat escape; whereas the models don’t and they retain it and that’s why they keep building up heat over time.
BN: What other variables do you look at?
JC: The state climatologists I deal a lot get very practical questions that people ask. They want to know: is it getting hot or is it getting wetter. Are rain storms getting heavier and are the Hurricanes getting worse and so on. I actually wrote a booklet called a practical guide to climate change in Alabama. But it covers a lot of the country as well. It’s free, you can download it from the first page of my website The Alabama State climatologist. I answer a lot of these very practical questions and as we go down the list: droughts are not getting worse over time, heavy rainstorms are not getting worse over time, here in the Southeast in fact. Ross McKitrick and I also had a paper where we went back to 1878 and demonstrated that the trends are not significant. Hurricanes are not going up at all; in fact 2022 is going to be one of the quietest that we’ve had in a while. Tornadoes are not becoming more numerous, heat waves are not becoming worse. So one after another, the weather that people really care about, that if it changes could cause problem or catastrophe, we find those events are not changing, they’ve always been around.[Title below in red is link to Christy’s booklet.]
BN: Some of the biggest critics of climate skeptics say: okay yeah it’s not fair one extreme weather event doesn’t say much, but they argue that there are very particular trends that have been on the increase. Recently have you observed this at all?
JC: That’s exactly the kind of thing we build data sets to discover. For example there is a story, and there is some evidence for it, that in the last hundred years there’s been an increase in in heavy rain events in part of our country, not all of it just part of the country. So I built a data set that went back in fact back to the 1860s. And we looked at that very carefully, and found that when you go back far enough, there were a lot of heavy events back then. And so over the long time period of 140 years or more we don’t see an upward trend. It’s unusual in that sample of time 140 years that we don’t see a change in those kind of events. So that’s why I think it has great value to build these data sets so you can specifically answer the question and the claim that is being made
One of the worst ones was made by the New York Times when they were talking about how many record high temperatures occurred in a recent heat wave around the country. So I looked at that carefully, and they were allowing stations to be included that only had 30 years or even less than 30 years of data. Some had a hundred years but a lot of them just had 30 years. Well when you become very systematic, you say: I’m only going to allow stations that have a hundred years so that every station that measured in 2022 can be compared with the entire time series. Then their story falls apart because the 1930s and the 50s were so hot in our country that they still hold the records for the number of high temperature events.
The scary thing for me is that as much as it completely falls apart, there’s no logic to it,
yet it’s still firmly stands as what most people believe.
You have to credit those in the climate establishment and the media or whoever is behind all this, that they have been successful in scaring people about the climate. Because now you find that even in grade school textbooks. Almost every new story that comes out, and this is where this establishment is very good, they make sure every story has some kind of line in it about climate change. They don’t ever go back and talk to someone who actually builds these data sets who says is that really the worst it’s been was 120 years ago. They just make those claims.
Other than the fact that sea level is rising a bit, the extreme events are just not there to really cause problems now. We are in a problem of having greater damages occur because of extreme events, and mainly because we’ve just built so much more stuff and placed It In harm’s way. Our coastlines are crowded with Condominiums, entertainment parks and retirement villages, and so on. There’s so many more of them that when a hurricane does come, it’s going to wipe out a lot more and so for the absolute value of those damages has gone up. But the number of hurricanes, their strength and so on, the background climate has not caused that problem. It’s just that we like to build things in places that are dangerous.
We have records of sea level rise, and it’s on the order of about an inch per decade, except in places where the land’s sinking. You can find that on the Louisiana Gulf Coast and places like that, but otherwise it’s about an inch per decade. I tell folks that an inch per decade, two and a half centimeters a decade is not your problem. It’s 10 feet in six hours from the next hurricane that’s your problem. If you can withstand a rise of sea level of 10 feet in six hours then you’re probably going to be okay. But if you can’t then a hurricane can really cause problems, and so we just have more exposure to that kind of his situation now than we’ve had before.
BN: What about the trend with sea level rise? Should we be worried about future Generations having to deal with issues that might not affect us in our lifetime but eventually will threaten their lives?
I think your listeners would need to understand that sea level is a dynamic variable–It goes up, it goes down. It has been over a hundred meters lower than today just in the last 25,000 years, and there was a period from about 15 000 years ago to 8 000 years ago where the sea level rose about 12 centimeters per decade for seven thousand years. That’s a lot more than two and a half centimeters a decade as it’s doing now, so the world has managed to deal with rising sea levels before. If we go back to the last warm period about 130 000 years ago, the sea level then was higher than it is now by about five meters or so. So just naturally we would expect at least another five meters of sea level; it won’t happen tomorrow, it won’t happen this Century. But slowly it will likely continue to rise and so that should be placed in your thinking if you’re building a dock for say a military port or something you want to last a long time. Put a cushion in there, a way to handle another half meter of seat level rise in the next hundred years, and you should be okay.
BN: About your temperature records: How much has the Earth warmed let’s say over the last four years?
JC: Yes. With this November we finished 43 years of measurements. In that time the temperature has risen half a degree Celsius. And you might want to look at other things about the world. World agricultural production has expanded tremendously. Nations are now exporting grain more than they had before, because people are pretty smart and figure out how to do things better all the time. Growing food is one thing they figured out how to do better as time passed, so the climate warming of a half degree has not caused a a major catastrophe at all. Wealth has increased around the planet, now some governments are trying to prevent you from growing your wealth, but that’s a hard thing to stop people who like to have food; they like to have conveniences in their life and that’s hard to pass laws that say you can’t enjoy the life the way you want to.
BN:How much of the warming are you reliably able to say is as a result of human activity?
JC: Okay. The answer is none in the sense that you said reliably. I can’t come up with an answer for that reliably. Warming from humans assumes warming that is not due to El Nino; or warming that’s not due to volcanic suppression of temperatures earlier in the record, which comes up to about a tenth of a degree per decade.
Are there other factors that we can say for sure have played a role in the incremental warming of the planet over the last few decades. We see that we’ve had a couple of volcanoes in the first half of that period Eyjafjallajökull and Pinatubo and those cool the planet in the first half of that 40 years. So that tilted the trend up and that’s where I come up with a one-tenth per decade is the warming rate, which means the climate is not very sensitive to carbon dioxide or greenhouse gas warming. It’s probably half or even less as sensitive as models tend to report.
BN: So if CO2 exposure or insertion into the atmosphere were to double what would the results be?
JC: I actually had a little paper on that and we’re kind of expecting maybe about 2070 or 2080 it will be double from what it was back in 1850. And the warming of that amount uh will be about a degree, 1.3 C is what I calculated. The general rule I found about people is they don’t mind an extra degree on their temperature. In fact if you look at the United States the average American experiences a much warmer temperature now than they did a hundred years ago. Because the average American has moved South; the average American has moved to much warmer climates–California, Arizona Texas, Alabama, Florida and so on. Because cold is not a whole lot of fun. You know, skiing, snowmobiling and ice fishing and so on, that’s fine. But the average person likes it to be warm and so that’s why many people in our country have moved to warmer areas. So I don’t think that 1.3 Kelvin is going to matter much whether people really care about those extreme events and so on.
BN: What do you your temperature records tell you about previous hotter temperatures?
JC: Since 1979, what we see is an upward trend in the in the global temperature that I think is manageable. But it goes up and down the 1997-98 El Nino was a big event and in 2016 El Nino was a big event. We also see the downs that come from a volcano that might go off and cool off the planet. Those are bigger effects than that small trend that’s going up. The global temperature can change by two tenths of a degree from month to month when we’re talking about a tenth per decade. Then people say, you know a month to month we can handle but we can’t handle 20 years worth of a small change. That just doesn’t make sense and and the real world evidence is pretty clear that that humans have done extremely well as our planet has been warming a little bit, whether it’s natural or not.
BN: Can you tell me about the Milankovich Cycles?
Milankovich Cycles are the orbital cycles of the earth orbit around the Sun and its tilt of the axis and the distance from the Sun. It is not a perfect circular orbit around the sun, it’s kind of an ellipse and it changes through time. All those factors work together to put a little bit more solar energy in certain places and less than others. These cycles are likely related to the Ice Ages we talk about.
If you can melt the snow in Canada in the summer, then you won’t have an ice age. So the snow falls in the winter and if you can’t melt the snow in Canada in the summer because the Earth is tilted away a bit in July and August. Then the snow hangs around all summer long, the next winter more snow that piles up the next summer it doesn’t melt and so on the next year. You get this mechanism that adds and extends snow cover leading to an ice age
So the tilt of the axis and other parameters I just mentioned can moderate how much sunlight comes in the summertime in Canada. And it’s up to 100 watts per meter squared which is a lot of energy difference over time. That’s probably the strongest theory that has a good amount of evidence that those orbital changes can cause huge changes in the climate from ice ages to the current interglacial.
BN: There’s claims that the way that humans are living is causing daily Extinction of two to three hundred different species. Is this a natural course of Evolution?
JC: You know 99 % of the species that have ever lived are extinct, so extinction is is pretty natural. Obviously humans cause some extinctions. When you destroy the environment of a small place and that was the only place that particular species lived then yes you know humans caused that extinction Did climate change from humans cause any extinctions? I think that jury is still out because most species love the extra carbon dioxide. Plants do specifically and then everything that eats plants loves that, so you might want to say the extra carbon dioxide actually helped in some sense the whole biosphere.
But I think that what humans do to the surface and to water, if it’s not clean properly and if you just really poison the surface in the air, then that can cause some real problems for the species that are living out there. And that’s why we have rules about not putting poison in air or in the water.
BN: Does that qualify as climate change?
JC: No. To say carbon dioxide is a poison, you really have to scratch your head on that because plants love the stuff. It invigorates the biosphere. When did all of this Greenery evolve and the corals occur and grow and develop? it was when there was two to four or five times as much CO2 as is in the air now. Carbon dioxide invigorates the biosphere, so we’re just actually putting back carbon dioxide that had been in the atmosphere earlier. And I don’t think the world is going to have much problem with that in terms of its biosphere. The issue is about the climate going to become so bad that some things can’t handle it and I don’t really see the evidence for that happening.
BN: Critics of your views on climate have argued that you undercut your credibility by making claims that exceed your data and that you’re unwilling to agree with different findings. How do you respond to that?
JC: Show me a finding and let me look at it and if it’s a valid finding, fine I’ll agree with it. But you know you can find anything on the web these days about claims that someone might make but you show me the evidence. Let me see what you’re complaining about and we can have a discussion about that. I just had a paper published last week on snowfall in the western states of the United States that shows for the main snowfall regions there is no trend in snowfall. The amount of snow that’s falling right now is the same as it was 120 years ago. So snow is still falling out in the western mountains of the United States–that’s evidence, that’s data. And so when someone claims that oh my, snowfall is going away out in the west, I said well well here look at this evidence from real station data that people recorded back in 1890 to now.
So I can answer that question with real information. You don’t see many people like me in debates because they’re not offered to me. In fact I’ve been uninvited you know. Someone on a particular panel would say hey let’s get this guy to come here and speak to us, and then I receive the disinvitation because I was not going to go along with the theme of their climate change as a catastrophe presentation
BN: You referred to times in the past that CO2 levels were significantly higher than they are now. Do records show any negative effects as a result of such high CO2?
JC: Well when you say negative, that’s almost a moral question: good or bad that the dinosaurs went extinct? I think they’d the dinosaurs would have an opinion about that. Let me rephrase: If it had to be on those levels today would it negatively impact Humanity? We see carbon dioxide has increased as humans are producing energy so that their lives can be enhanced. There’s a direct relationship between how much carbon or energy you’re able to use and carbon is the main source today and your ability to thrive.
Think about it we didn’t leave the Stone Age because we ran out of rocks. We left the Stone Age because something better came along, you know, Iron, Bronze and so on. In terms of energy we didn’t leave the wood and dung age because we ran out of trees or excrement, we found a better source that was carbon: coal, oil and so on. And transportation: we didn’t leave the horse and buggy age because we ran out of horses. It was because Henry Ford made a vehicle that was cheap and affordable. My great grandfather who was in destitute poverty in Oklahoma in the 1930s had a Model T. And another thing about Henry Ford: He didn’t go around getting the government to kill all the horses so you’d have to buy his cars. Horses were still available for the poorest people you know. And he didn’t make the government go out and build gas stations or drill for oil, that was done at the market for the private level.
But today we have a government that says this is what we want for the energy structure, and so we’re going to be using your taxpayer money to put out all these charging stations and force you to buy electric cars or at least subsidize them tremendously, and put up all these windmills and so on at Great expense and great environmental wreckage.
I can assure you that without energy life is brutal and short, and so energy is a thing that has caused our lifespans to double so that children no longer fear about diseases that used to wipe out Millions. Because of the advances that energy has brought through electricity and experimentation and all the sciences that we have developed now. All that’s based upon that access to energy.
So yes developing countries are going to get their energy, they’re going to find the energy they need. I’m not making this as a prediction, just using this as an observation. Right now it’s carbon that’s the cheapest and most effective and very high density. So we will see these countries use carbon to advance and we should not stand in their way. Because they want to live like us who already have pretty big carbon Footprints.
If you want to have some comfort in that, remember the carbon dioxide we’re putting back into the atmosphere is invigorating the biosphere and it also represents people living longer and better lives. Just no question that as energy is made available and affordable people live longer and better lives. I think that’s going to ultimately be the the inertia that’s going to carry forward this issue past all the preaching about carbon dioxide problems.
Environmentalists would argue that they’re not against electricity and prosperity, they’re just advocating for a better cleaner way to do it. It’s a tremendous misconception that a windmill or a solar panel can somehow give you cleaner and more reliable energy than what you have now. That’s just not true. To build a windmill, there’s tremendous environmental wreckage that you have to go through in terms of all the minerals you have to yank out of the earth and process. And processing takes energy by the way. And then building all these transmission lines. The energy is so diffuse, it is so weak in wind and solar that you have to gather up huge amounts of land to put it together. Robert Price said it well when he called it the iron law of power: the weaker the source of energy the more stuff and material you need to gather it, to concentrate it and to make it useful.
You have to spend huge amounts of dollars in environmental cost to make a windmill or make a solar panel, which by the way doesn’t last forever. So this carbon that already has a tremendous amount of energy in a very small dense space means that its environmental footprint is much much smaller than what you have with solar or wind. In fact it’s about one to a thousand or two thousand in terms of the square footage you need.
Look at windmill and solar panel farms. Not only are they just ugly but they cause tremendous environmental damage in their construction and maintenance. What are the long-term effects decades from now? If we just continue to get our energy from fossil fuels how bad can it get?
Well start with how good it can get. People will have access to affordable energy so they’re going to live longer and they’re going to live better lives when you have access to this. The impact on the climate is about the only thing you can think of. Well the sea level is going to continue to rise since it’s been rising for several hundred years, and at a manageable rate by the way. And the atmosphere might warm some more, but certainly not in terms of some catastrophic effect that will cause us to lose our ability to thrive.
I’m just very optimistic that people are clever and they can figure out how to adapt to whatever is going to happen. The real issues I deal with as a state climatologist are the extreme events that we know are going to happen that you’re not ready for. I mean that flood that happened 50 years ago is going to come back again. And it’s going to cause some real problems if you don’t build your infrastructure and put your houses or industry where they can be safe. If you don’t build up on the coast too much, so then you won’t be clobbered by a hurricane or something like that. It’s these kind of natural extreme events to which we’re far more vulnerable right now, rather than some small and gradual change that the climate system might undergo.
BN: I did read somewhere that someone has said, and I’m sure you must get it a lot, whether you get any funding from the fossil fuel industry. Do you?
JC: No I do not, and I made that decision way back in the early 1990s. I might make a fossil fuel company mad by some of them information I would produce, but so be it. I can put my head to bed at night and not be worried about: Did I accommodate some agenda somewhere? I’m just after what observations say. Can I build the best observational data sets to answer the questions of climate that we have, and that’s what I want to do.
BN: I suppose one of the biggest tragedies about it would be that it would discredit the real science and the fundamental research that you’re doing. Just that it’ll be a non-starter because people will immediately dismiss it.
JC: That’s unfortunate because the perception then is that, well if a fossil fuel company paid someone to do some research they really wanted to know the answer about something and this person was completely honest did the work properly and provided the answer to the fossil fuel companies is as. Well that answer would be tainted because it came from a fossil fuel company. Well hello: Think about what environmental advocacy groups and pressure groups do all of the time. They pay tremendous sums to people so they can come up with an answer that gives them their leverage in claiming this is a catastrophic problem. So I can at least take that perception off the table.
BN: Lastly are you aware of any ways in which geoengineering could possibly be affecting the natural balance of things? Is it being done more than we’re aware of and could it backfire?
JC: Anytime humansdo something they’re going to have an impact, no question about that. So you could call it geoengineering but inadvertently we have made some desert valleys cooler because now we irrigate crops. We have taken water that fell someplace and moved it to another place. So that’s a bit of geoengineering there. And by the way a lot of those places feed a lot of the world, so you can’t say it’s bad I suppose.
But the other question about geoengineering is:
Can we do something to prevent a perceived problem here?
And that’s the real danger I think, because you don’t know the consequences when you start tinkering with a very complex and dynamic system. And so I would say stay away from that. Suppose someone did a big geoengineering experiment and something bad happened somewhere. Well that country would sue the world and say: look you made this bad thing happen to us you are liable. And so then we’re getting nowhere in terms of preventing some problem on the planet.
The diagram at the top shows how grateful we should be for living in today’s climate instead of a glacial icehouse. (H/T Raymond Inauen) For most of its history Earth has been frozen rather than the mostly green place it is today. And the reference is to the extent of the North American ice sheet during the Last Glacial Maximum (LGM).
To see this geologically recent glacial period in perspective, consider the maps created by paleo climatologist Christopher Scotese, leader of the Paleomap Project.
The animation below shows how the planet surface changed over the past millions of years (Ma means Millions of years Ago).
Note that in 66 Ma Earth was a “hothouse” with little ice and green polar land masses. By 50 Ma cooling resulted in polar ice caps and glaciers. By 14 Ma both Greenland and Antarctica are ice covered. 18Ka a severe “icehouse” world is evidenced by the Laurentian icecap. Then the Modern world appears with the ice retreating, but still covering the two poles. Continental drifts are also shown by India starting as an island and later joining Asia, and by Africa isolated but later approaching Europe.
For further context consider that geologists refer to our time as a “Severe Icehouse World”, among the various conditions in earth’s history, as diagramed below by Christopher Scotese. Referring to the Global Mean Temperatures, it appears after many decades, we are slowly rising to “Icehouse World”, which would seem to be a good thing.
As of 2015 earth is showing a GMT of 14.4C, compared to pre-industrial GMT of 13.8C. According to the best geological evidence from millions of years of earth’s history, that puts us in the category “Severe Icehouse.” So, thankfully we are warming up, albeit very slowly. Moreover, progress toward a warming world means flattening the profile at the higher latitudes, especially the Arctic. Equatorial locations remain at 23C throughout the millennia, while the gradient decreases in a warmer world.
We have many, many centuries to go before the earth can warm up to the “Greenhouse” profile, let alone get to “Hothouse.” Regional and local climates at higher latitudes will see slightly warming temperatures and smaller differences from equatorial climates. These are facts based on solid geological evidence, not opinions or estimates from computer models.
It is still a very cold world, but we are moving in the right direction. Stay the course.
Instead of fear mongering over a bit of warming, we should celebrate our good fortune, and do our best for humanity and the biosphere. Matthew Ridley takes it from there in a previous post.
Background from previous post The Goodness of Global Warming
LAI refers to Leaf Area Index.
As noted in other posts here, warming comes and goes and a cooling period may now be ensuing. See No Global Warming, Chilly January Land and Sea. Matt Ridley provides a concise and clear argument to celebrate any warming that comes to our world in his Spiked article Why global warming is good for us. Excerpts in italics with my bolds and added images.
Climate change is creating a greener, safer planet.
Global warming is real. It is also – so far – mostly beneficial. This startling fact is kept from the public by a determined effort on the part of alarmists and their media allies who are determined to use the language of crisis and emergency. The goal of Net Zero emissions in the UK by 2050 is controversial enough as a policy because of the pain it is causing. But what if that pain is all to prevent something that is not doing net harm?
The biggest benefit of emissions is global greening, the increase year after year of green vegetation on the land surface of the planet. Forests grow more thickly, grasslands more richly and scrub more rapidly. This has been measured using satellites and on-the-ground recording of plant-growth rates. It is happening in all habitats, from tundra to rainforest. In the four decades since 1982, as Bjorn Lomborg points out, NASA data show that global greening has added 618,000 square kilometres of extra green leaves each year, equivalent to three Great Britains. You read that right: every year there’s more greenery on the planet to the extent of three Britains. I bet Greta Thunberg did not tell you that.
The cause of this greening? Although tree planting, natural reforestation, slightly longer growing seasons and a bit more rain all contribute, the big cause is something else. All studies agree that by far the largest contributor to global greening – responsible for roughly half the effect – is the extra carbon dioxide in the air. In 40 years, the proportion of the atmosphere that is CO2 has gone from 0.034 per cent to 0.041 per cent. That may seem a small change but, with more ‘food’ in the air, plants don’t need to lose as much water through their pores (‘stomata’) to acquire a given amount of carbon. So dry areas, like the Sahel region of Africa, are seeing some of the biggest improvements in greenery. Since this is one of the poorest places on the planet, it is good news that there is more food for people, goats and wildlife.
But because good news is no news, green pressure groups and environmental correspondents in the media prefer to ignore global greening. Astonishingly, it merited no mentions on the BBC’s recent Green Planet series, despite the name. Or, if it is mentioned, the media point to studies suggesting greening may soon cease. These studies are based on questionable models, not data (because data show the effect continuing at the same pace). On the very few occasions when the BBC has mentioned global greening it is always accompanied by a health warning in case any viewer might glimpse a silver lining to climate change – for example, ‘extra foliage helps slow climate change, but researchers warn this will be offset by rising temperatures’.
Another bit of good news is on deaths. We’re against them, right? A recent study shows that rising temperatures have resulted in half a million fewer deaths in Britain over the past two decades. That is because cold weather kills about ’20 times as many people as hot weather’, according to the study, which analyses ‘over 74million deaths in 384 locations across 13 countries’. This is especially true in a temperate place like Britain, where summer days are rarely hot enough to kill. So global warming and the unrelated phenomenon of urban warming relative to rural areas, caused by the retention of heat by buildings plus energy use, are both preventing premature deaths on a huge scale.
Summer temperatures in the US are changing at half the rate of winter temperatures and daytimes are warming 20 per cent slower than nighttimes. A similar pattern is seen in most countries. Tropical nations are mostly experiencing very slow, almost undetectable daytime warming (outside cities), while Arctic nations are seeing quite rapid change, especially in winter and at night. Alarmists love to talk about polar amplification of average climate change, but they usually omit its inevitable flip side: that tropical temperatures (where most poor people live) are changing more slowly than the average.
My Mind is Made Up, Don’t Confuse Me with the Facts. H/T Bjorn Lomborg, WUWT
But are we not told to expect more volatile weather as a result of climate change? It is certainly assumed that we should. Yet there’s no evidence to suggest weather volatility is increasing and no good theory to suggest it will. The decreasing temperature differential between the tropics and the Arctic may actually diminish the volatility of weather a little.
Indeed, as the Intergovernmental Panel on Climate Change (IPCC) repeatedly confirms, there is no clear pattern of storms growing in either frequency or ferocity, droughts are decreasing slightly and floods are getting worse only where land-use changes (like deforestation or building houses on flood plains) create a problem. Globally, deaths from droughts, floods and storms are down by about 98 per cent over the past 100 years – not because weather is less dangerous but because shelter, transport and communication (which are mostly the products of the fossil-fuel economy) have dramatically improved people’s ability to survive such natural disasters.
The effect of today’s warming (and greening) on farming is, on average, positive: crops can be grown farther north and for longer seasons and rainfall is slightly heavier in dry regions. We are feeding over seven billion people today much more easily than we fed three billion in the 1960s, and from a similar acreage of farmland. Global cereal production is on course to break its record this year, for the sixth time in 10 years.
Nature, too, will do generally better in a warming world. There are more species in warmer climates, so more new birds and insects are arriving to breed in southern England than are disappearing from northern Scotland. Warmer means wetter, too: 9,000 years ago, when the climate was warmer than today, the Sahara was green. Alarmists like to imply that concern about climate change goes hand in hand with concern about nature generally. But this is belied by the evidence. Climate policies often harm wildlife:biofuels compete for land with agriculture, eroding the benefits of improved agricultural productivity and increasing pressure on wild land; wind farms kill birds and bats; and the reckless planting of alien sitka spruce trees turns diverse moorland into dark monoculture.
Meanwhile, real environmental issues are ignored or neglected because of the obsession with climate. With the help of local volunteers I have been fighting to protect the red squirrel in Northumberland for years. The government does literally nothing to help us, while it pours money into grants for studying the most far-fetched and minuscule possible climate-change impacts. Invasive alien species are the main cause of species extinction worldwide (like grey squirrels driving the red to the margins), whereas climate change has yet to be shown to have caused a single species to die out altogether anywhere.
Of course, climate change does and will bring problems as well as benefits. Rapid sea-level rise could be catastrophic. But whereas the sea level shot up between 10,000 and 8,000 years ago, rising by about 60 metres in two millennia, or roughly three metres per century, todaythe change is nine times slower: three millimetres a year, or a foot per century, and with not much sign of acceleration. Countries like the Netherlands and Vietnam show that it is possible to gain land from the sea even in a world where sea levels are rising. The land area of the planet is actually increasing, not shrinking, thanks to siltation and reclamation.
Environmentalists don’t get donations or invitations to appear on the telly if they say moderate things. To stand up and pronounce that ‘climate change is real and needs to be tackled, but it’s not happening very fast and other environmental issues are more urgent’ would be about as popular as an MP in Oliver Cromwell’s parliament declaring, ‘The evidence for God is looking a bit weak, and I’m not so very sure that fornication really is a sin’. And I speak as someone who has made several speeches on climate in parliament.
No wonder we don’t hear about the good news on climate change.

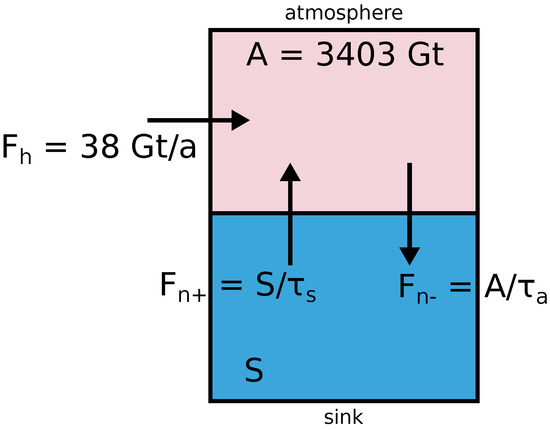
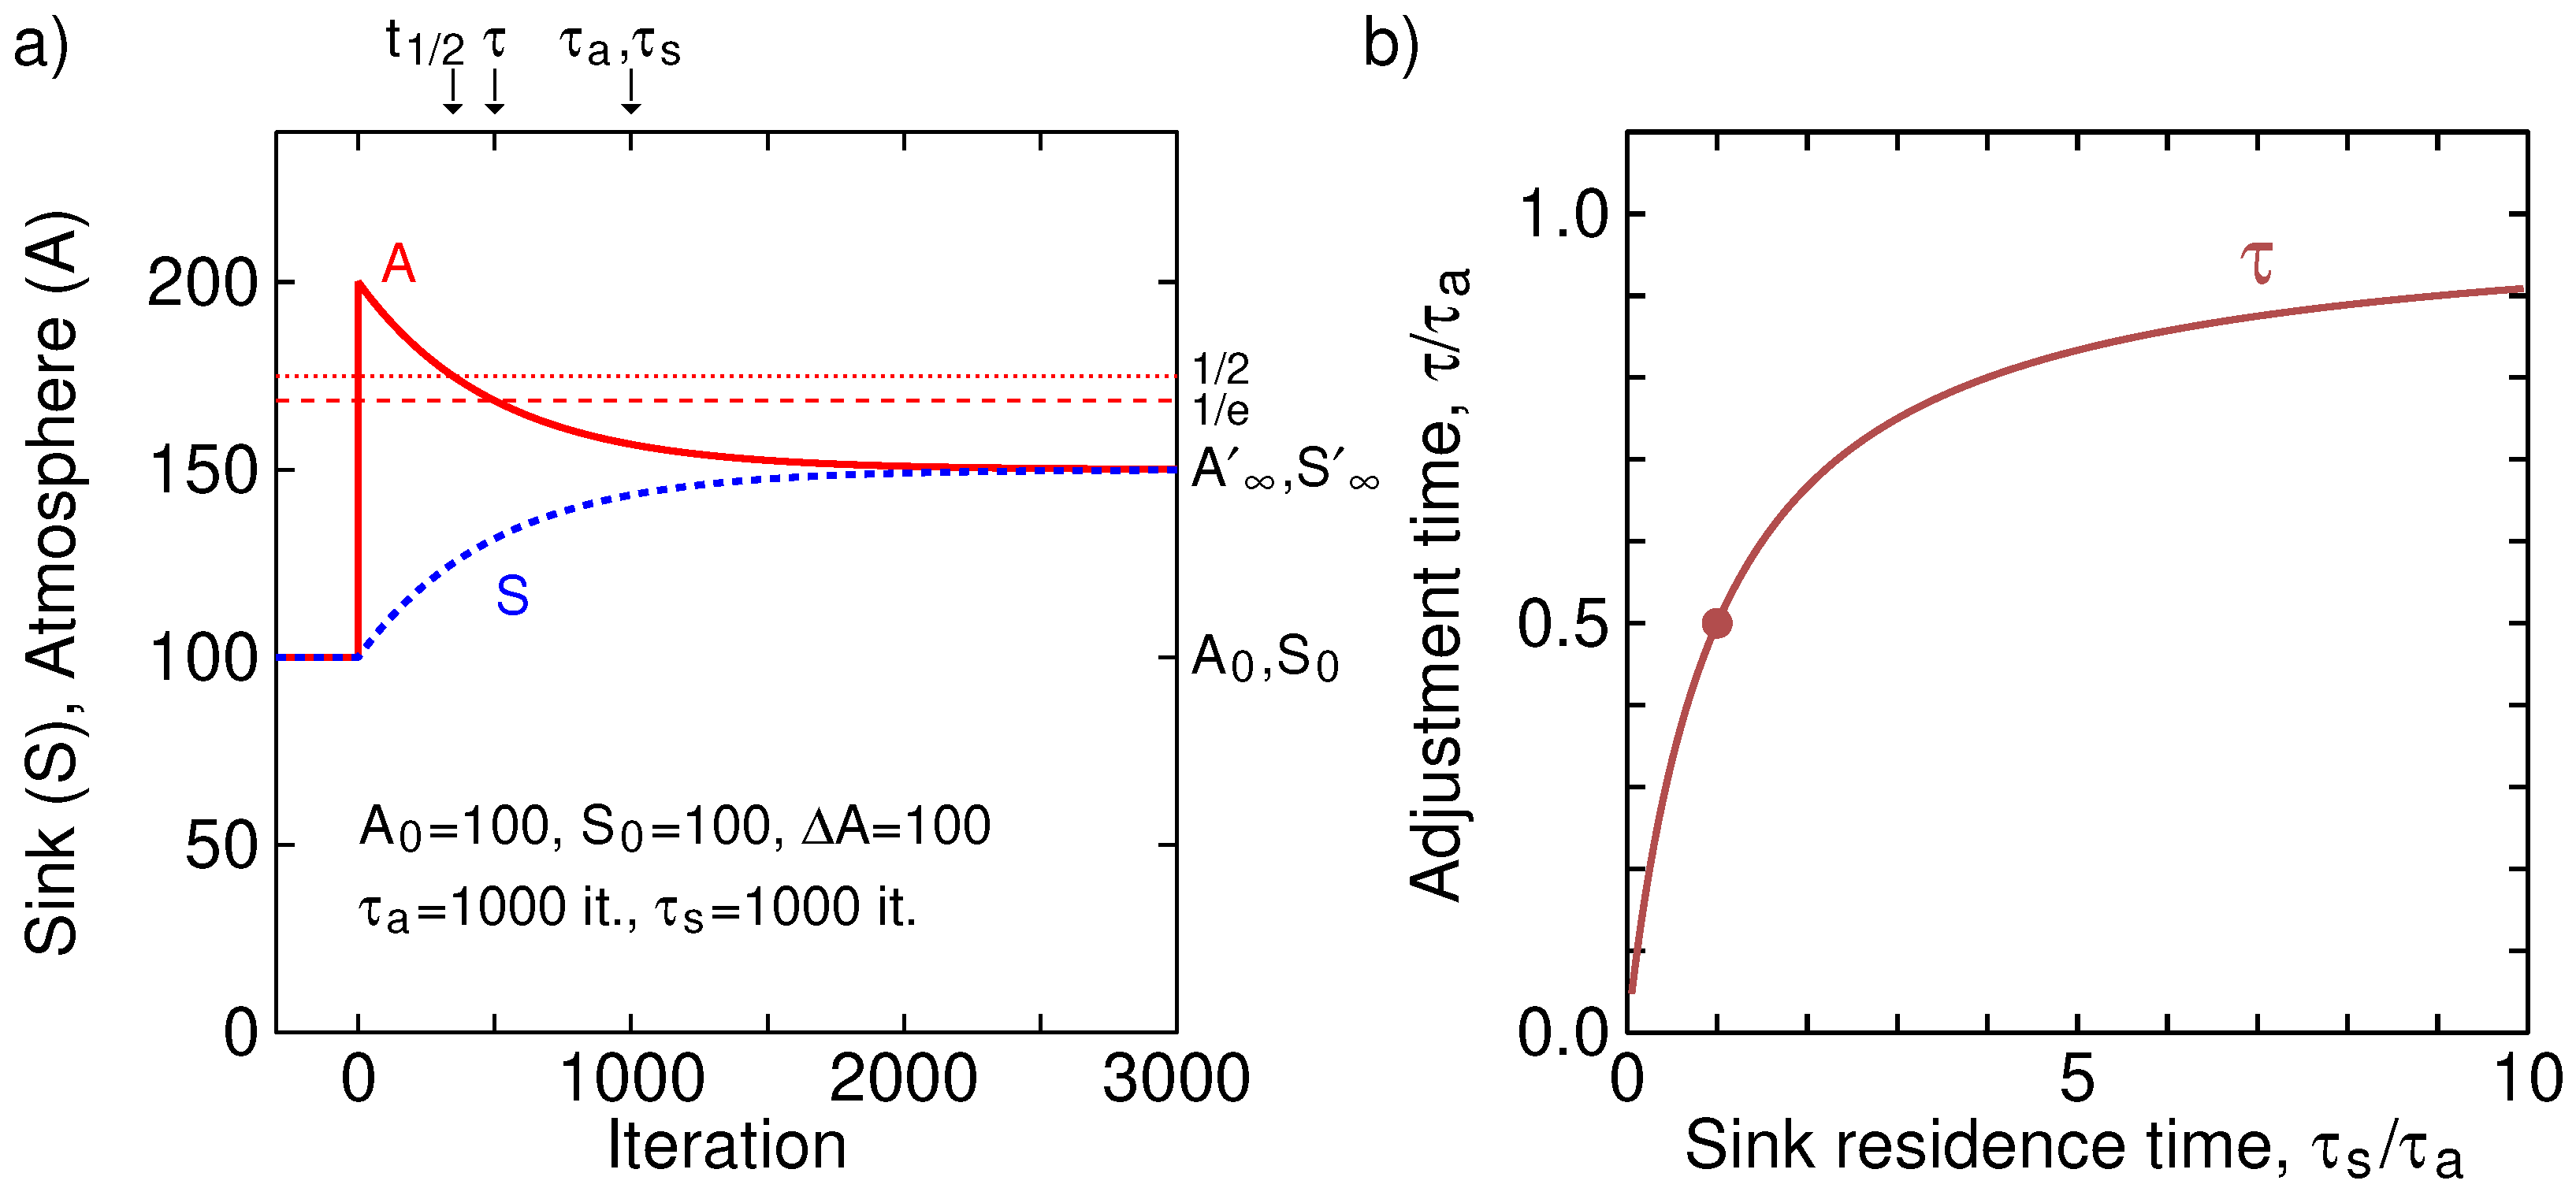

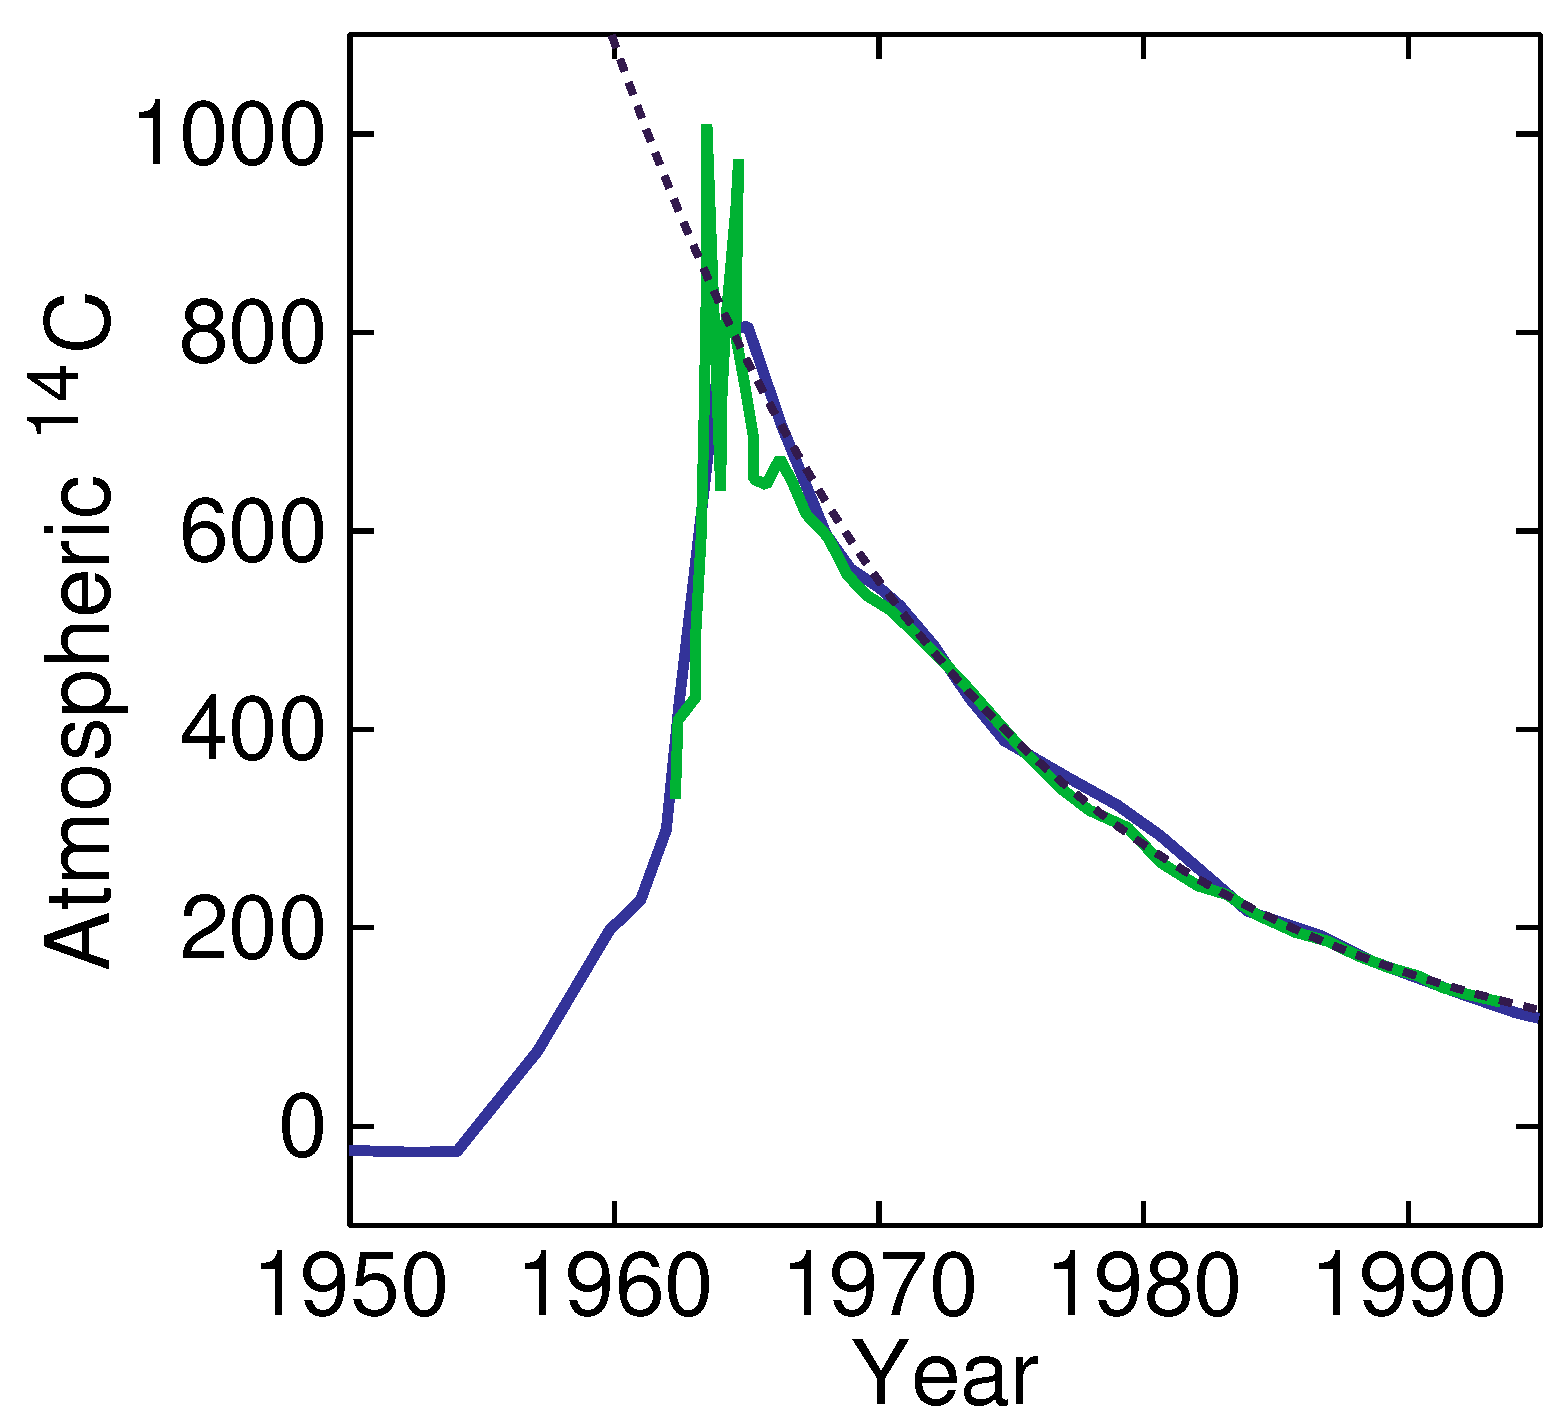

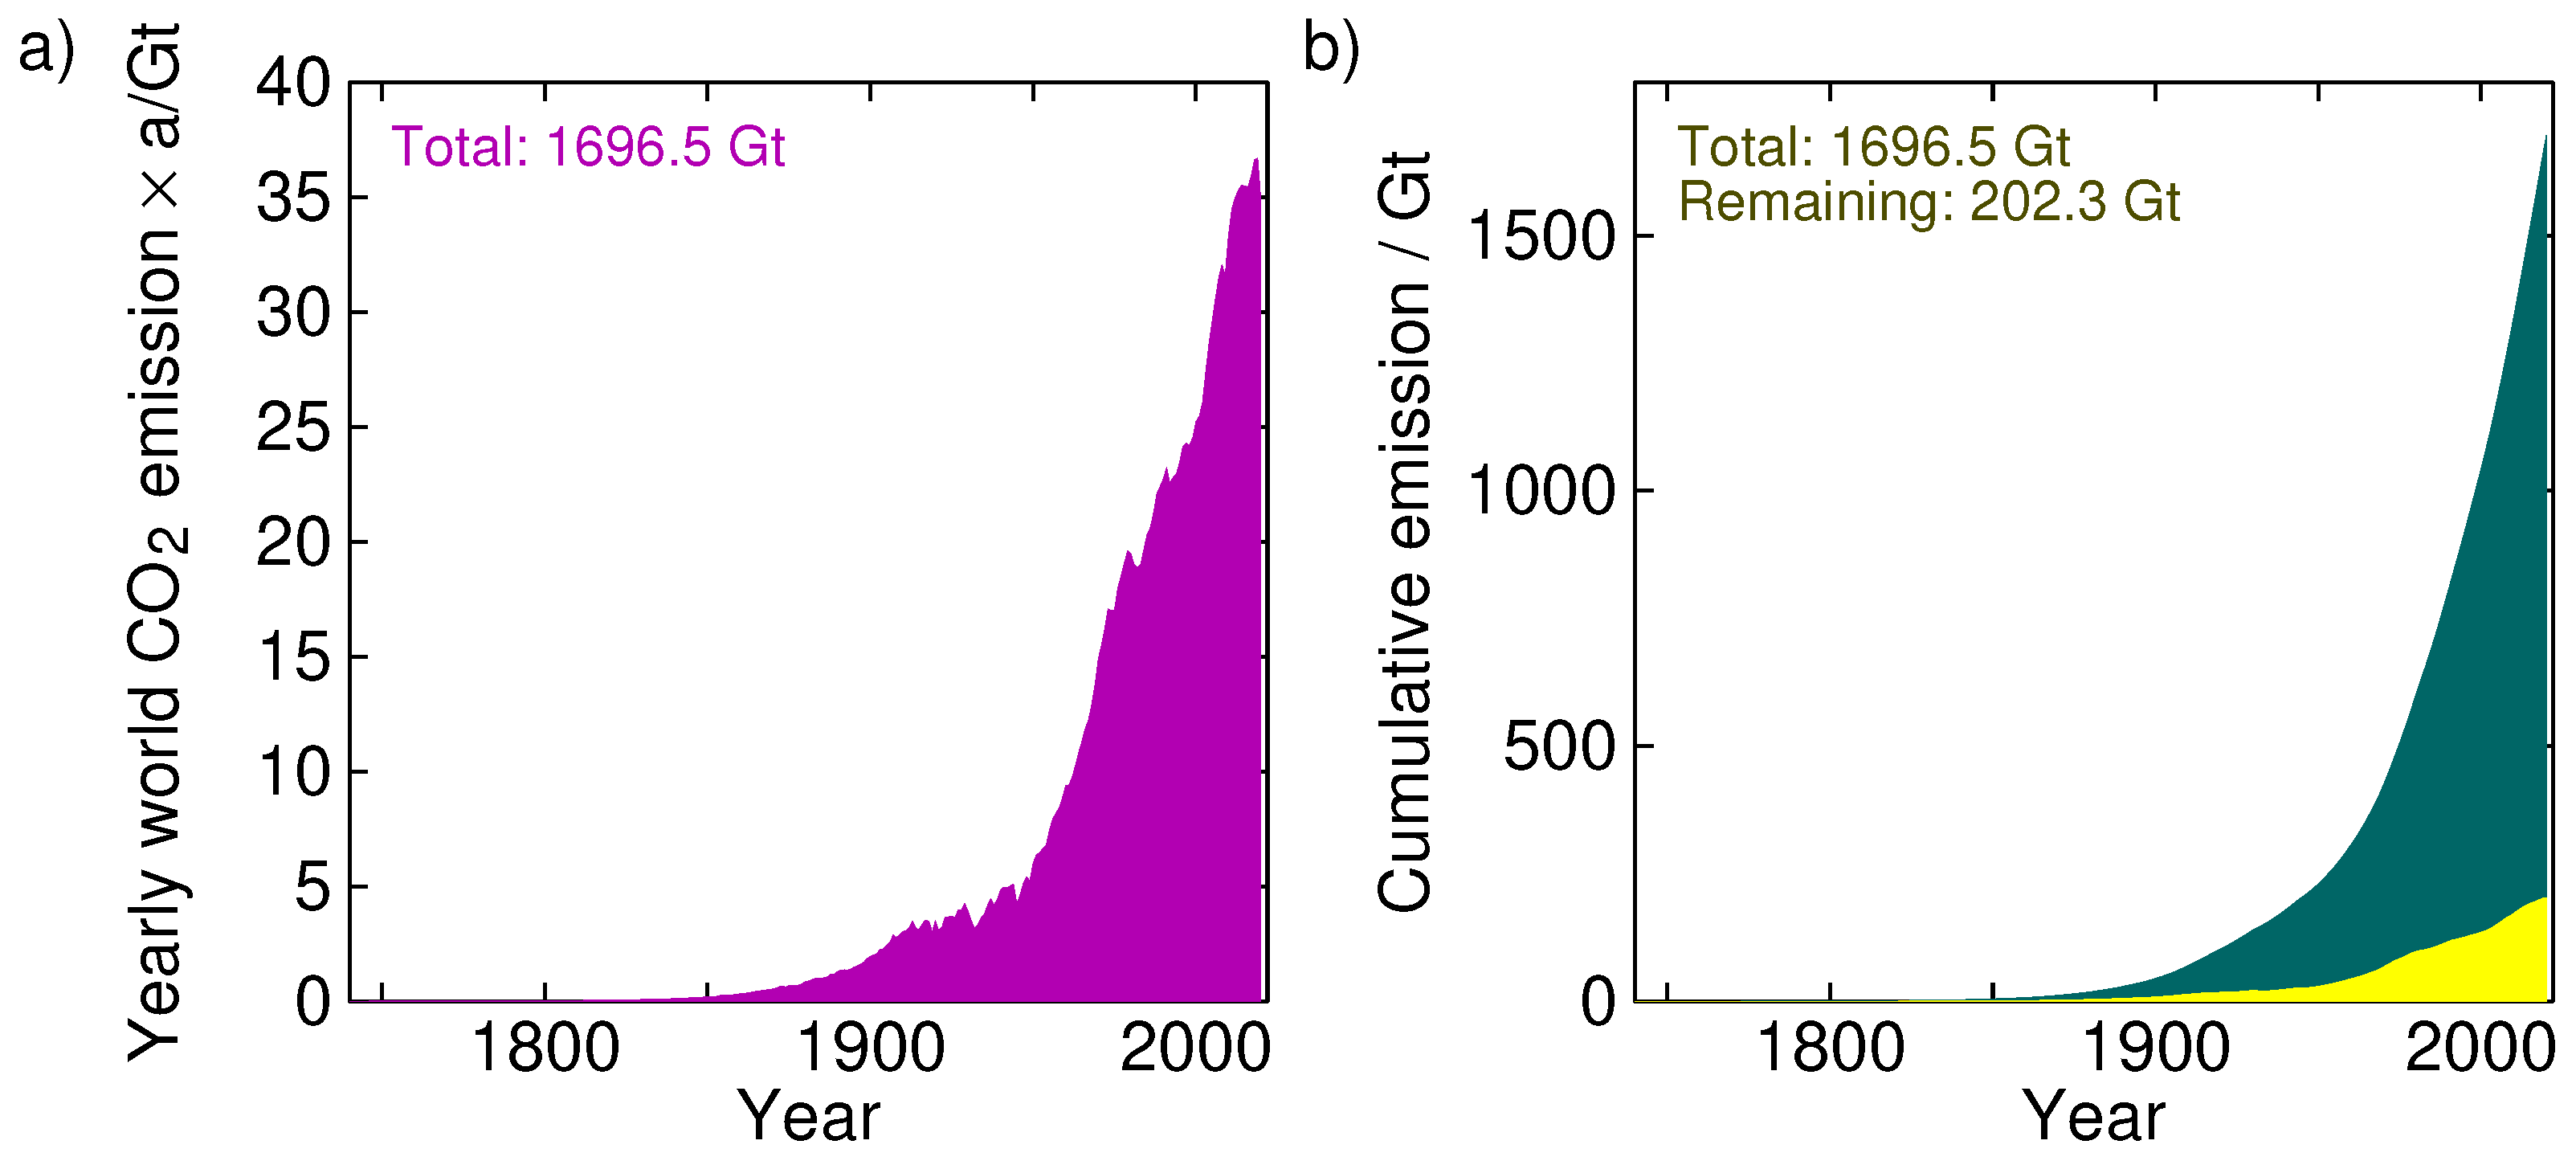
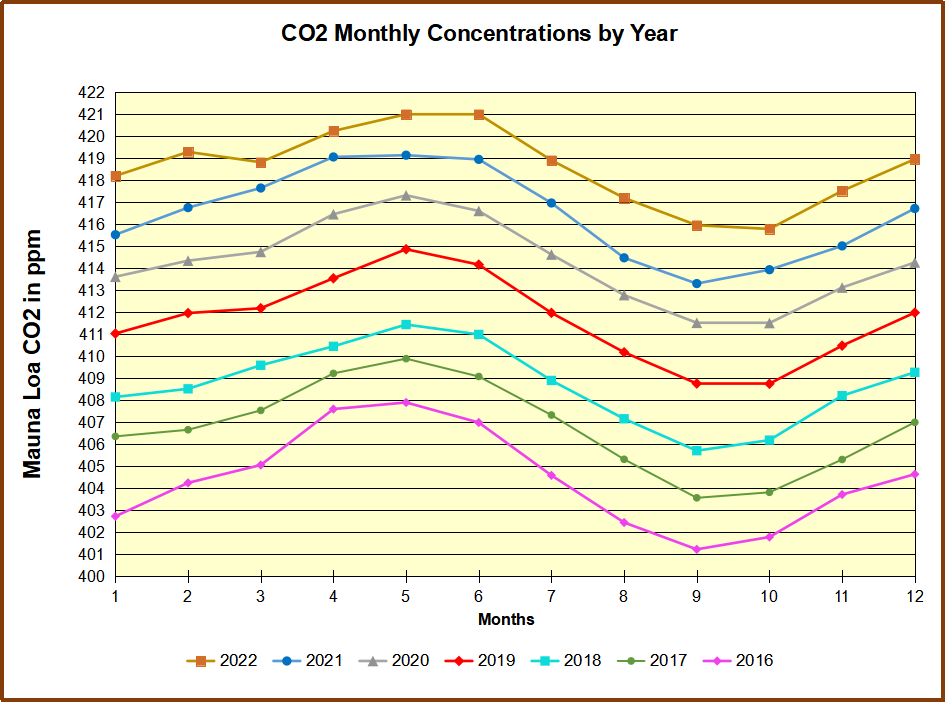

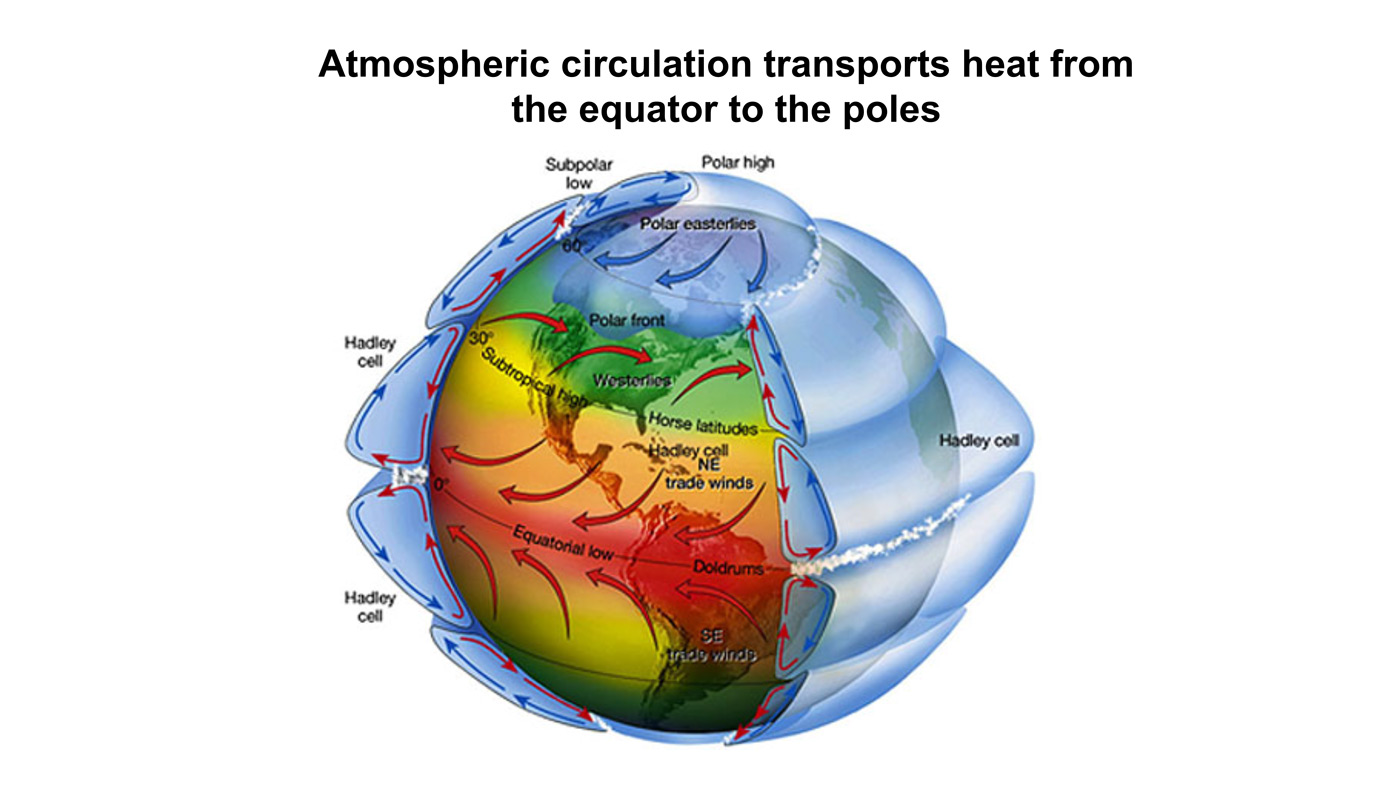
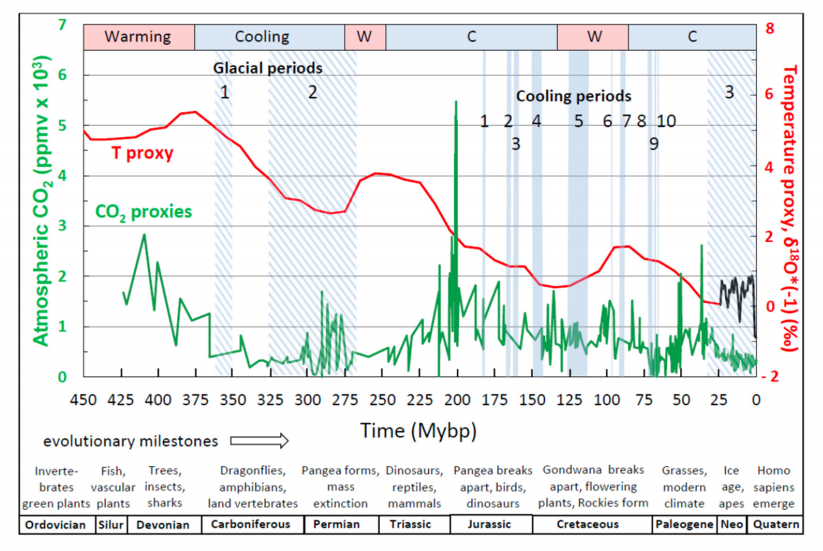

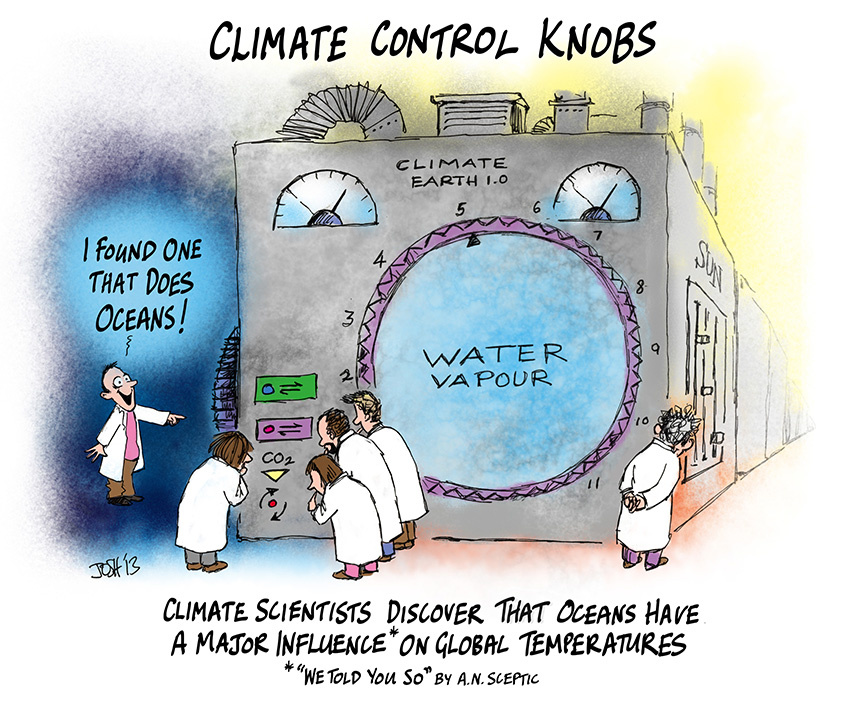
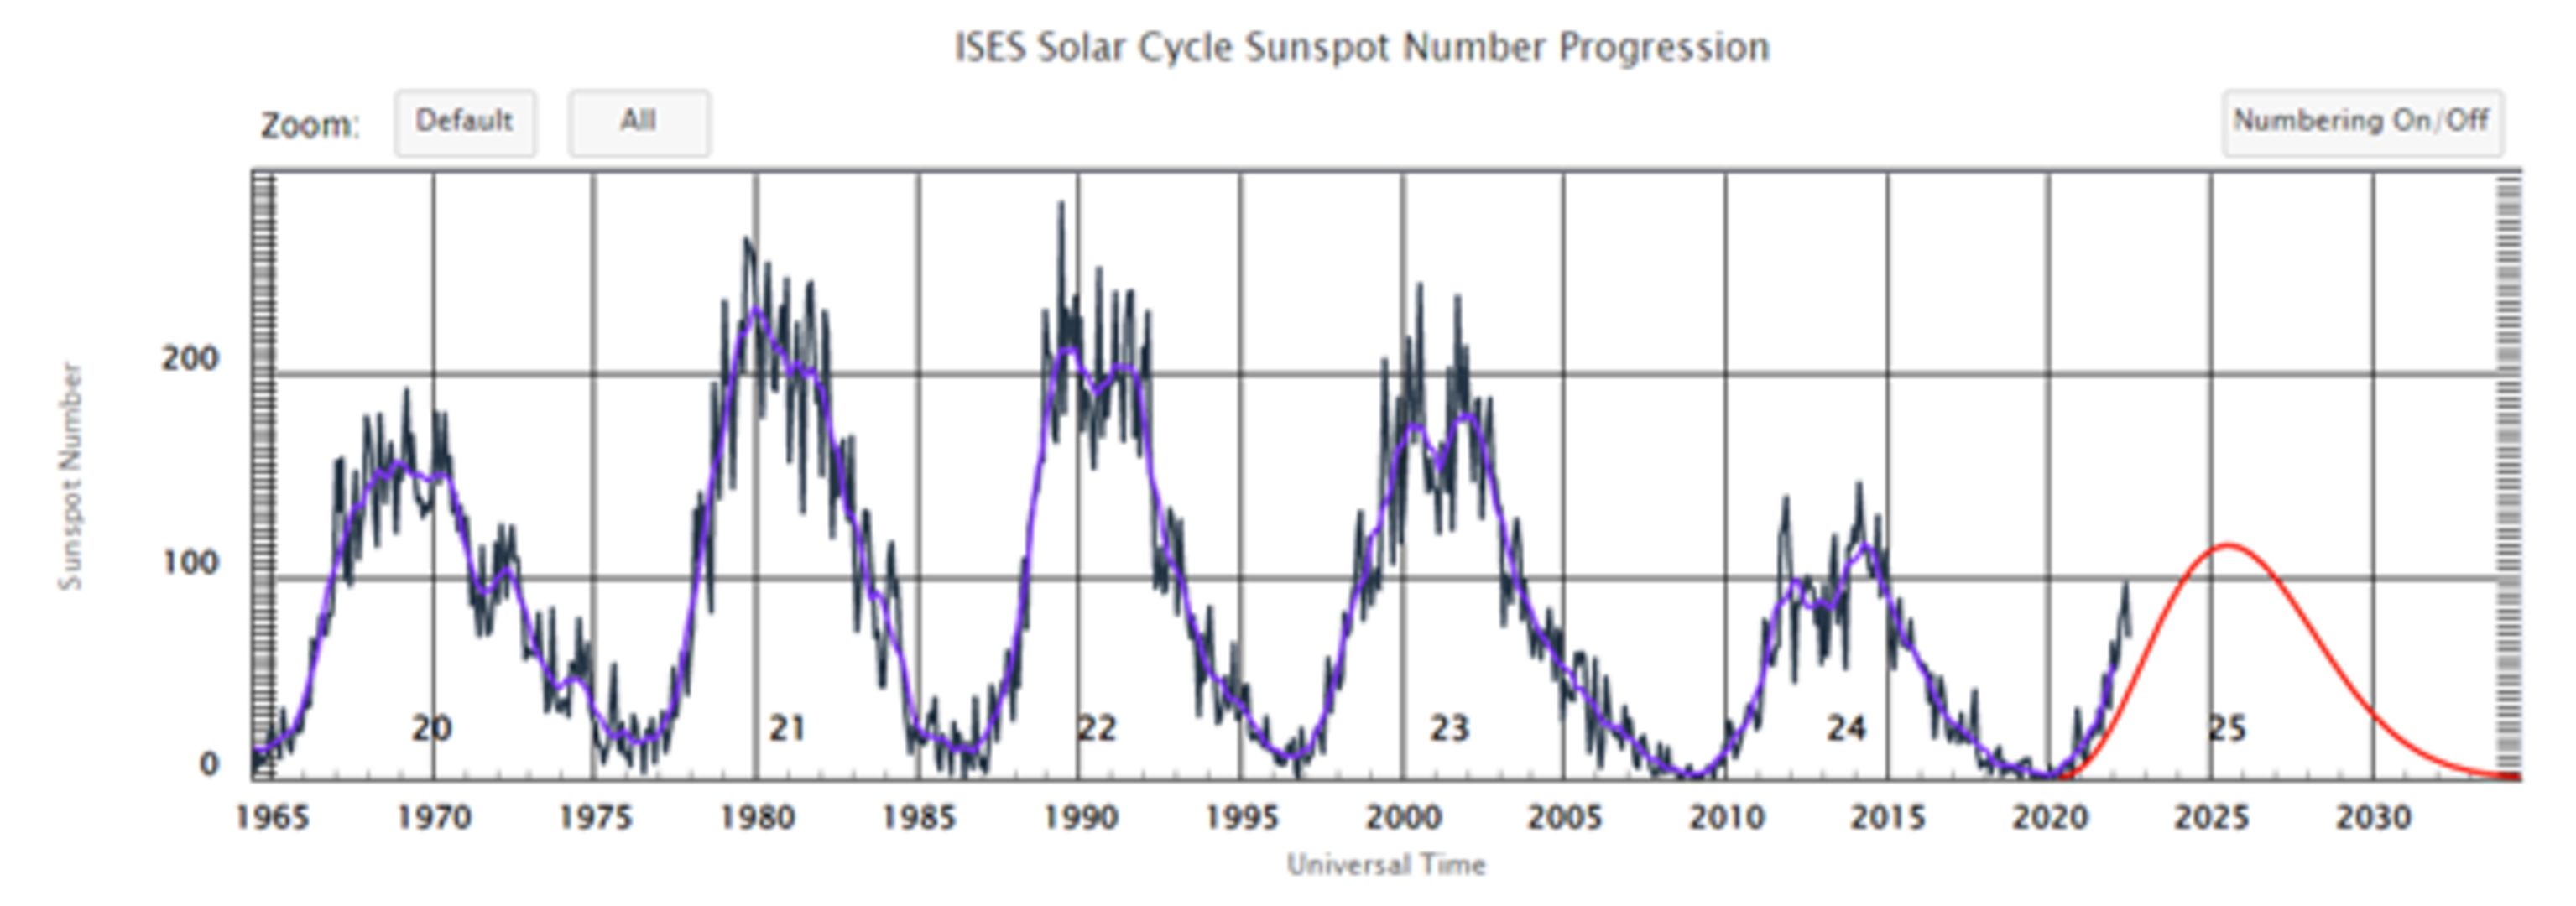
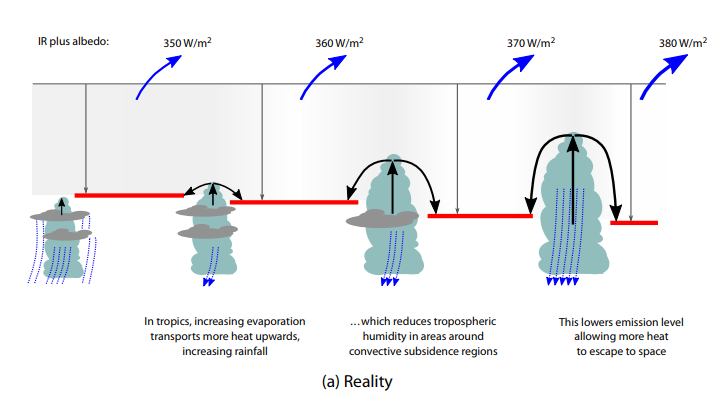
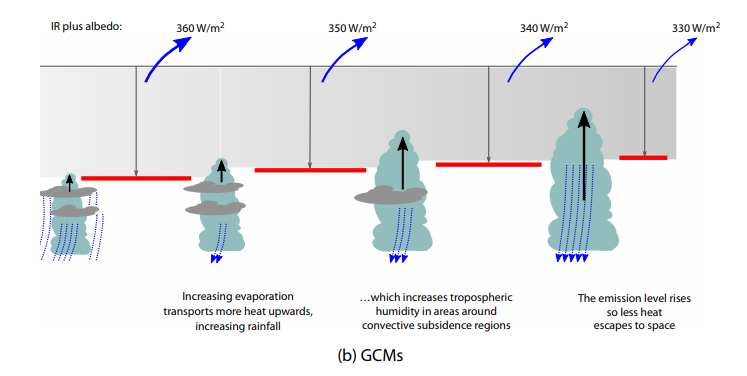





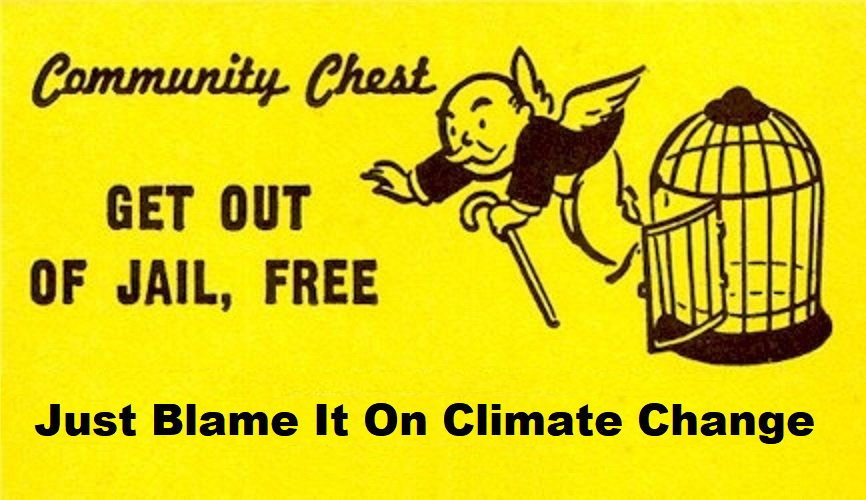



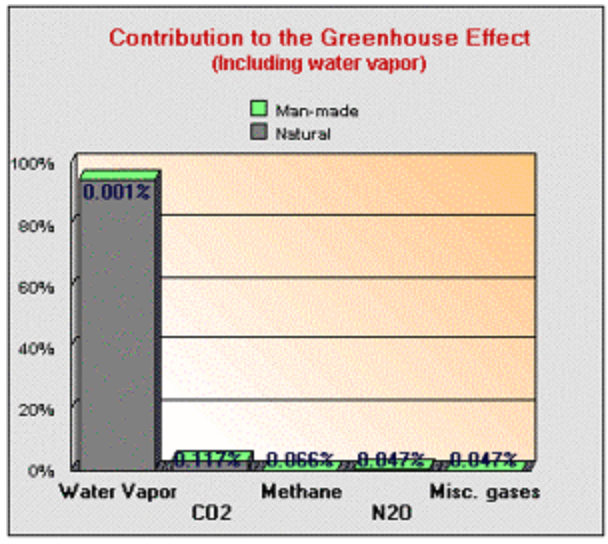
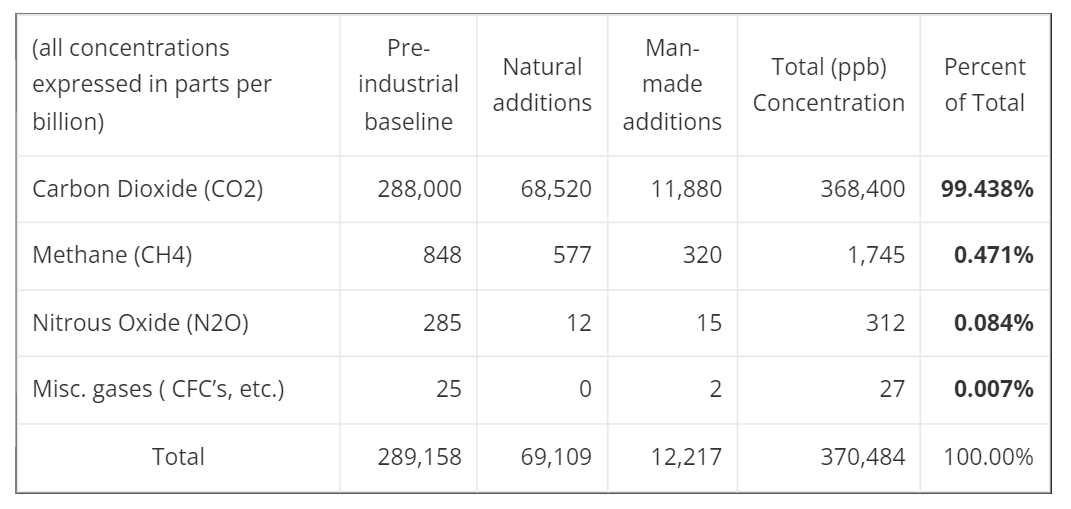
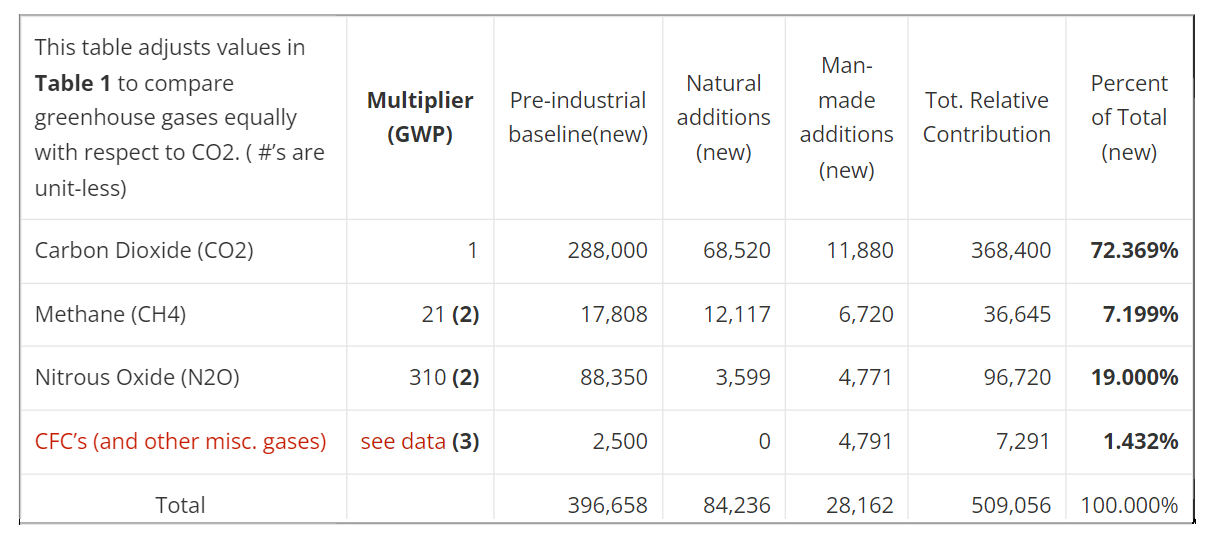
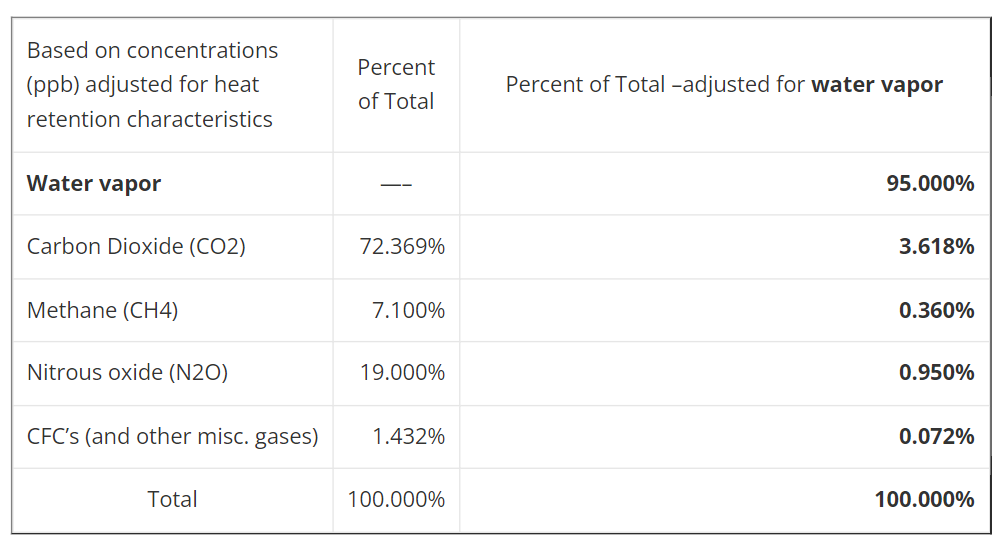
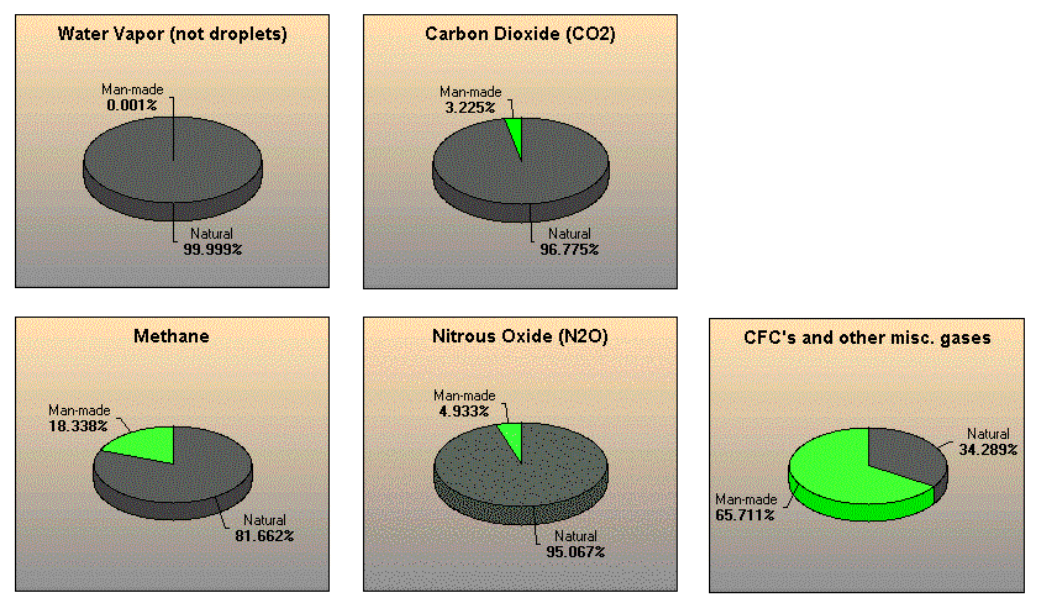
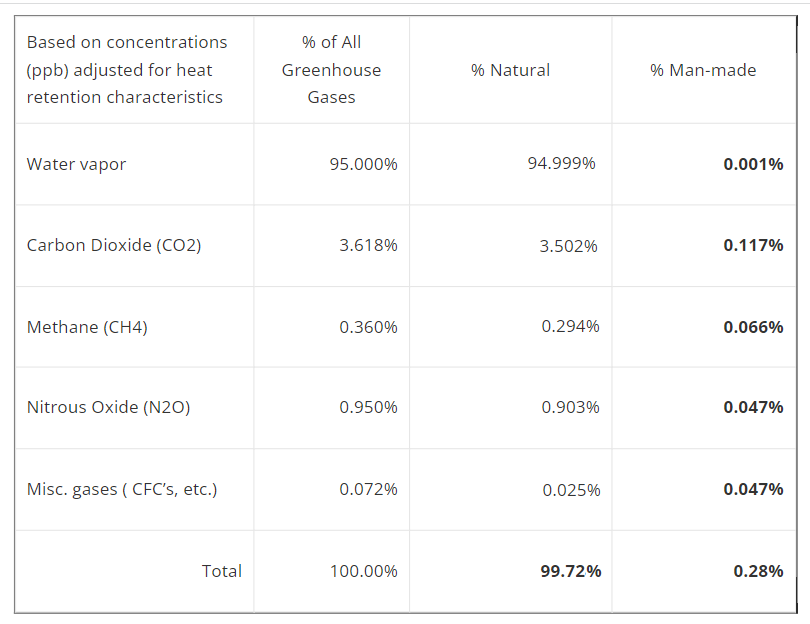
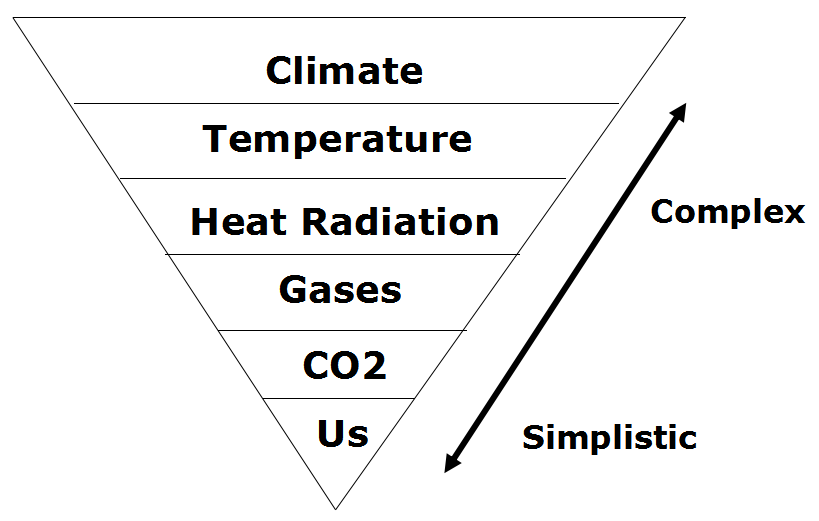
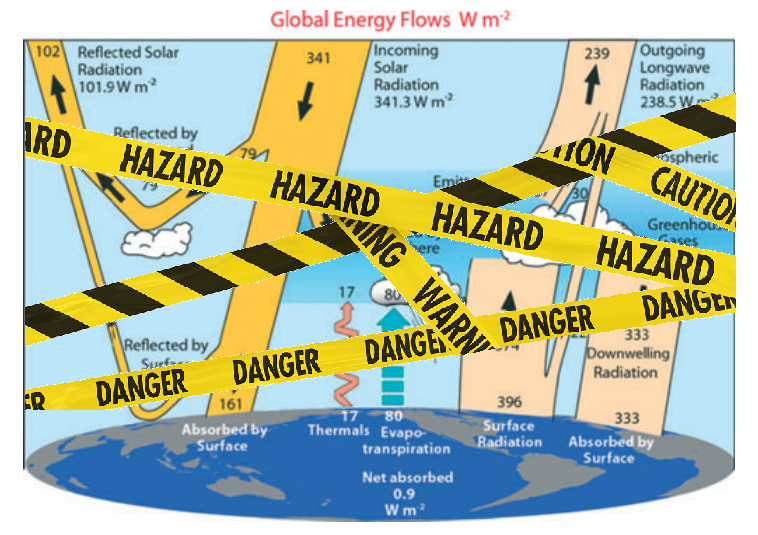
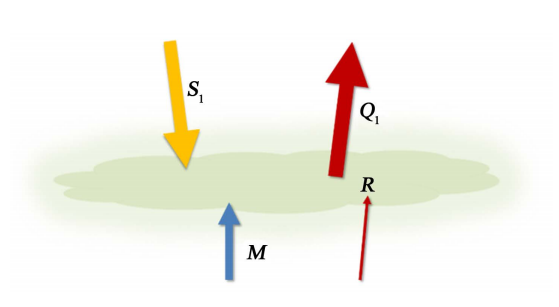
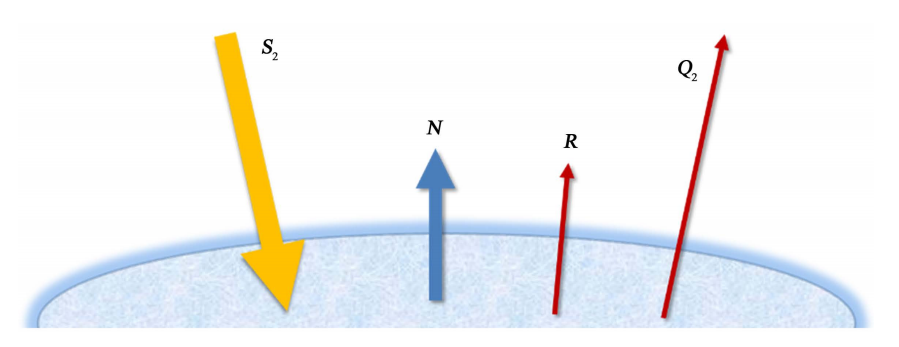
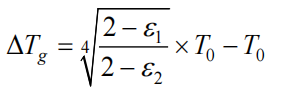
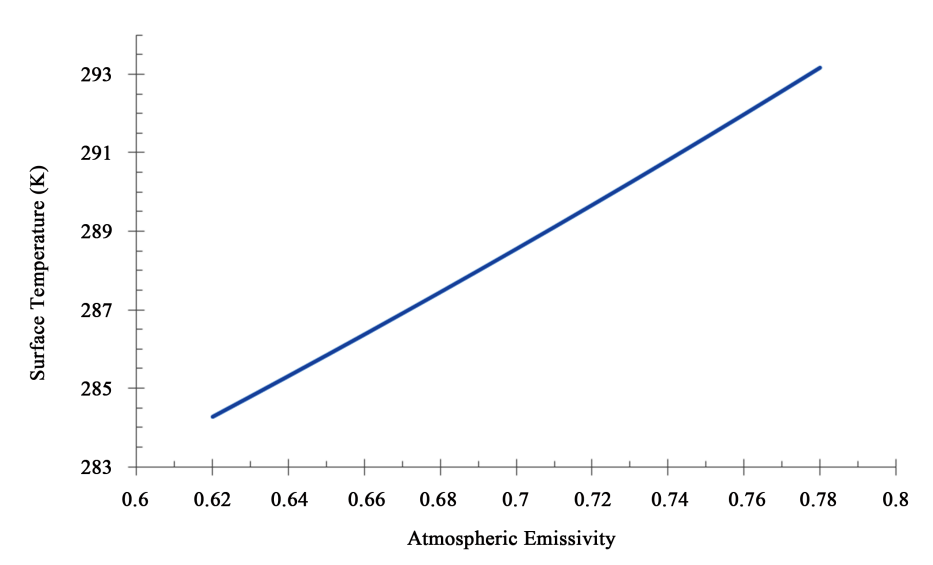
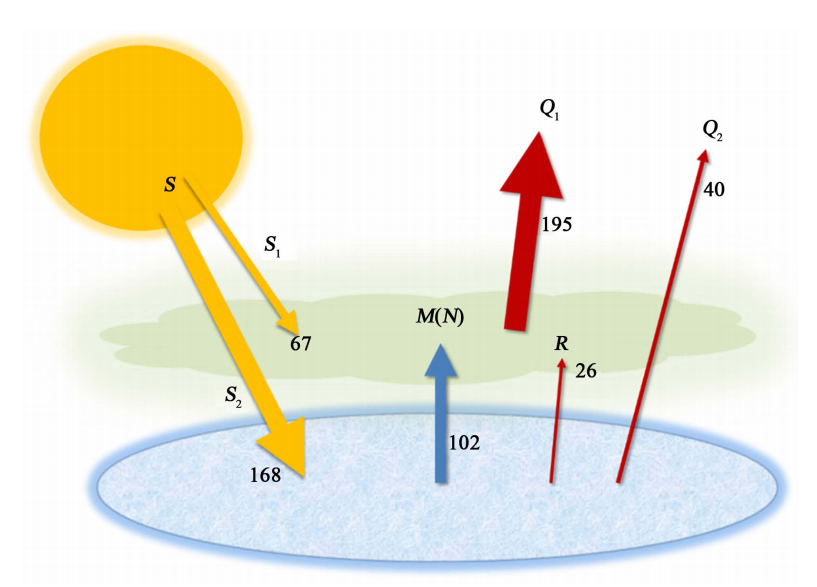
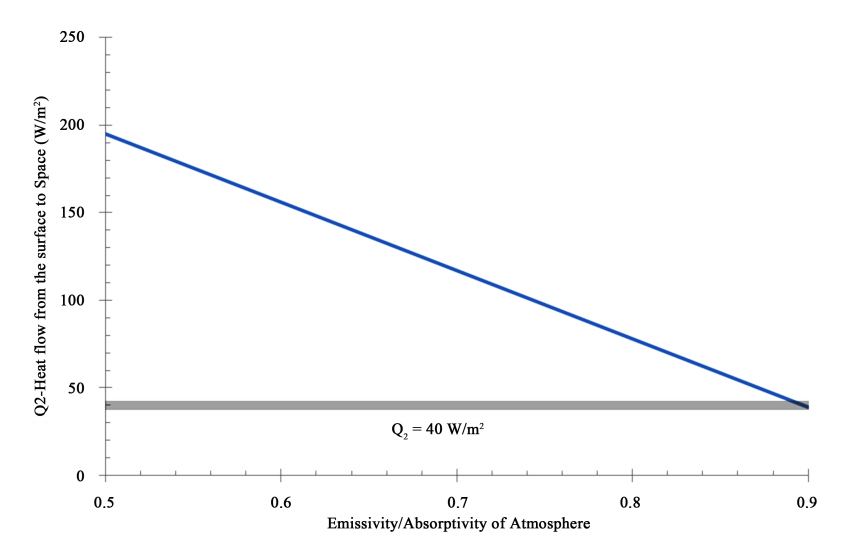
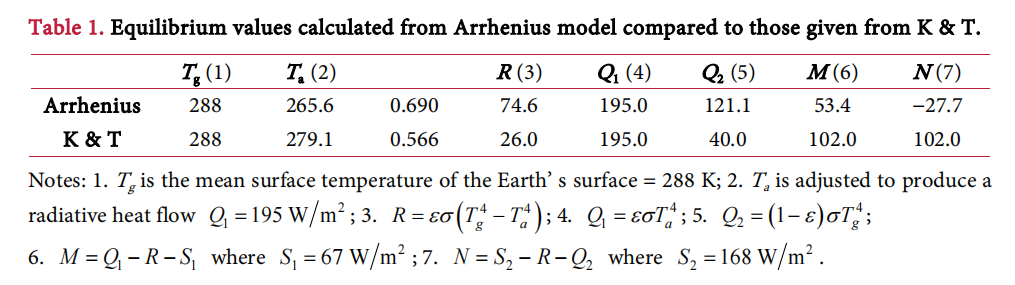
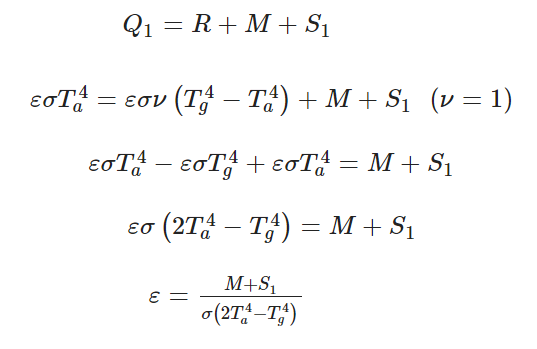
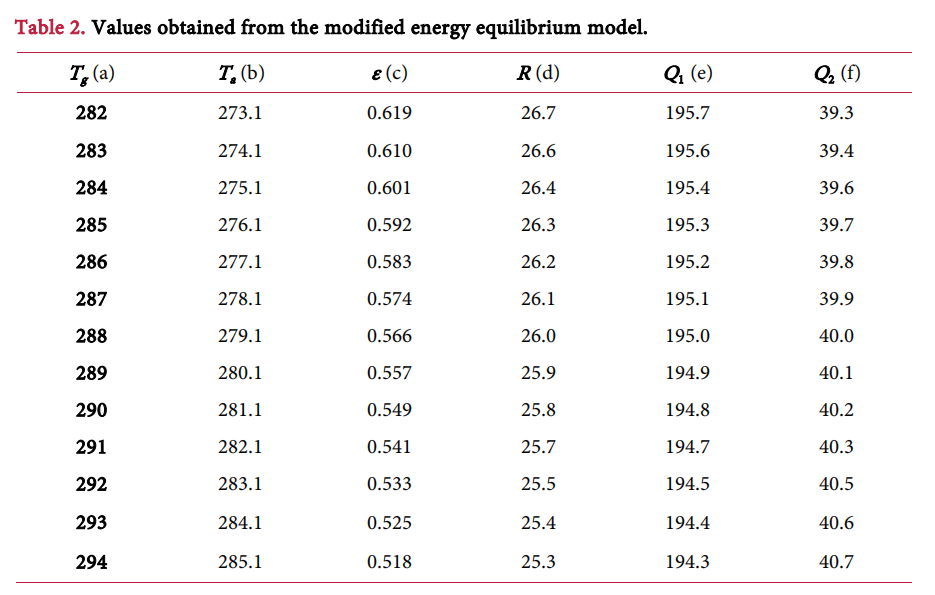
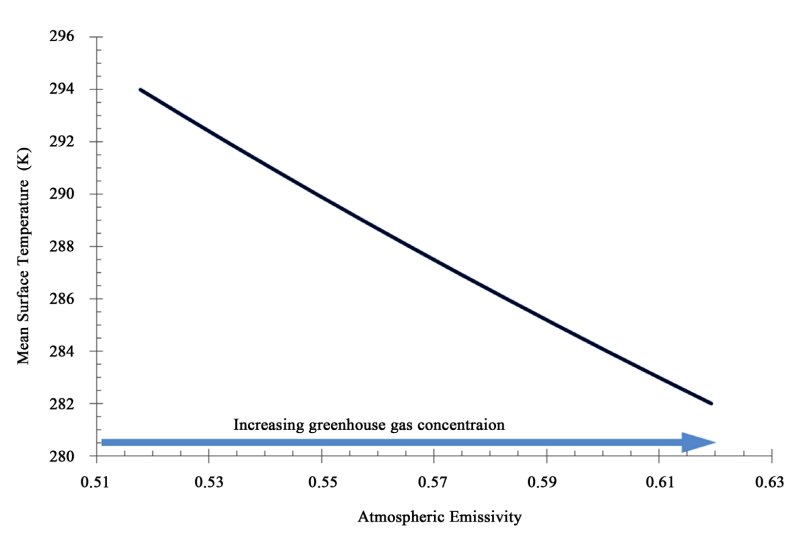
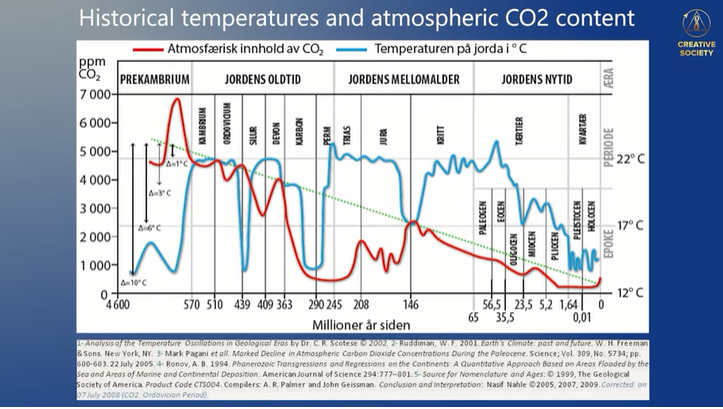
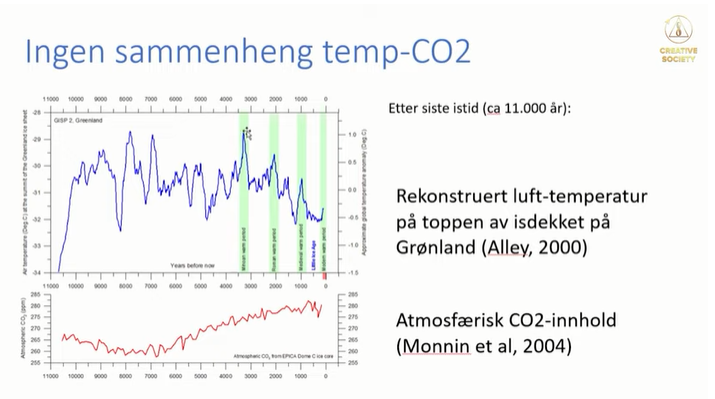
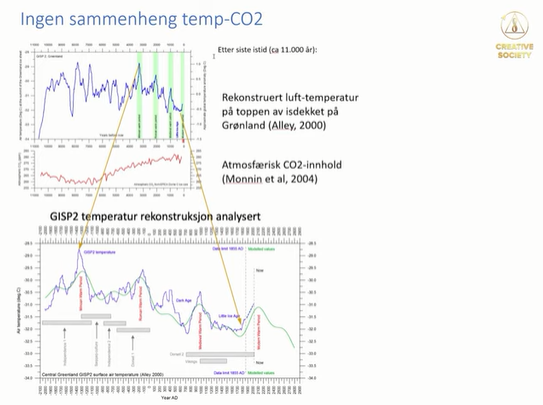
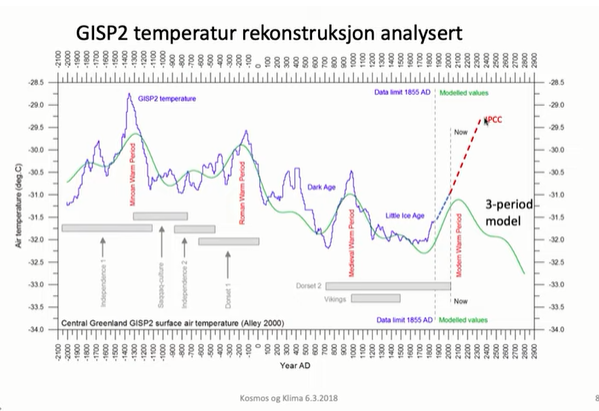
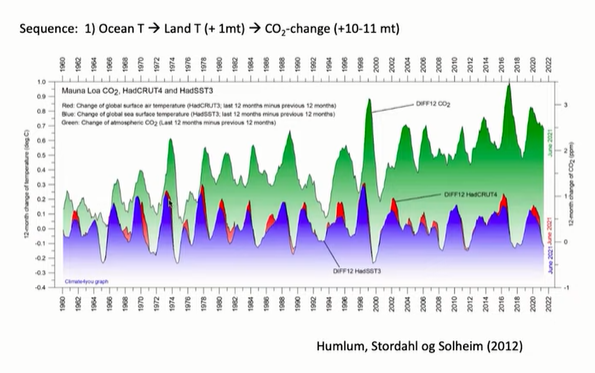
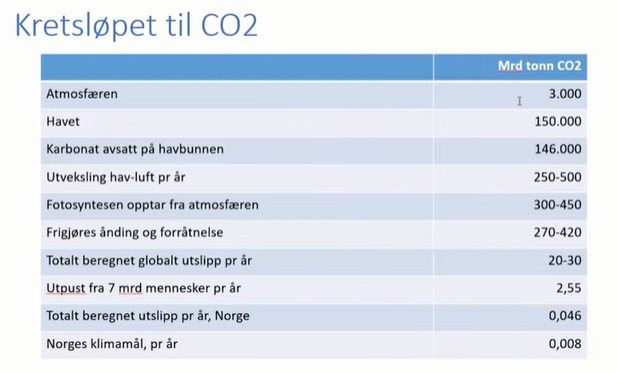
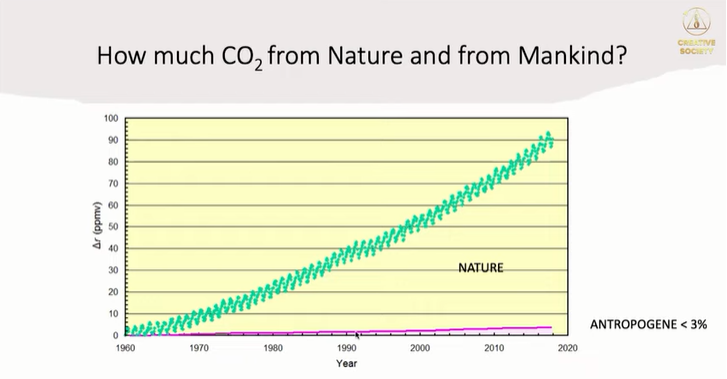

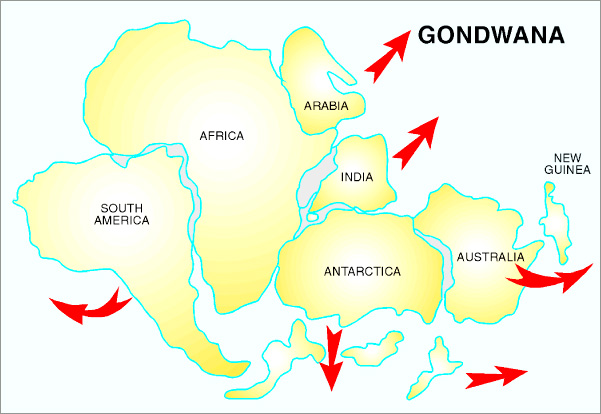
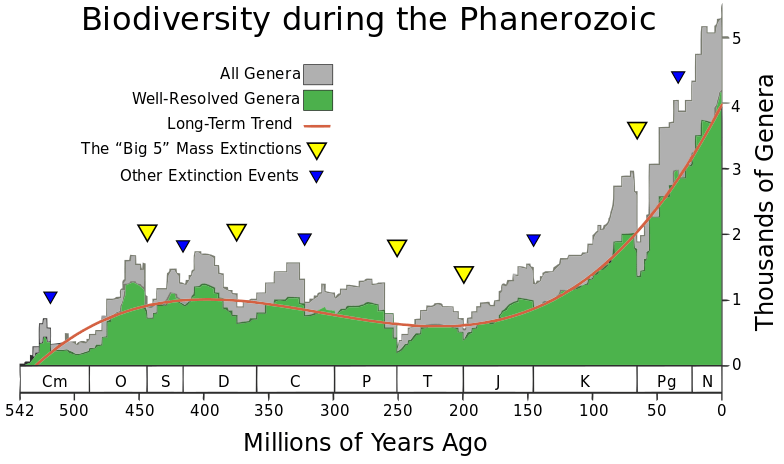


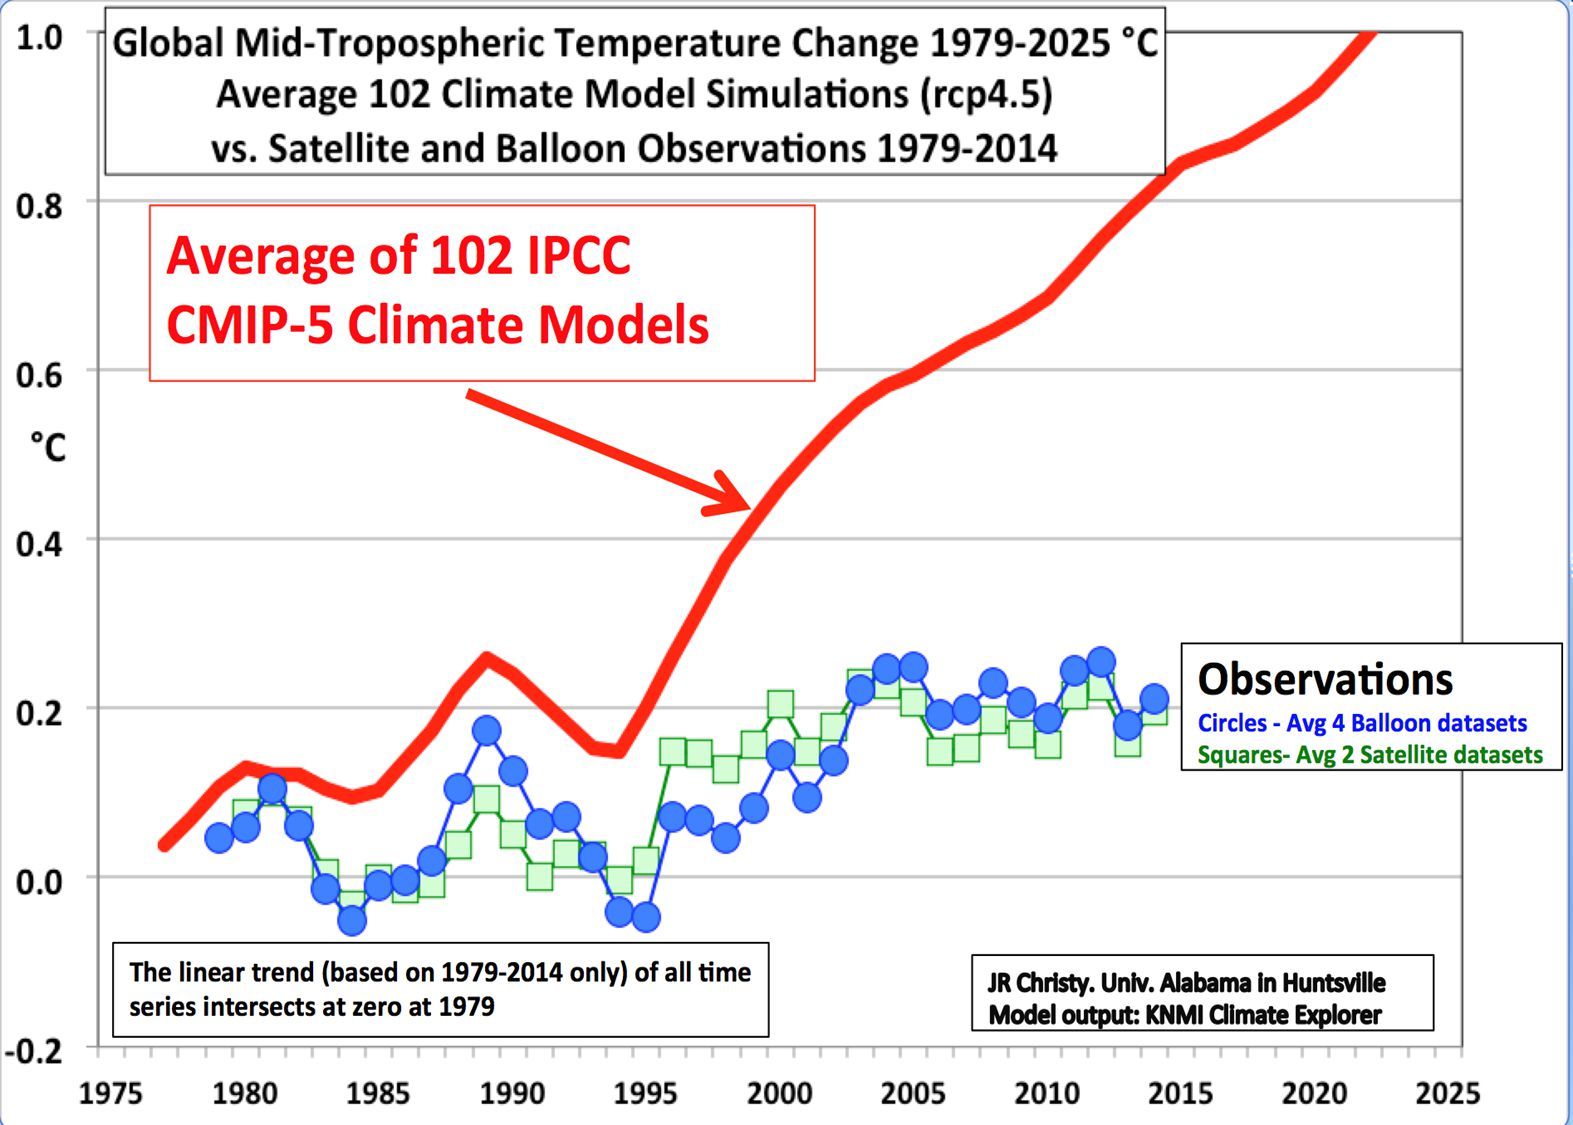
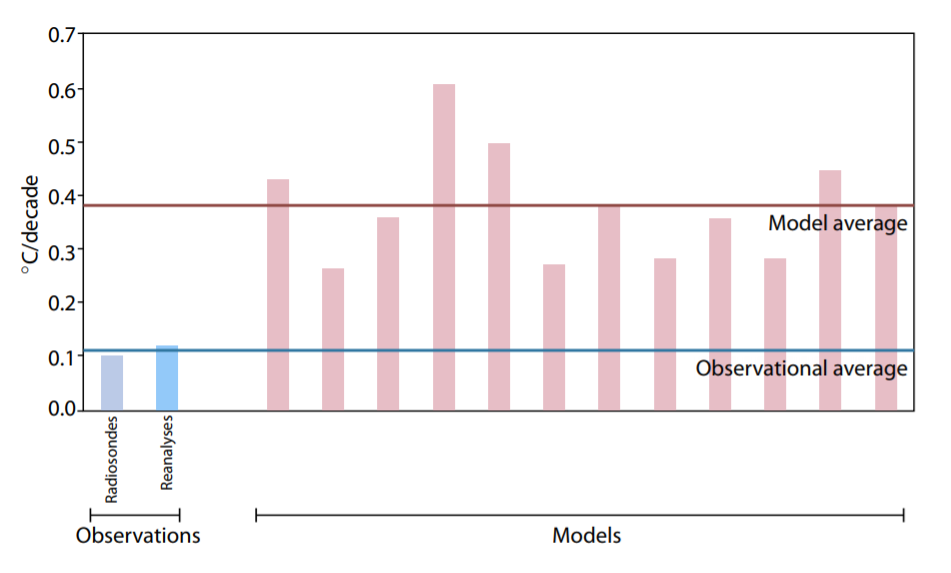
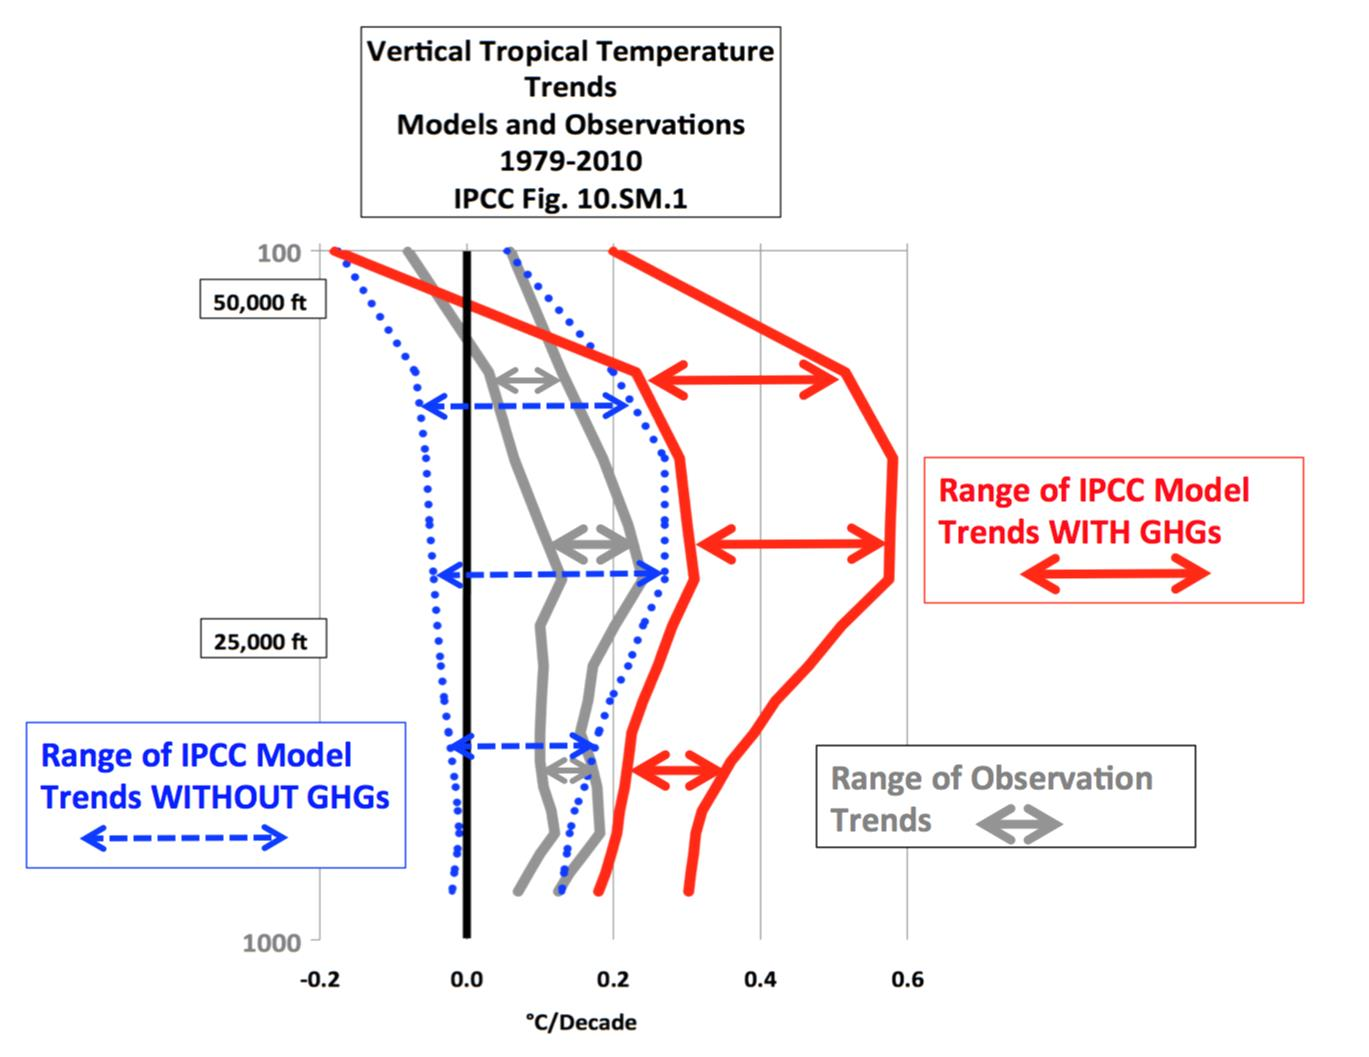
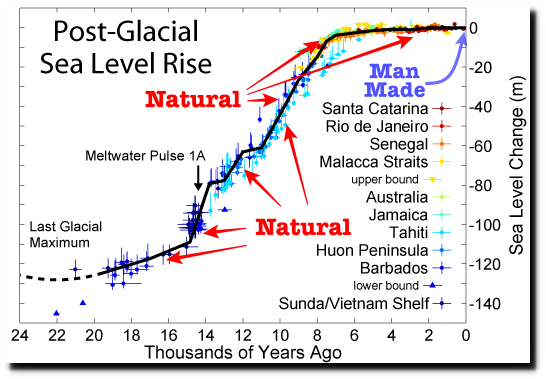
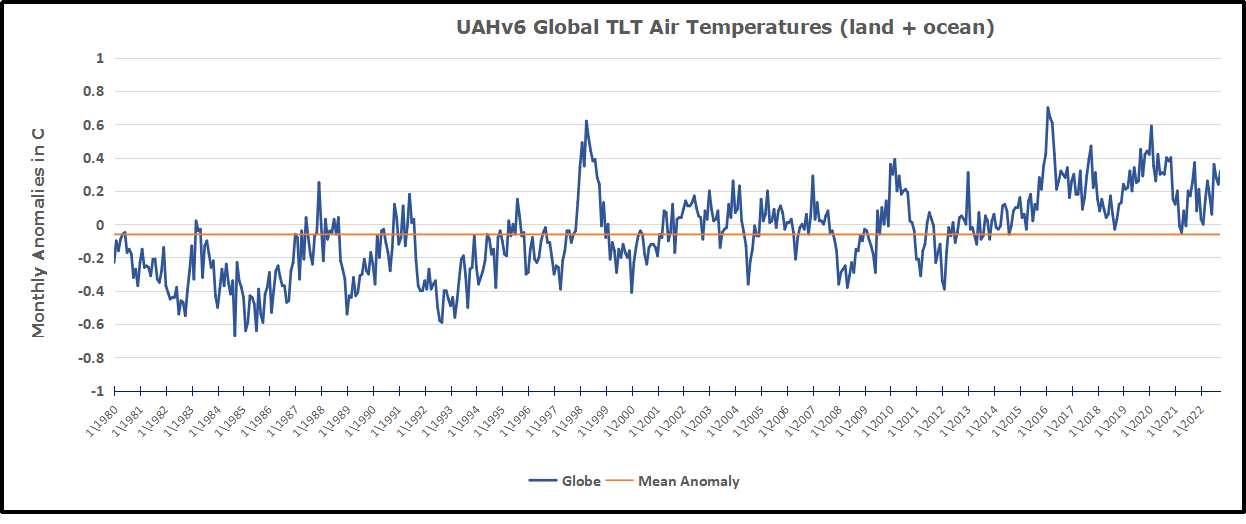
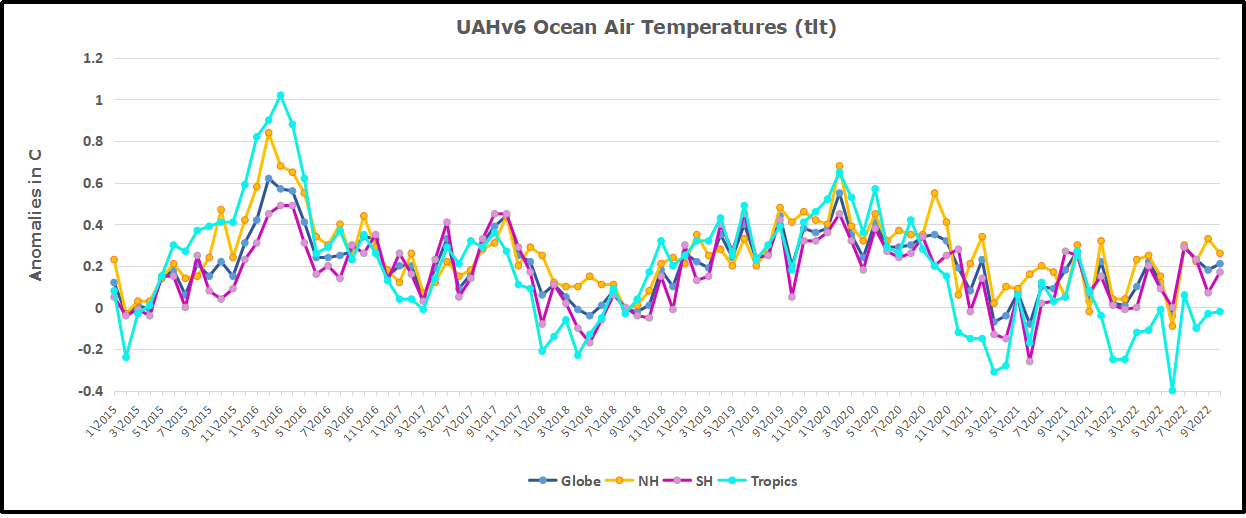
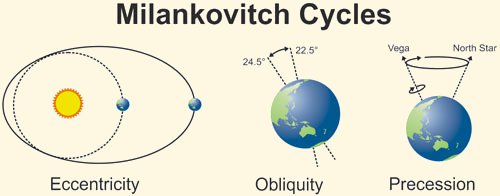

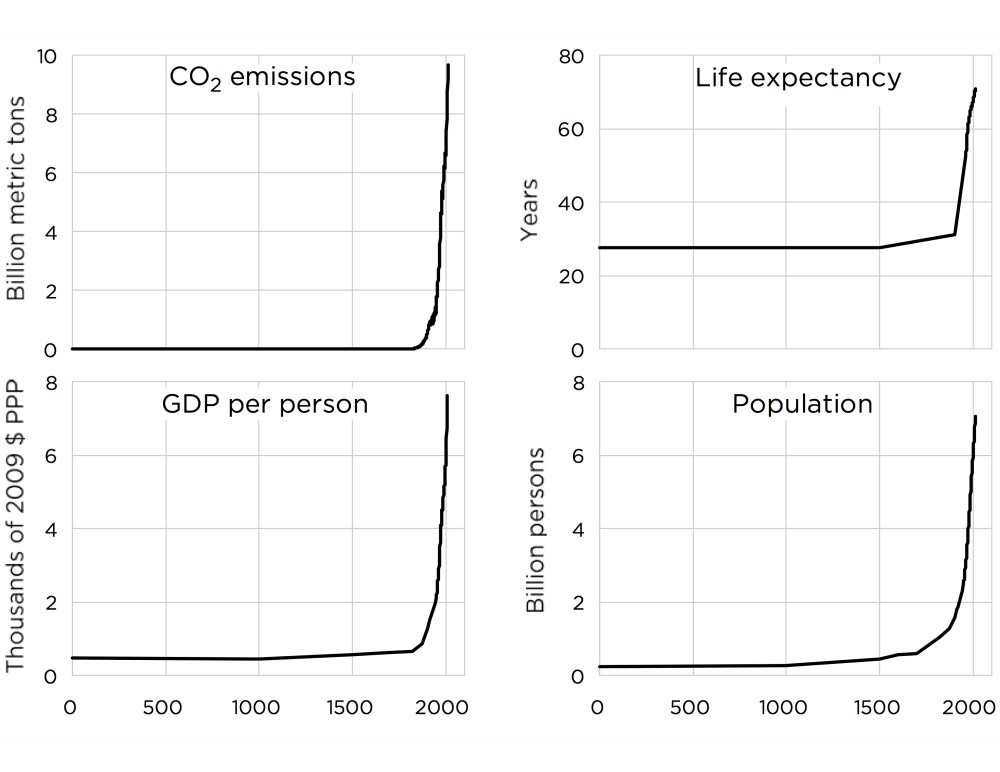

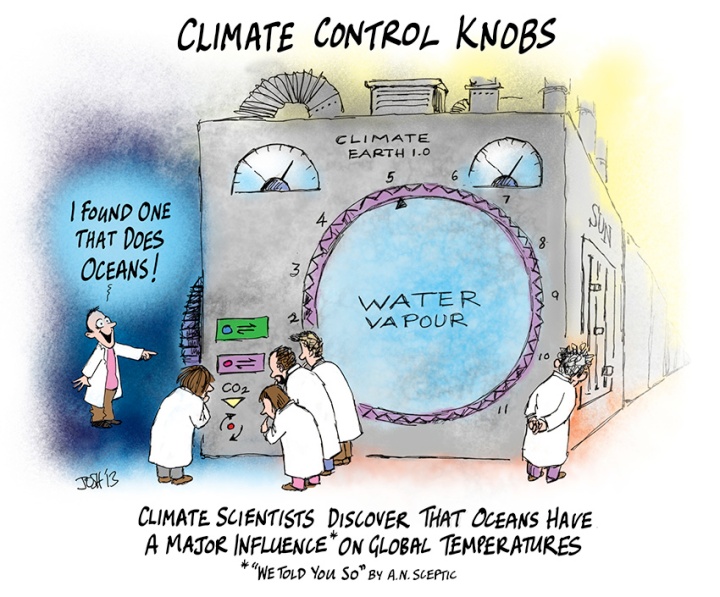
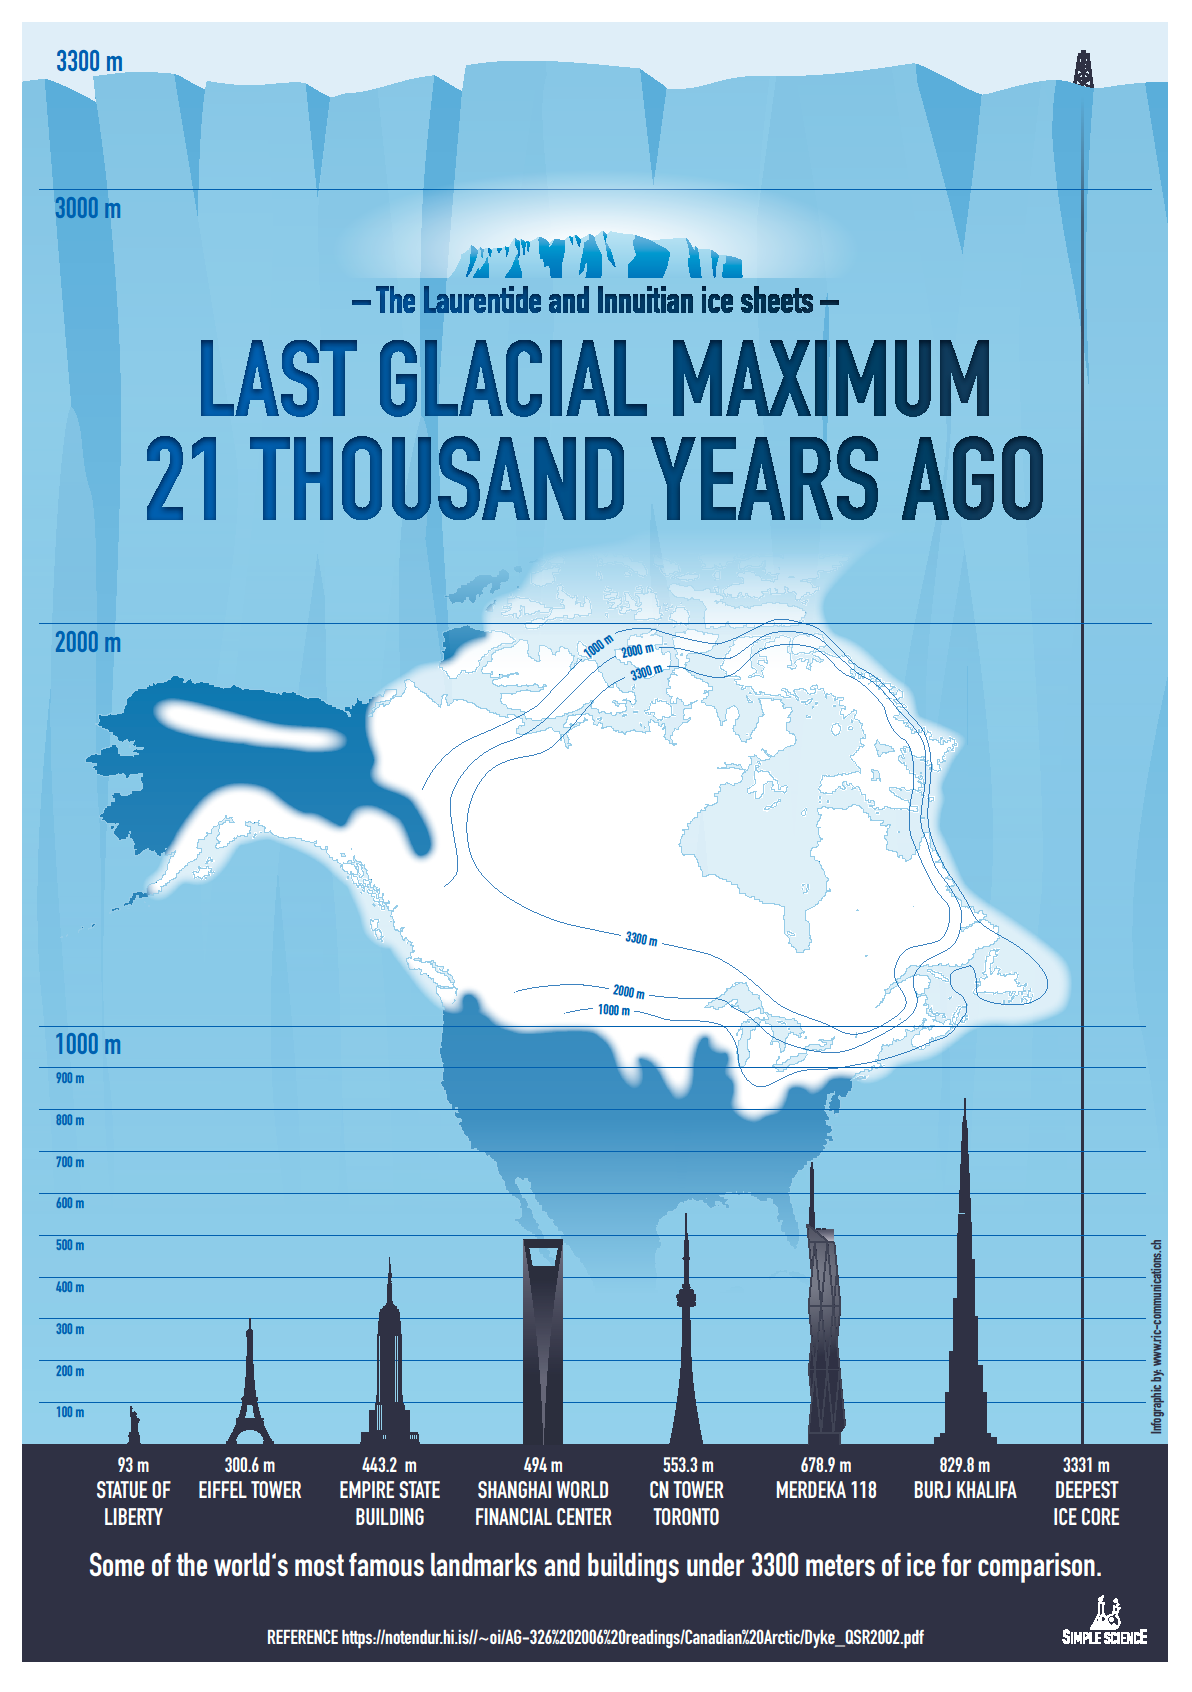

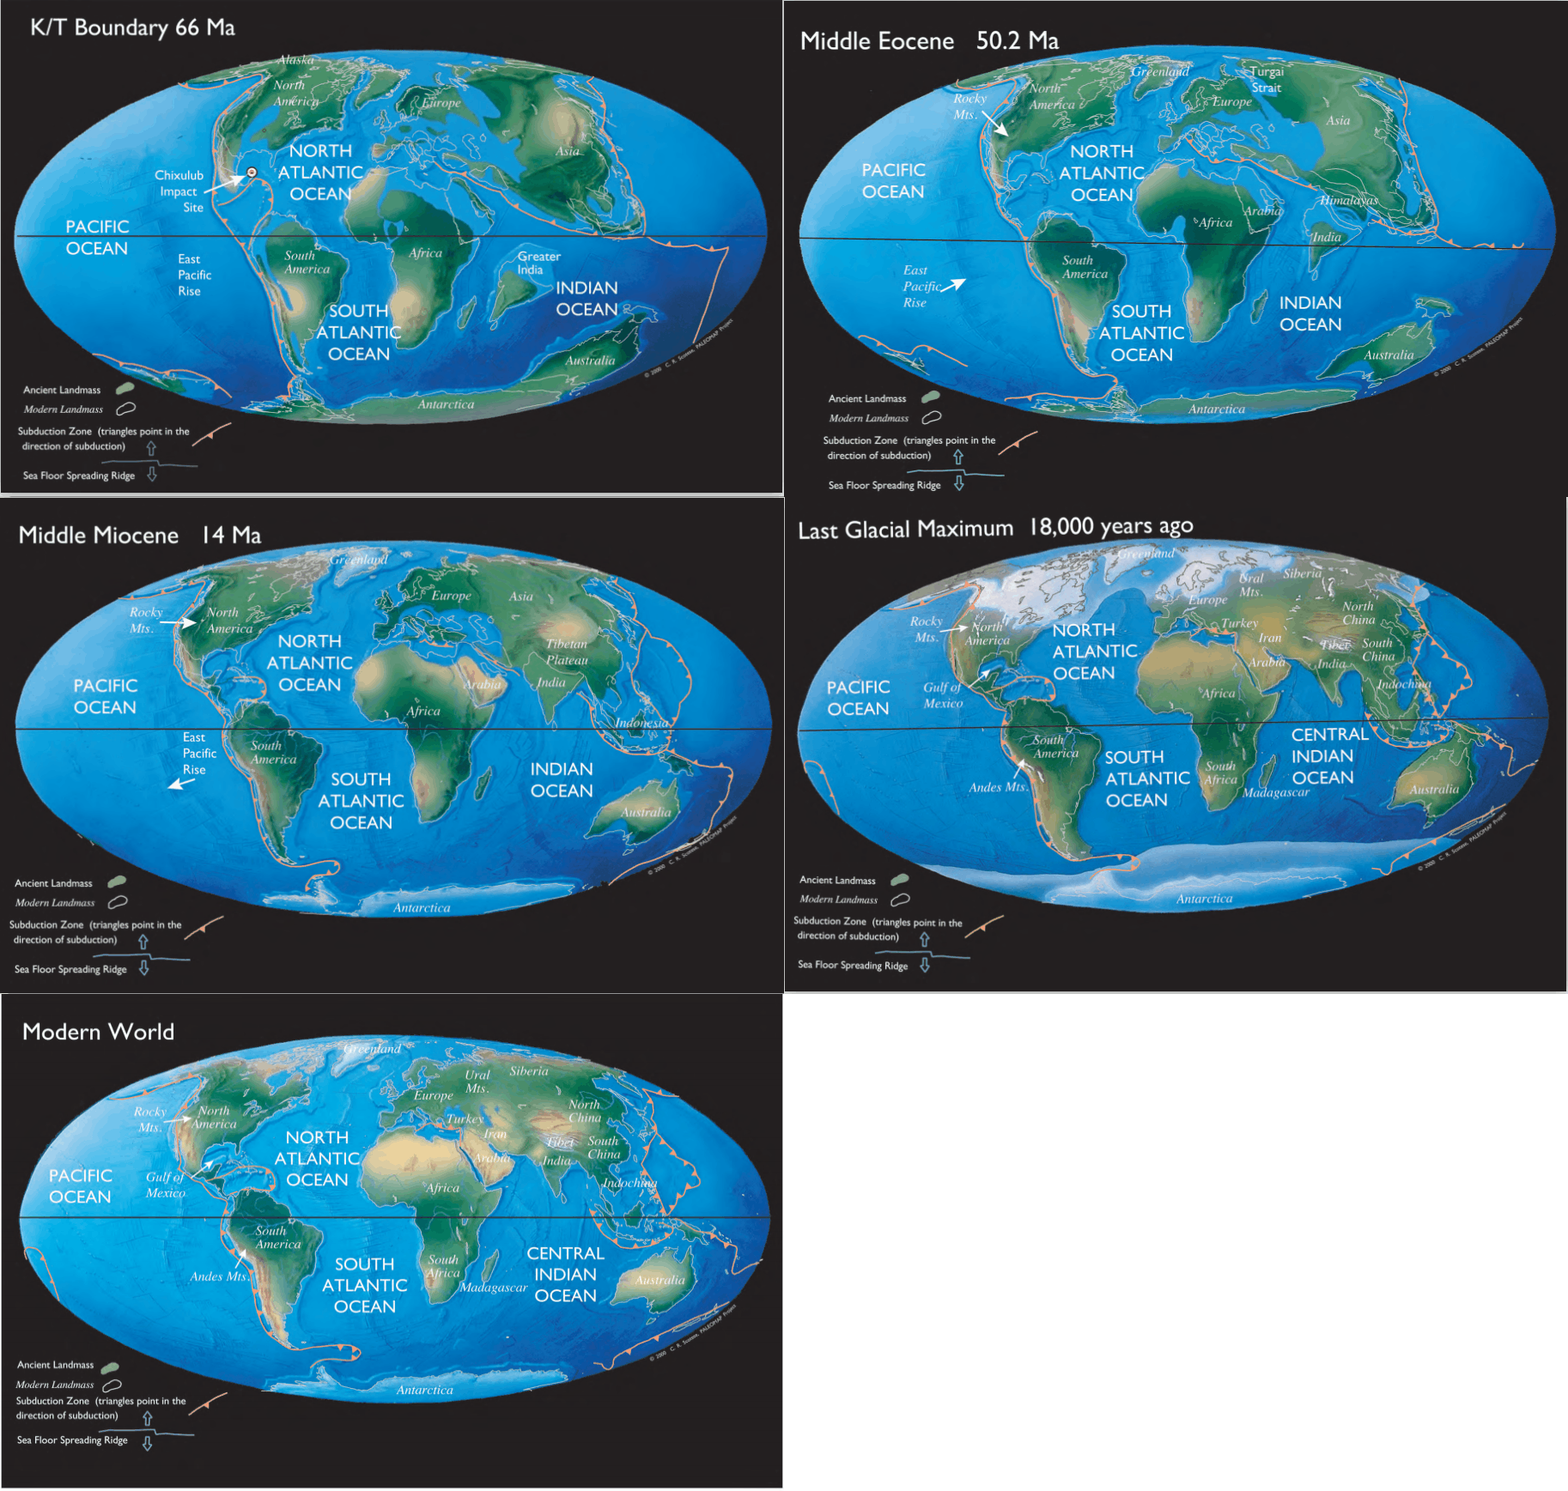
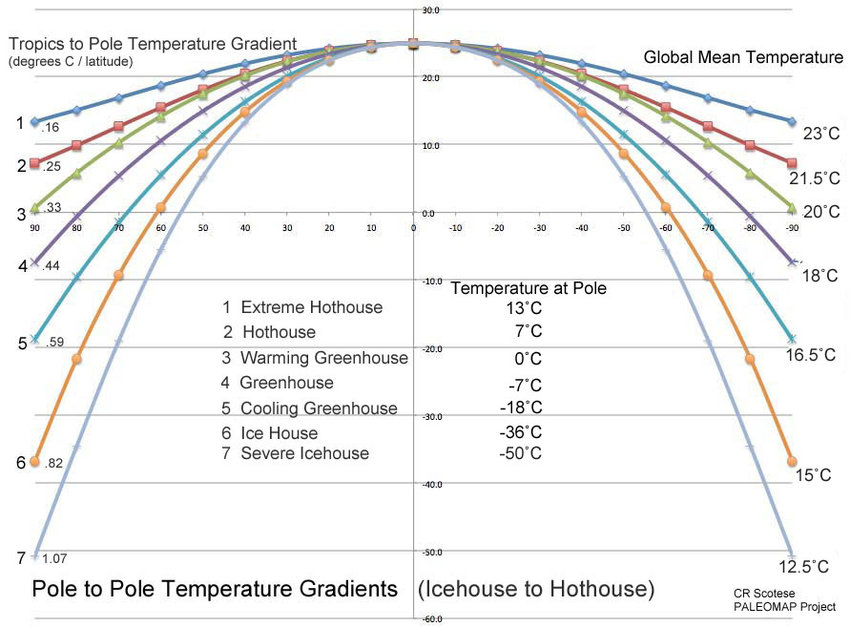


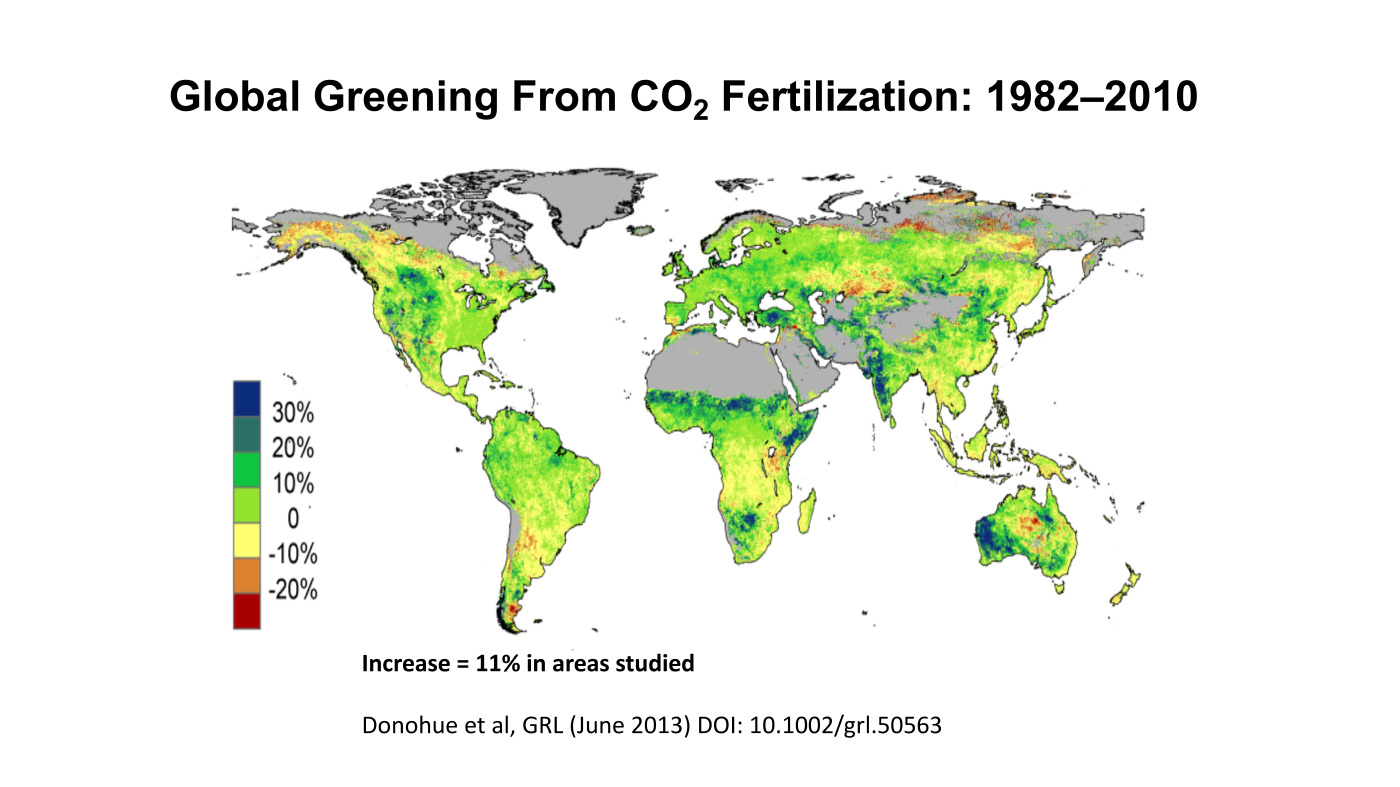
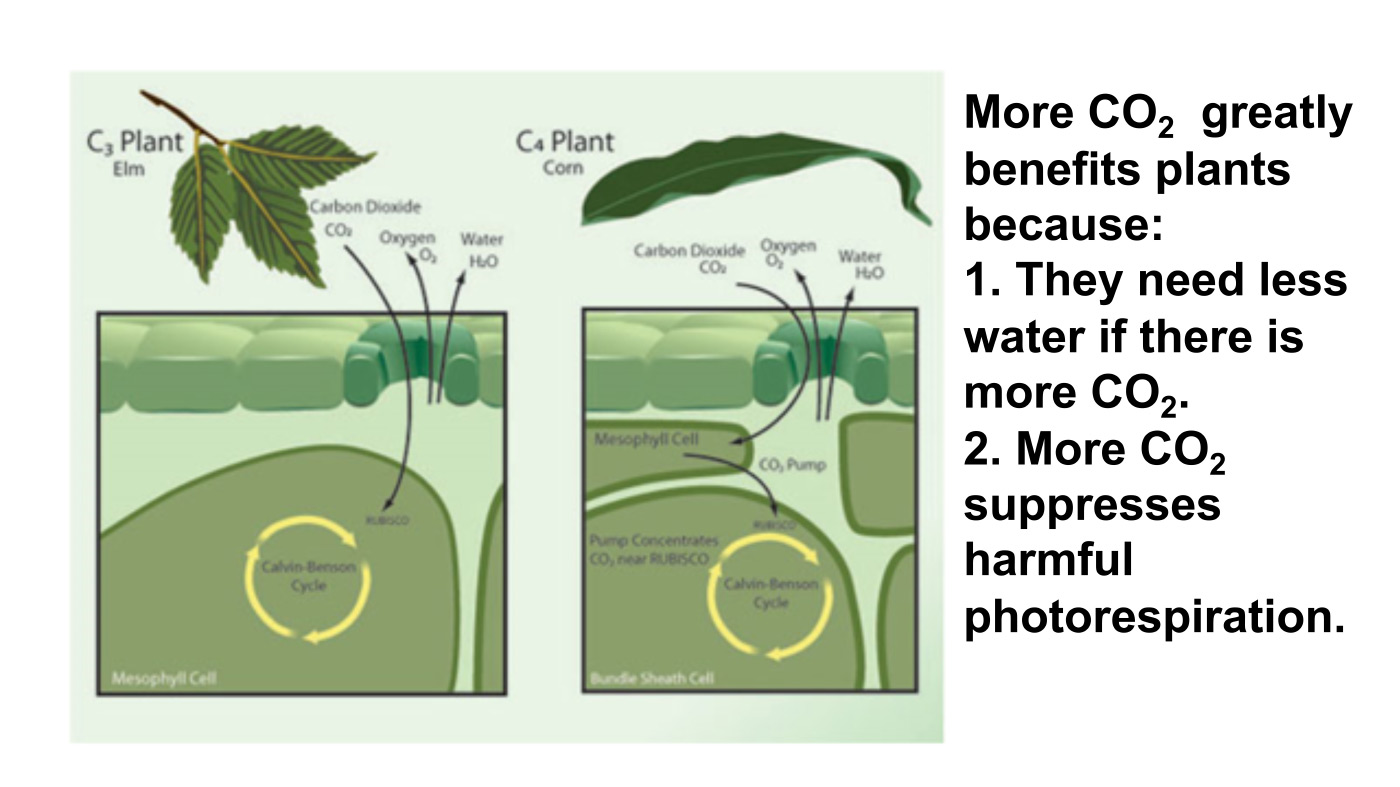
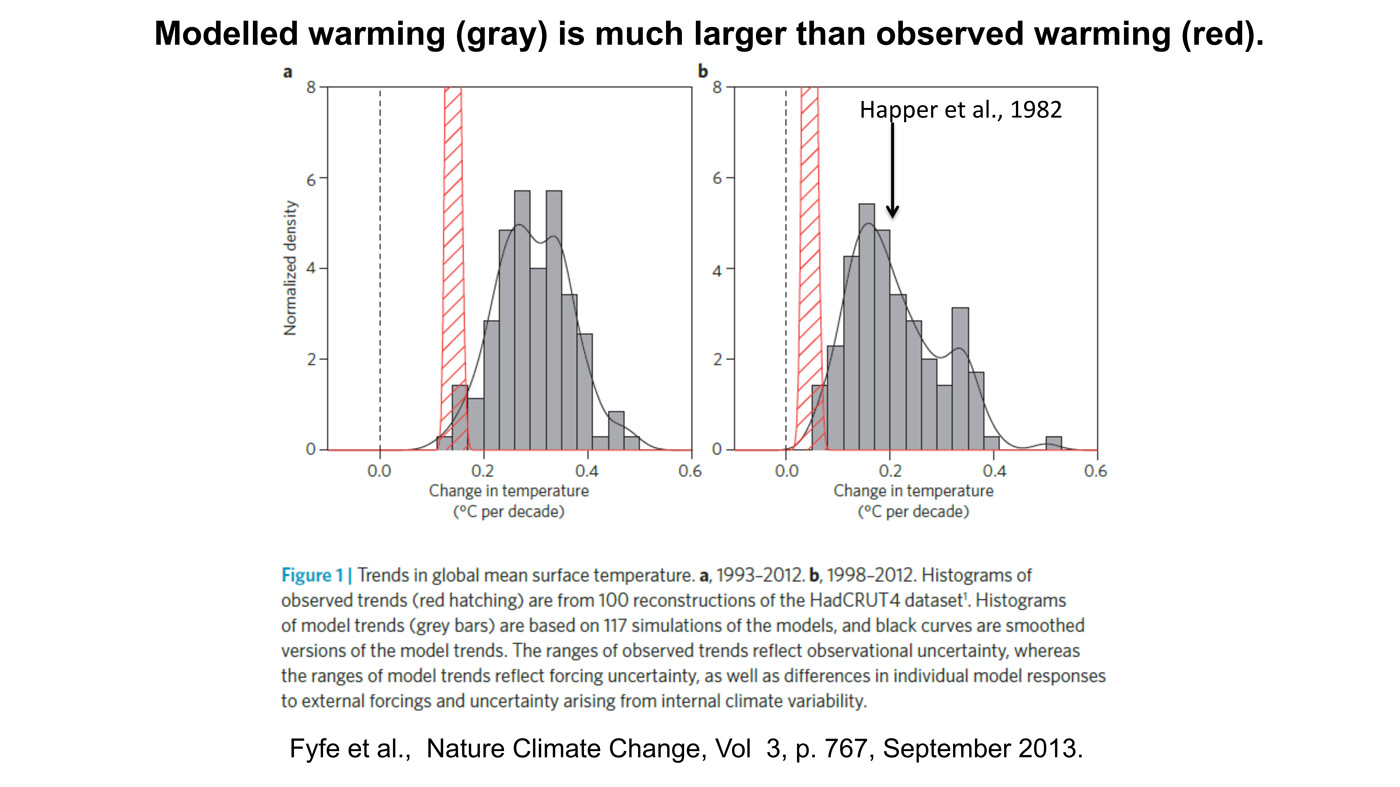
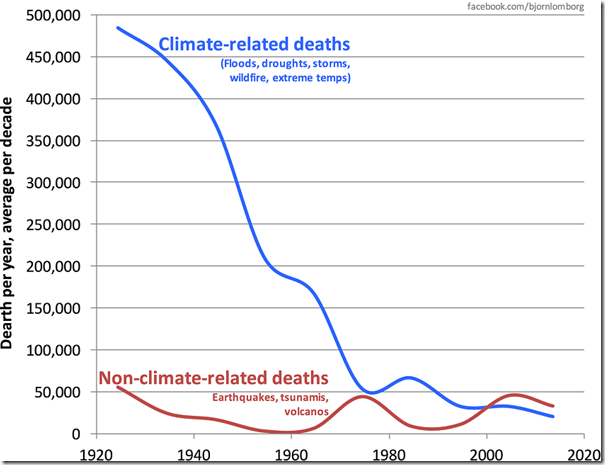
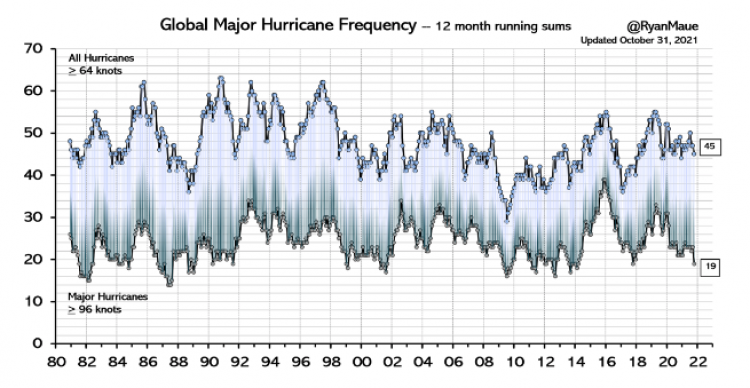

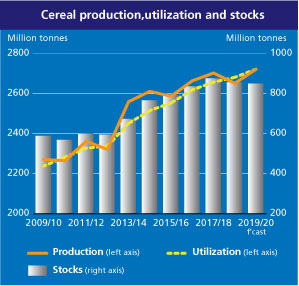


 Science Matters