In today’s hyper-politicized world of climate science, hardly a thunderstorm passes without somebody invoking the “scientists say” trope to blame it on carbon emissions.
The logic seems to be: If it’s bad, it was caused by carbon emissions, and we are only going to see more and worse. More and worse floods, droughts, tornadoes, and of course, hurricanes.
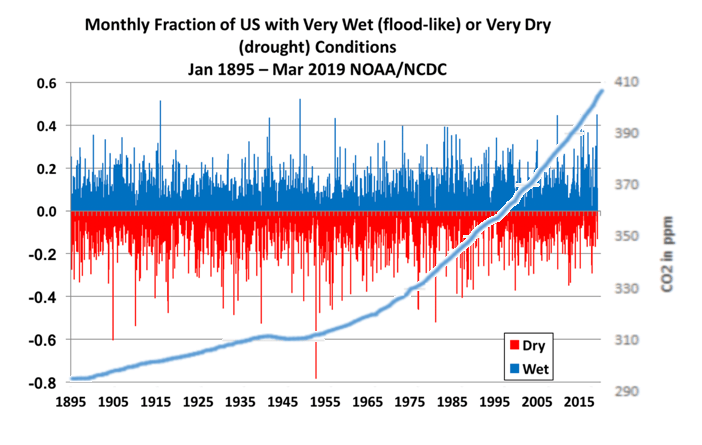
The problem with this argument is that overall, we are not seeing more floods, droughts, tornadoes, or hurricanes in spite of the steady rise in the small amount of carbon dioxide, and in spite of the mild warming of the planet. The data show that there is no significant upward trend in any of these weather events.
These are not the conclusions of climate skeptics. They are conclusions drawn by the Intergovernmental Panel on Climate Change and our own National Oceanic and Atmospheric Administration.
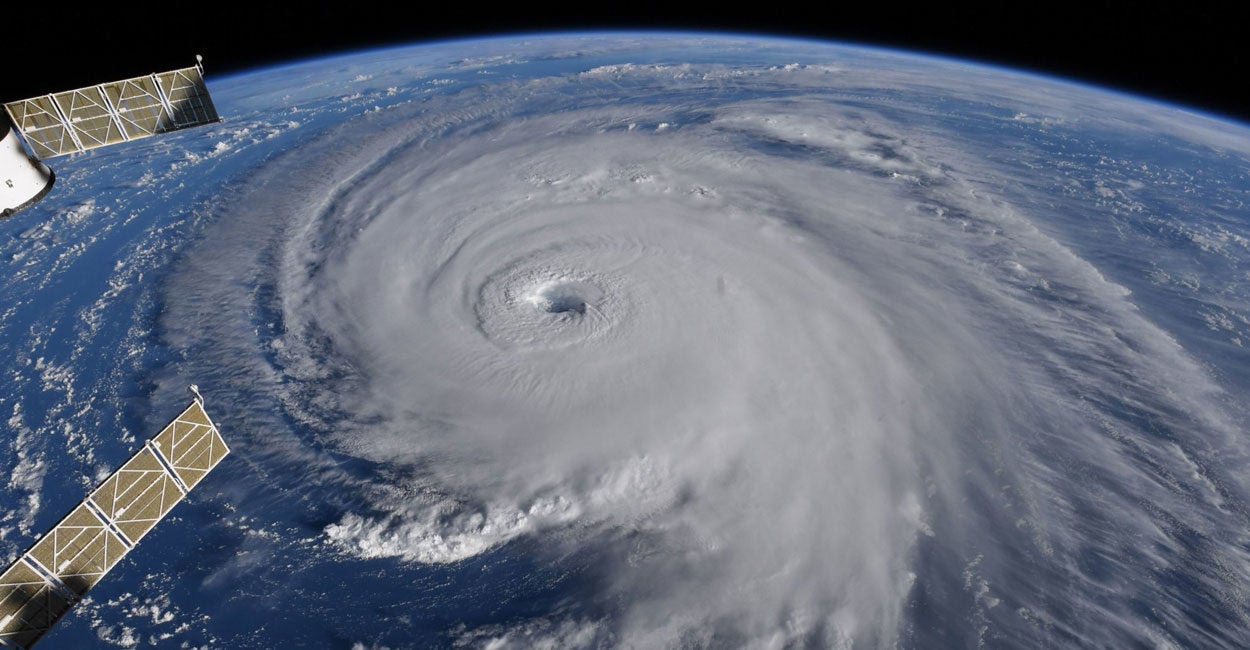
This week, the Carolina coast and some yet-to-be-determined inland counties will endure the heavy and destructive rains of Hurricane Florence. Without a doubt, some places will see records broken.
As the hurricane arrives, talking heads will hit the airwaves claiming that “scientists say” it was caused by carbon emissions. Some may spin it more subtly, saying that while we cannot identify which storms are caused by increased levels of atmospheric carbon dioxide, the storms today are getting stronger and more frequent.
But this simply is not true. We are not seeing more frequent hurricanes, nor are we seeing a greater number of major hurricanes.
The Intergovernmental Panel on Climate Change said as much in its latest science report:
Current data sets indicate no significant observed trends in global tropical cyclone frequency over the past century and it remains uncertain whether any reported long-term increases in tropical cyclone frequency are robust, after accounting for past changes in observing capabilities. … No robust trends in annual numbers of tropical storms, hurricanes, and major hurricanes counts have been identified over the past 100 years in the North Atlantic basin.
Be on the alert for those who quote the Intergovernmental Panel on Climate Change as saying there has been an upward trend in hurricanes since the 1970s. That is a misleading claim. Hurricane landfalls actually fell for the decades before the 1970s.
Cherry-picking endpoints can produce “trends” that are either up or down. The fact is that for the past century, there is no trend.
Furthermore, there was never a time when the climate was stable (as some would claim), when weather events happened with smooth regularity. There have always been cycles—years and decades that included large numbers of hurricanes, and others with few.
Whether carbon dioxide levels rise, fall, or stay the same, we will continue to see hurricanes. Some of these hurricanes will be immensely destructive of both property and human life. Some will break records for wind and/or rain. And they will be tragic.
The fact that tragic weather events have not stopped is not evidence that carbon emissions are leading us to a climate catastrophe. Perhaps we will see a decades-long increase in one category or another, it has happened before—but that will not prove the predictions of catastrophic climate change one way or the other.
Even if all of the mild (though uneven) warming that seems to have occurred over the past century were due to man-made carbon emissions, that would still not be a reason to fear for the future. The overall story does not point to climate catastrophe.
But weather catastrophes will continue to strike, and we will still face the danger wrought by nature’s wrath. Hurricane Florence is shaping up to be exactly such a storm.
Unlike temperature, rainfall varies hugely in space and time. Even the most sophisticated climate models struggle to simulate physical processes such as convection and evaporation that drive rainfall activity. On top of that, global warming is not expected to change the frequency and intensity of rainfall extremes in the same way in all parts of the world.
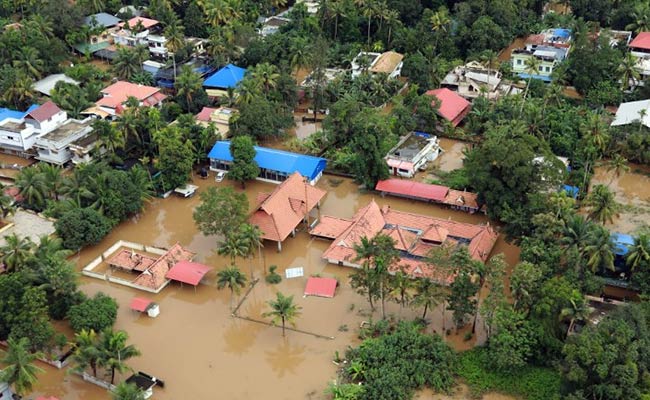
The choice to focus solely on the rainfall itself is particularly relevant for flooding events. Though accusations of poor decision-making and mismanagement of water resources are beginning to appear in the Kerala aftermath, the floods simply would not have occurred without a significant amount of rain. Few of those suffering lost homes and livelihoods are likely to care much about where the rain came from or the intricacies of the weather conditions that led to it.
Disentangling these contributory factors takes time. In comparison to droughts and heatwaves, short-term hazards such as floods do not usually give us much chance to report concrete findings while the media and general public are still engaged in the event. In-depth studies may not publish their results for many months, sometimes even years after the event in question.
Many of these issues are not exclusive to extreme rainfall. The excellent US National Academies report on Attribution of Extreme Weather Events in the Context of Climate Change describes the shortcomings in our efforts to attribute a variety of extremes. But for rainfall in particular there is a discrepancy between what we understand about the general effect of global warming and our rather lesser ability to quantify the climate change fingerprint on specific events.
2017 Hurricane Harvey X-Weathermen Event
With Hurricane Harvey making landfall in Texas as a Cat 4, the storm drought is over and claims of linkage to climate change can be expected. So far (mercifully) articles in Time and Washington Post have been more circumspect than in the past. Has it become more respectable to look at the proof supporting wild claims? This post provides background on X-Weathermen working hard to claim extreme weather as proof of climate change.
In the past the media has been awash with claims of “human footprints” in extreme weather events, with headlines like these:
“Global warming is making hot days hotter, rainfall and flooding heavier, hurricanes stronger and droughts more severe.”
“Global climate change is making weather worse over time”
“Climate change link to extreme weather easier to gauge”– U.S. Report
“Heat Waves, Droughts and Heavy Rain Have Clear Links to Climate Change, Says National Academies”
That last one refers to a paper released by the National Academy of Sciences Press: Attribution of Extreme Weather Events in the Context of Climate Change (2016)
And as usual, the headline claims are unsupported by the actual text. From the NAS report (here): (my bolds)
Attribution studies of individual events should not be used to draw general conclusions about the impact of climate change on extreme events as a whole. Events that have been selected for attribution studies to date are not a representative sample (e.g., events affecting areas with high population and extensive infrastructure will attract the greatest demand for information from stakeholders) P 107
Systematic criteria for selecting events to be analyzed would minimize selection bias and permit systematic evaluation of event attribution performance, which is important for enhancing confidence in attribution results. Studies of a representative sample of extreme events would allow stakeholders to use such studies as a tool for understanding how individual events fit into the broader picture of climate change. P 110
Correctly done, attribution of extreme weather events can provide an additional line of evidence that demonstrates the changing climate, and its impacts and consequences. An accurate scientific understanding of extreme weather event attribution can be an additional piece of evidence needed to inform decisions on climate change related actions. P. 112
The Indicative Without the Imperative
The antidote to such feverish reporting is provided by Mike Hulme in a publication: Attributing Weather Extremes to ‘Climate Change’: a Review (here).
He has an insider’s perspective on this issue, and is certainly among the committed on global warming (color him concerned). Yet here he writes objectively to inform us on X-weather, without advocacy: real science journalism and a public service, really. Excerpts below with my bolds.
Overview
In this third and final review I survey the nascent science of extreme weather event attribution. The article proceeds by examining the field in four stages: motivations for extreme weather attribution, methods of attribution, some example case studies and the politics of weather event Attribution.
The X-Weather Issue
As many climate scientists can attest, following the latest meteorological extreme one of the most frequent questions asked by media journalists and other interested parties is: ‘Was this weather event caused by climate change?’
In recent decades the meaning of climate change in popular western discourse has changed from being a descriptive index of a change in climate (as in ‘evidence that a climatic change has occurred’) to becoming an independent causative agent (as in ‘climate change caused this event to happen’). Rather than being a descriptive outcome of a chain of causal events affecting how weather is generated, climate change has been granted power to change worlds: political and social worlds as much as physical and ecological ones.
To be more precise then, what people mean when they ask the ‘extreme weather blame’ question is: ‘Was this particular weather event caused by greenhouse gases emitted from human activities and/or by other human perturbations to the environment?’ In other words, can this meteorological event be attributed to human agency as opposed to some other form of agency?
The Motivations
Hulme shows what drives scientists to pursue the “extreme weather blame” question, noting four motivational factors.
Why have climate scientists over the last ten years embarked upon research to provide an answer beyond the stock phrase ‘no individual weather event can directly be attributed to greenhouse gas emissions’? There seem to be four possible motives.
1.Curiosity The first is because the question piques the scientific mind; it acts as a spur to develop new rational understanding of physical processes and new analytic methods for studying them.
2.Adaptation A second argument, put forward by some, is that it is important to know whether or not specific instances of extreme weather are human-caused in order to improve the justification, planning and execution of climate adaptation.
3.Liability A third argument for pursuing an answer to the ‘extreme weather blame’ question is inspired by the possibility of pursuing legal liability for damages caused. . . If specific loss and damage from extreme weather can be attributed to greenhouse gas emissions – even if expressed in terms of increased risk rather than deterministically – then lawyers might get interested.
The liability motivation for research into weather event attribution also bisects the new international political agenda of ‘loss and damage’ which has emerged in the last two years. . . The basic idea is to give recognition that loss and damage caused by climate change is legitimate ground for less developed countries to gain access to new international climate adaptation funds.
4. Persuasion A final reason for scientists to be investing in this area of climate science – a reason stated explicitly less often than the ones above and yet one which underlies much of the public interest in the ‘extreme weather blame’ question – is frustration with and argument about the invisibility of climate change. . . If this is believed to be true – that only scientists can make climate change visible and real –then there is extra onus on scientists to answer the ‘extreme weather blame’ question as part of an effort to convince citizens of the reality of human-caused climate change.
Attribution Methods
Attributing extreme weather events to human influences requires different approaches, of which four broad categories can be identified.
1. Physical Reasoning The first and most general approach to attributing extreme weather phenomena to rising greenhouse gas concentrations is to use simple physical reasoning.
General physical reasoning can only lead to broad qualitative statements such as ‘this extreme weather is consistent with’ what is known about the human-enhanced greenhouse effect. Such statements offer neither deterministic nor stochastic answers and clearly underdetermine the ‘weather blame question.’ It has given rise to a number of analogies to try to communicate the non-deterministic nature of extreme event attribution. The three most widely used ones concern a loaded die (the chance of rolling a ‘6’ has increased, but no single ‘6’ can be attributed to the biased die), the baseball player on steroids (the number of home runs hit increases, but no single home run can be attributed to the steroids) and the speeding car-driver (the chance of an accident increases in dangerous conditions, but no specific accident can be attributed to the fast-driving).
2. Classical Statistical Analysis A second approach is to use classical statistical analysis of meteorological time series data to determine whether a particular weather (or climatic) extreme falls outside the range of what a ‘normal’ unperturbed climate might have delivered.
All such extreme event analyses of meteorological time series are at best able to detect outliers, but can never be decisive about possible cause(s). A different time series approach therefore combines observational data with model simulations and seeks to determine whether trends in extreme weather predicted by climate models have been observed in meteorological statistics (e.g. Zwiers et al., 2011, for temperature extremes and Min et al., 2011, for precipitation extremes). This approach is able to attribute statistically a trend in extreme weather to human influence, but not a specific weather event. Again, the ‘weather blame question’ remains underdetermined.
3. Fractional Attributable Risk (FAR) Taking inspiration from the field of epidemiology, this method seeks to establish the Fractional Attributable Risk (FAR) of an extreme weather (or short-term climate) event. It asks the counterfactual question, ‘How might the risk of a weather event be different in the presence of a specific causal agent in the climate system?’
The single observational record available to us, and which is analysed in the statistical methods described above, is inadequate for this task. The solution is to use multiple model simulations of the climate system, first of all without the forcing agent(s) accused of ‘causing’ the weather event and then again with that external forcing introduced into the model.
The credibility of this method of weather attribution can be no greater than the overall credibility of the climate model(s) used – and may be less, depending on the ability of the model in question to simulate accurately the precise weather event under consideration at a given scale (e.g. a heatwave in continental Europe, a rain event in northern Thailand) (see Christidis et al., 2013a).
4. Eco-systems Philosophy A fourth, more philosophical, approach to weather event attribution should also be mentioned. This is the argument that since human influences on the climate system as a whole are now clearly established – through changing atmospheric composition, altered land surface characteristics, and so on – there can no longer be such a thing as a purely natural weather event. All weather — whether it be a raging tempest or a still summer afternoon — is now attributable to human influence, at least to some extent. Weather is the local and momentary expression of a complex system whose functioning as a system is now different to what it would otherwise have been had humans not been active.
Results from Weather Attribution Studies
Hulme provides a table of numerous such studies using various methods, along with his view of the findings.
It is likely that attribution of temperature-related extremes using FAR methods will always be more attainable than for other meteorological extremes such as rainfall and wind, which climate models generally find harder to simulate faithfully at the spatial scales involved. As discussed below, this limitation on which weather events and in which regions attribution studies can be conducted will place important constraints on any operational extreme weather attribution system.
Political Dimensions of Weather Attribution
Hulme concludes by discussing the political hunger for scientific proof in support of policy actions.
But Hulme et al. (2011) show why such ambitious claims are unlikely to be realised. Investment in climate adaptation, they claim, is most needed “… where vulnerability to meteorological hazard is high, not where meteorological hazards are most attributable to human influence” (p.765). Extreme weather attribution says nothing about how damages are attributable to meteorological hazard as opposed to exposure to risk; it says nothing about the complex political, social and economic structures which mediate physical hazards.
And separating weather into two categories — ‘human-caused’ weather and ‘tough-luck’ weather – raises practical and ethical concerns about any subsequent investment allocation guidelines which excluded the victims of ‘tough-luck weather’ from benefiting from adaptation funds.
Contrary to the claims of some weather attribution scientists, the loss and damage agenda of the UNFCCC, as it is currently emerging, makes no distinction between ‘human-caused’ and ‘tough-luck’ weather. “Loss and damage impacts fall along a continuum, ranging from ‘events’ associated with variability around current climatic norms (e.g., weather-related natural hazards) to [slow-onset] ‘processes’ associated with future anticipated changes in climatic norms” (Warner et al., 2012:21). Although definitions and protocols have not yet been formally ratified, it seems unlikely that there will be a role for the sort of forensic science being offered by extreme weather attribution science.
Conclusion
Thank you Mike Hulme for a sane, balanced and expert analysis. It strikes me as being another element in a “Quiet Storm of Lucidity”.
Is that light the end of the tunnel or an oncoming train?
It has been a changeable and at times extreme spring and summer. The cold and snow of March gave way to a cold April and some very chilly days well into the spring. Warmth with some very hot days followed in the early to mid summer. Then the rains came with strong thunderstorms. The wet August spell put an end to a borderline drought spell the last few years. It became very muggy, keeping nighttime temperatures up and air conditioners on.
The changes all have to do with the wind direction. The jet stream brought chilly air masses (and snow) into eastern Canada even into June. The winds around these cool air masses turn to the northeast here in New England coming in off cool land and water. Then increasingly warm air masses built north into the Canadian prairies and came east. The surface winds turned northwesterly. In summer, warm air crossing the Appalachians and sinking down into the Merrimack Valley and coast heats by compression 5F or more. Our hottest days come with these ‘downslope winds’. Historically all the 100F days come with a west to northwest wind.
When late July and August came, our surface winds turned southwesterly.
This change was caused by a sharp cooling of the subtropical Atlantic Ocean waters relative to 2017.
The Atlantic cool subtropical pattern leads to that stronger than normal Atlantic high pressure called the ‘Bermuda High’. In these patterns, this regular feature of our climate expands south and west and acts as a pump for moisture much like we see in the southeastern and eastern Asia monsoon flow. This causes nights to be warm and muggy, and days very warm and showery here in the east.
Uncomfortable yes, unprecedented heat no. You may be surprised that most of the extreme heat records for the region, country and world occurred in the early 20th century or earlier. The 1930s was the record decade in the United States as a whole. For the east, the 1950s was the warmest but extreme heat has occurred even in cold periods.
Summary: Effect on the Hurricane Season
As a general rule, when the subtropical Atlantic is warm, we have more hurricane activity, when it is cool, we have fewer storms.
It is often said that truth is the first casualty in the fog of war. That is especially true of the war against fossil fuels and smoke from wildfires. The forests are burning in California, Oregon and Washington, all of them steeped in liberal, progressive and post-modern ideology. There are human reasons that fires are out of control in those places, and it is not due to CO2 emissions. As we shall see, Zinke is right and Brown is wrong. Some truths the media are not telling you in their drive to blame global warming/climate change. Text below is excerpted from sources linked at the end.
1. The World and the US are not burning.
The geographic extent of this summer’s forest fires won’t come close to the aggregate record for the U.S. Far from it. Yes, there are some terrible fires now burning in California, Oregon, and elsewhere, and the total burnt area this summer in the U.S. is likely to exceed the 2017 total. But as the chart above shows, the burnt area in 2017 was less than 20% of the record set way back in 1930. The same is true of the global burnt area, which has declined over many decades.
“Analysis of charcoal records in sediments [31] and isotope-ratio records in ice cores [32] suggest that global biomass burning during the past century has been lower than at any time in the past 2000 years. Although the magnitude of the actual differences between pre-industrial and current biomass burning rates may not be as pronounced as suggested by those studies [33], modelling approaches agree with a general decrease of global fire activity at least in past centuries [34]. In spite of this, fire is often quoted as an increasing issue around the globe [11,26–29].”
People have a tendency to exaggerate the significance of current events. Perhaps the youthful can be forgiven for thinking hot summers are a new phenomenon. Incredibly, more “seasoned” folks are often subject to the same fallacies. The fires in California have so impressed climate alarmists that many of them truly believe global warming is the cause of forest fires in recent years, including the confused bureaucrats at Cal Fire, the state’s firefighting agency. Of course, the fires have given fresh fuel to self-interested climate activists and pressure groups, an opportunity for greater exaggeration of an ongoing scare story.
This year, however, and not for the first time, a high-pressure system has been parked over the West, bringing southern winds up the coast along with warmer waters from the south, keeping things warm and dry inland. It’s just weather, though a few arsonists and careless individuals always seem to contribute to the conflagrations. Beyond all that, the impact of a warmer climate on the tendency for biomass to burn is considered ambiguous for realistic climate scenarios.
2. Public forests are no longer managed due to litigation.
According to a 2014 white paper titled; ‘Twenty Years of Forest Service Land Management Litigation’, by Amanda M.A. Miner, Robert W. Malmsheimer, and Denise M. Keele: “This study provides a comprehensive analysis of USDA Forest Service litigation from 1989 to 2008. Using a census and improved analyses, we document the final outcome of the 1125 land management cases filed in federal court. The Forest Service won 53.8% of these cases, lost 23.3%, and settled 22.9%. It won 64.0% of the 669 cases decided by a judge based on cases’ merits. The agency was more likely to lose and settle cases during the last six years; the number of cases initiated during this time varied greatly. The Pacific Northwest region along with the Ninth Circuit Court of Appeals had the most frequent occurrence of cases. Litigants generally challenged vegetative management (e.g. logging) projects, most often by alleging violations of the National Environmental Policy Act and the National Forest Management Act. The results document the continued influence of the legal system on national forest management and describe the complexity of this litigation.”
There is abundant evidence to support the position that when any forest project posits vegetative management in forests as a pretense for a logging operation, salvage or otherwise, litigation is likely to ensue, and in addition to NEPA, the USFS uses the Property Clause to address any potential removal of ‘forest products’. Nevertheless, the USFS currently spends more than 50% of its total budget on wildfire suppression alone; about $1.8 billion annually, while there is scant spending for wildfire prevention.
3. Mega fires are the unnatural result of fire suppression.
And what of the “mega-fires” burning in the West, like the huge Mendocino Complex Fire and last year’s Thomas Fire? Unfortunately, many decades of fire suppression measures — prohibitions on logging, grazing, and controlled burns — have left the forests with too much dead wood and debris, especially on public lands. From the last link:
“Oregon, like much of the western U.S., was ravaged by massive wildfires in the 1930s during the Dust Bowl drought. Megafires were largely contained due to logging and policies to actively manage forests, but there’s been an increasing trend since the 1980s of larger fires.
Active management of the forests and logging kept fires at bay for decades, but that largely ended in the 1980s over concerns too many old growth trees and the northern spotted owl. Lawsuits from environmental groups hamstrung logging and government planners cut back on thinning trees and road maintenance.
[Bob] Zybach [a forester] said Native Americans used controlled burns to manage the landscape in Oregon, Washington and northern California for thousands of years. Tribes would burn up to 1 million acres a year on the west coast to prime the land for hunting and grazing, Zybach’s research has shown.
‘The Indians had lots of big fires, but they were controlled,’ Zybach said. ‘It’s the lack of Indian burning, the lack of grazing’ and other active management techniques that caused fires to become more destructive in the 19th and early 20th centuries before logging operations and forest management techniques got fires under control in the mid-20th Century.”
4. Bad federal forest administration started in 1990s.
Bob Zybach feels like a broken record. Decades ago he warned government officials allowing Oregon’s forests to grow unchecked by proper management would result in catastrophic wildfires.
While some want to blame global warming for the uptick in catastrophic wildfires, Zybach said a change in forest management policies is the main reason Americans are seeing a return to more intense fires, particularly in the Pacific Northwest and California where millions of acres of protected forests stand.
“We knew exactly what would happen if we just walked away,” Zybach, an experienced forester with a PhD in environmental science, told The Daily Caller News Foundation.
Zybach spent two decades as a reforestation contractor before heading to graduate school in the 1990s. Then the Clinton administration in 1994 introduced its plan to protect old growth trees and spotted owls by strictly limiting logging. Less logging also meant government foresters weren’t doing as much active management of forests — thinnings, prescribed burns and other activities to reduce wildfire risk.
Zybach told Evergreen magazine that year the Clinton administration’s plan for “naturally functioning ecosystems” free of human interference ignored history and would fuel “wildfires reminiscent of the Tillamook burn, the 1910 fires and the Yellowstone fire.”
Between 1952 and 1987, western Oregon saw only one major fire above 10,000 acres. The region’s relatively fire-free streak ended with the Silver Complex Fire of 1987 that burned more than 100,000 acres in the Kalmiopsis Wilderness area, torching rare plants and trees the federal government set aside to protect from human activities. The area has burned several more times since the 1980s.
“Mostly fuels were removed through logging, active management — which they stopped — and grazing,” Zybach said in an interview. “You take away logging, grazing and maintenance, and you get firebombs.”
Now, Oregonians are dealing with 13 wildfires engulfing 185,000 acres. California is battling nine fires scorching more than 577,000 acres, mostly in the northern forested parts of the state managed by federal agencies.
The Mendocino Complex Fire quickly spread to become the largest wildfire in California since the 1930s, engulfing more than 283,000 acres. The previous wildfire record was set by 2017’s Thomas Fire that scorched 281,893 acres in Southern California.
While bad fires still happen on state and private lands, most of the massive blazes happen on or around lands managed by the U.S. Forest Service and other federal agencies, Zybach said. Poor management has turned western forests into “slow-motion time bombs,” he said.
A feller buncher removing small trees that act as fuel ladders and transmit fire into the forest canopy.
5. True environmentalism is not nature love, but nature management.
While wildfires do happen across the country, poor management by western states has served to turn entire regions into tinderboxes. By letting nature play out its course so close to civilization, this is the course California and Oregon have taken.
Many in heartland America and along the Eastern Seaboard often see logging and firelines if they travel to a rural area. This is part and parcel of life outside of the city, where everyone knows that because of a few minor eyesores their houses and communities are safer from the primal fury of wildfires.
In other words, leaving the forests to “nature,” and protecting the endangered Spotted Owl created denser forests––300-400 trees per acre rather than 50-80–– with more fuel from the 129 million diseased and dead trees that create more intense and destructive fires. Yet California spends more than ten times as much money on electric vehicle subsidies ($335 million) than on reducing fuel in a mere 60,000 of 33 million acres of forests ($30 million).
Rancher Ross Frank worries that funding to fight fires in Western communities like Chumstick, Wash., has crowded out important land management work. Rowan Moore Gerety/Northwest Public Radio
Once again, global warming “science” is a camouflage for political ideology and gratifying myths about nature and human interactions with it. On the one hand, progressives seek “crises” that justify more government regulation and intrusion that limit citizen autonomy and increase government power. On the other, well-nourished moderns protected by technology from nature’s cruel indifference to all life can afford to indulge myths that give them psychic gratification at little cost to their daily lives.
As usual, bad cultural ideas lie behind these policies and attitudes. Most important is the modern fantasy that before civilization human beings lived in harmony and balance with nature. The rise of cities and agriculture began the rupture with the environment, “disenchanting” nature and reducing it to mere resources to be exploited for profit. In the early 19thcentury, the growth of science that led to the industrial revolution inspired the Romantic movement to contrast industrialism’s “Satanic mills” and the “shades of the prison-house,” with a superior natural world and its “beauteous forms.” In an increasingly secular age, nature now became the Garden of Eden, and technology and science the signs of the fall that has banished us from the paradise enjoyed by humanity before civilization.
The untouched nature glorified by romantic environmentalism, then, is not our home. Ever since the cave men, humans have altered nature to make it more conducive to human survival and flourishing. After the retreat of the ice sheets changed the environment and animal species on which people had depended for food, humans in at least four different regions of the world independently invented agriculture to better manage the food supply. Nor did the American Indians, for example, live “lightly on the land” in a pristine “forest primeval.” They used fire to shape their environment for their own benefit. They burned forests to clear land for cultivation, to create pathways to control the migration of bison and other game, and to promote the growth of trees more useful for them.
Remaining trees and vegetation on the forest floor are more vigorous after removal of small trees for fuels reduction.
And today we continue to improve cultivation techniques and foods to make them more reliable, abundant, and nutritious, not to mention more various and safe. We have been so successful at managing our food supply that today one person out of ten provides food that used to require nine out of ten, obesity has become the plague of poverty, and famines result from political dysfunction rather than nature.
That’s why untouched nature, the wild forests filled with predators, has not been our home. The cultivated nature improved by our creative minds has. True environmentalism is not nature love, but nature management: applying skill and technique to make nature more useful for humans, at the same time conserving resources so that those who come after us will be able to survive. Managing resources and exploiting them for our benefit without destroying them is how we should approach the natural world. We should not squander resources or degrade them, not because of nature, but because when we do so, we are endangering the well-being of ourselves and future generations.
Conclusion
The annual burnt area from wildfires has declined over the past ninety years both in the U.S. and globally. Even this year’s wildfires are unlikely to come close to the average burn extent of the 1930s. The large wildfires this year are due to a combination of decades of poor forest management along with a weather pattern that has trapped warm, dry air over the West. The contention that global warming has played a causal role in the pattern is balderdash, but apparently that explanation seems plausible to the uninformed, and it is typical of the propaganda put forward by climate change interests.
Deaths Classified as “Heat-Related” in the United States, 1979–2014. Source: EPA
The number of deaths from heat wavescould increase by up to 2,000 percent in some areas of the world by 2080, according to a new study released Tuesday by researchers at Monash University in Melbourne, Australia.
“Future heat waves in particular will be more frequent, more intense and will last much longer,” Yuming Guo, the study’s lead researcher, said in a Tuesday statement to Reuters. “If we cannot find a way to mitigate the climate change (reduce the heat wave days) and help people adapt to heat waves, there will be a big increase of heat wave-related deaths in the future.”
The researchers developed a model to predict the number of deaths caused by heatwaves in 412 communities in 20 countries on four continents between 2031 and 2080.
The study predicted mortality caused by heat waves under different scenarios that take into account levels of greenhouse gas emissions, population density and adaptation strategies.
“We estimated heat wave-mortality associations through a two-stage time series design,” the report, which was published in PLOS Medicine, stated.
“Current and future daily mean temperature series were projected under four scenarios of greenhouse gas emissions from 1971 — 2099… We projected excess mortality in relation to heat waves in the future under each scenario of greenhouse gas emissions, with two assumptions for adaptation (no adaptation and hypothetical adaptation) and three scenarios of population change (high variant, median variant and low variant).”
The findings stated that the increase in mortality caused by heat waves is expected to be highest near the equator. Countries in that area are projected see a 2,000 percent increase in heat wave-related fatalities from 2031 to 2080, compared to the 1971 to 2020 span.
“If people cannot adapt to future climate change, heat wave-related excess mortality is expected to increase the most in tropical and subtropical countries/regions, while European countries and the United States will have smaller increases. The more serious the greenhouse gas emissions, the higher the heat wave-related excess mortality in the future,” concluded the study.
Even if people do adapt to future climate change, heat wave-related deaths would still increase in the future under the high-variant population and serious greenhouse gas emissions situations. The projected increase in mortality is much smaller, however, than in the no-adaptation cases.
• We analysed daily mortality records from 47 major cities in Spain.
• There has been a general and sustained decline in the vulnerability of the population since 1980.
• Despite the observed warming, the decline of the vulnerability has generally contributed to a progressive reduction in the number of deaths attributed to heat since 1980.
Fred Magdoff, professor emeritus of plant and soil science at the University of Vermont and co-author of “What Every Environmentalist Needs to Know About Capitalism” and “Creating an Ecological Society: Toward a Revolutionary Transformation,” told Sputnik Wednesday that the increase in heat waves will not only affect poorer countries that are close to the equator, but also countries like Japan. (Note: Magdoff is not related to Bernie Madoff, who made off with 65 billion US$ by bilking investors.)
“Although the poor countries will have more problems with this, it also affects the north — Japan hit an all time high of 106 degrees F, and there are heat waves in Europe and the US. Clearly those in the wealthier countries are able to deal with this better, either through home air conditioning or access to ‘cooling stations,'” Magdoff told Sputnik.
“The carbon dioxide level in the atmosphere is currently about 410 ppm (it was around 320 in the 1950s), and in a relatively few decades it will reach 450, assuming current trends persist. After that, global warming may actually increase faster. Thus, I am not too surprised about the prediction for 2080 — not a pretty picture indeed. It will be awful,” Magdoff added.
According to the study, adaptation strategies to reduce greenhouse gas emissions are necessary, including opening cooling centers and painting rooftops white to reflect sunlight.
Footnote: A previous post celebrated the fact that heat wave hysteria was muted this year. Obviously, that didn’t last very long.
“World to burn up; Women, minorities and the poor to be hardest hit.”
Enjoy this wonderful hot summertime while it lasts. Don’t let the climate grinches get you down with their doomsday pronouncements. Chill out with Sunshine Reggae and let the good vibes get a lot stronger.
Alarms are being sounded about heat waves in the Northern Hemisphere, noting heat waves in Eastern Canada and US, wildfires in N. Sweden and Siberia. The recent UK lawsuit featured the advocate claiming the Arctic is burning, so global warming is no longer in doubt. Thus UK needs to up its carbon reduction targets.
The High Court disagreed. And for good reasons not cited by the judge. The hot dry weather this summer in Siberia was preceded by extreme cold and massive snowfall, unusual winter conditions even for that climate zone. Similarly, there have been cold winters across Eurasia, while Northern Europe enjoys a BBQ summer. BTW, I recall seeing on TV May and June tennis matches in Spain where spectators were wearing jackets and head covering against the cold.
What is going on? Fact: Concurrent warm summers and cold winters are a feature of the North Atlantic climate system. It has gone on periodically throughout history, and long before humans burned fossil fuels. Below is evidence providing insight into our present experience of 2018 weather.
Concurrent Warming and Cooling
This post highlights recent interesting findings regarding past climate change in NH, Scotland in particular. The purpose of the research was to better understand how glaciers could be retreating during the Younger Dryas Stadia (YDS), one of the coldest periods in our Holocene epoch.
The lead researcher is Gordon Bromley, and the field work was done on site of the last ice fields on the highlands of Scotland. 14C dating was used to estimate time of glacial events such as vegetation colonizing these places. Bromely explains in article Shells found in Scotland rewrite our understanding of climate change at siliconrepublic. Excerpts in italics with my bolds.
By analysing ancient shells found in Scotland, the team’s data challenges the idea that the period was an abrupt return to an ice age climate in the North Atlantic, by showing that the last glaciers there were actually decaying rapidly during that period.
The shells were found in glacial deposits, and one in particular was dated as being the first organic matter to colonise the newly ice-free landscape, helping to provide a minimum age for the glacial advance. While all of these shell species are still in existence in the North Atlantic, many are extinct in Scotland, where ocean temperatures are too warm.
This means that although winters in Britain and Ireland were extremely cold, summers were a lot warmer than previously thought, more in line with the seasonal climates of central Europe.
“There’s a lot of geologic evidence of these former glaciers, including deposits of rubble bulldozed up by the ice, but their age has not been well established,” said Dr Gordon Bromley, lead author of the study, from NUI Galway’s School of Geography and Archaeology.
“It has largely been assumed that these glaciers existed during the cold Younger Dryas period, since other climate records give the impression that it was a cold time.”
He continued: “This finding is controversial and, if we are correct, it helps rewrite our understanding of how abrupt climate change impacts our maritime region, both in the past and potentially into the future.”
Establishing the atmospheric expression of abrupt climate change during the last glacial termination is key to understanding driving mechanisms. In this paper, we present a new 14C chronology of glacier behavior during late‐glacial time from the Scottish Highlands, located close to the overturning region of the North Atlantic Ocean. Our results indicate that the last pulse of glaciation culminated between ~12.8 and ~12.6 ka, during the earliest part of the Younger Dryas stadial and as much as a millennium earlier than several recent estimates. Comparison of our results with existing minimum‐limiting 14C data also suggests that the subsequent deglaciation of Scotland was rapid and occurred during full stadial conditions in the North Atlantic. We attribute this pattern of ice recession to enhanced summertime melting, despite severely cool winters, and propose that relatively warm summers are a fundamental characteristic of North Atlantic stadials.
Plain Language Summary
Geologic data reveal that Earth is capable of abrupt, high‐magnitude changes in both temperature and precipitation that can occur well within a human lifespan. Exactly what causes these potentially catastrophic climate‐change events, however, and their likelihood in the near future, remains frustratingly unclear due to uncertainty about how they are manifested on land and in the oceans. Our study sheds new light on the terrestrial impact of so‐called “stadial” events in the North Atlantic region, a key area in abrupt climate change. We reconstructed the behavior of Scotland’s last glaciers, which served as natural thermometers, to explore past changes in summertime temperature. Stadials have long been associated with extreme cooling of the North Atlantic and adjacent Europe and the most recent, the Younger Dryas stadial, is commonly invoked as an example of what might happen due to anthropogenic global warming. In contrast, our new glacial chronology suggests that the Younger Dryas was instead characterized by glacier retreat, which is indicative of climate warming. This finding is important because, rather than being defined by severe year‐round cooling, it indicates that abrupt climate change is instead characterized by extreme seasonality in the North Atlantic region, with cold winters yet anomalously warm summers.
Significance: As a principal component of global heat transport, the North Atlantic Ocean also is susceptible to rapid disruptions of meridional overturning circulation and thus widely invoked as a cause of abrupt climate variability in the Northern Hemisphere. We assess the impact of one such North Atlantic cold event—the Younger Dryas Stadial—on an adjacent ice mass and show that, rather than instigating a return to glacial conditions, this abrupt climate event was characterized by deglaciation. We suggest this pattern indicates summertime warming during the Younger Dryas, potentially as a function of enhanced seasonality in the North Atlantic.
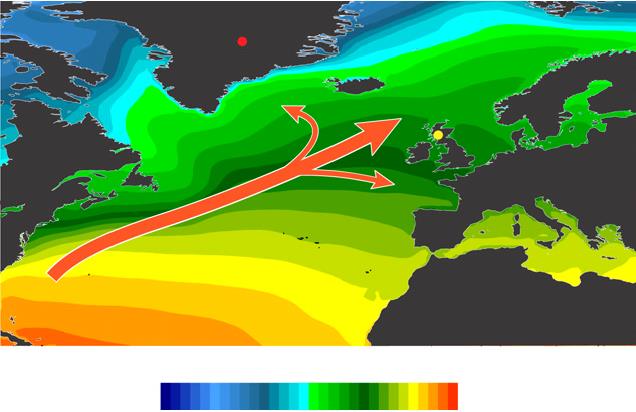
Surface temperatures range from -30C to +30C
Fig. 1. Surface temperature and heat transport in the North Atlantic Ocean. The relatively mild European climate is sustained by warm sea-surface temperatures and prevailing southwesterly airflow in the North Atlantic Ocean (NAO), with this ameliorating effect being strongest in maritime regions such as Scotland. Mean annual temperature (1979 to present) at 2 m above surface (image obtained using University of Maine Climate Reanalyzer, http://www.cci-reanalyzer.org). Locations of Rannoch Moor and the GISP2 ice core are indicated.
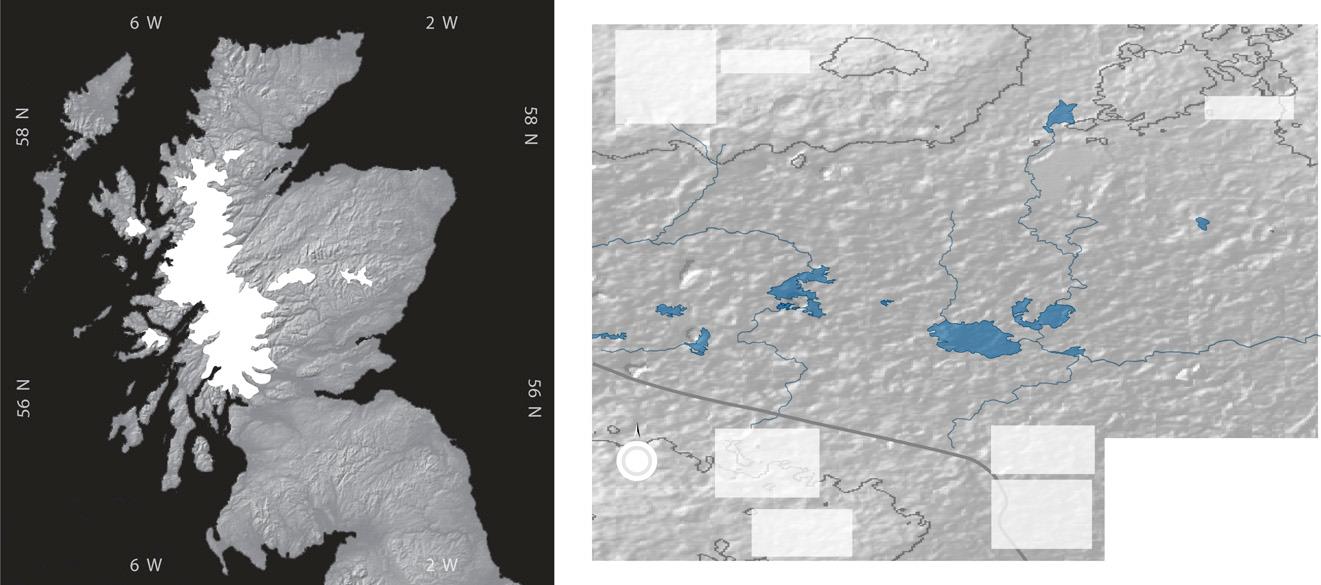
Thus the Scottish glacial record is ideal for reconstructing late glacial variability in North Atlantic temperature (Fig. 1). The last glacier resurgence in Scotland—the “Loch Lomond Advance” (LLA)—culminated in a ∼9,500-km2 ice cap centered over Rannoch Moor (Fig. 2A) and surrounded by smaller ice fields and cirque glaciers.
Fig. 2. Extent of the LLA ice cap in Scotland and glacial geomorphology of western Rannoch Moor. (A) Maximum extent of the ∼9,500 km2 LLA ice cap and larger satellite ice masses, indicating the central location of Rannoch Moor. Nunataks are not shown. (B) Glacial-geomorphic map of western Rannoch Moor. Distinct moraine ridges mark the northward active retreat of the glacier margin (indicated by arrow) across this sector of the moor, whereas chaotic moraines near Lochan Meall a’ Phuill (LMP) mark final stagnation of ice. Core sites are shown, including those (K1–K3) of previous investigations (14, 15).
When did the LLA itself occur? We consider two possible resolutions to the paradox of deglaciation during the YDS. First, declining precipitation over Scotland due to gradually increasing North Atlantic sea-ice extent has been invoked to explain the reported shrinkage of glaciers in the latter half of the YDS (18). However, this course of events conflicts with recent data depicting rapid, widespread imposition of winter sea-ice cover at the onset of the YDS (9), rather than progressive expansion throughout the stadial.
Loch Lomond
Furthermore, considering the gradual active retreat of LLA glaciers indicated by the geomorphic record, our chronology suggests that deglaciation began considerably earlier than the mid-YDS, when precipitation reportedly began to decline (18). Finally, our cores contain lacustrine sediments deposited throughout the latter part of the YDS, indicating that the water table was not substantially different from that of today. Indeed, some reconstructions suggest enhanced YDS precipitation in Scotland (24, 25), which is inconsistent with the explanation that precipitation starvation drove deglaciation (26).
We prefer an alternative scenario in which glacier recession was driven by summertime warming and snowline rise. We suggest that amplified seasonality, driven by greatly expanded winter sea ice, resulted in a relatively continental YDS climate for western Europe, both in winter and in summer. Although sea-ice formation prevented ocean–atmosphere heat transfer during the winter months (10), summertime melting of sea ice would have imposed an extensive freshwater cap on the ocean surface (27), resulting in a buoyancy-stratified North Atlantic. In the absence of deep vertical mixing, summertime heating would be concentrated at the ocean surface, thereby increasing both North Atlantic summer sea-surface temperatures (SSTs) and downwind air temperatures. Such a scenario is analogous to modern conditions in the Sea of Okhotsk (28) and the North Pacific Ocean (29), where buoyancy stratification maintains considerable seasonal contrasts in SSTs. Indeed, Haug et al. (30) reported higher summer SSTs in the North Pacific following the onset of stratification than previously under destratified conditions, despite the growing presence of northern ice sheets and an overall reduction in annual SST. A similar pattern is evident in a new SST record from the northeastern North Atlantic, which shows higher summer temperatures during stadial periods (e.g., Heinrich stadials 1 and 2) than during interstadials on account of amplified seasonality (30).
Our interpretation of the Rannoch Moor data, involving the summer (winter) heating (cooling) effects of a shallow North Atlantic mixed layer, reconciles full stadial conditions in the North Atlantic with YDS deglaciation in Scotland. This scenario might also account for the absence of YDS-age moraines at several higher-latitude locations (12, 36–38) and for evidence of mild summer temperatures in southern Greenland (11). Crucially, our chronology challenges the traditional view of renewed glaciation in the Northern Hemisphere during the YDS, particularly in the circum-North Atlantic, and highlights our as yet incomplete understanding of abrupt climate change.
Summary
Several things are illuminated by this study. For one thing, glaciers grow or recede because of multiple factors, not just air temperature. The study noted that glaciers require precipitation (snow) in order to grow, but also melt under warmer conditions. For background on the complexities of glacier dynamics see Glaciermania
Also, paleoclimatology relies on temperature proxies who respond to changes over multicentennial scales at best. C14 brings higher resolution to the table.
Finally, it is interesting to consider climate changing with respect to seasonality. Bromley et al. observe that during Younger Dryas, Scotland shifted from a moderate maritime climate to one with more seasonal extremes like that of inland continental regions. In that light, what should we expect from cooler SSTs in the North Atlantic?
Note also that our modern warming period has been marked by the opposite pattern. Many NH temperature records show slight summer cooling along with somewhat stronger warming in winter, the net being the modest (fearful?) warming in estimates of global annual temperatures. Then of course there are anomalous years like this one where cold winters combine with warm summer periods.
It seems that climate shifts are still events we see through a glass darkly.
Monday, Sept. 18, 2017, GOES East satellite image provided by NASA shows the eye of Hurricane Maria as it nears Dominica and before it struck Puerto Rico. NASA /AP
Links at the end provide more explanation of GWO’s unique model based upon ocean water pulses linked to solar/lunar activities, nothing to do with CO2. Text below from 712News with my bolds.
Global Weather Oscillations (GWO) was cited by news media as the only major hurricane prediction organization that correctly predicted the hyperactive 2017 Atlantic hurricane season from beginning to end, and the destructive United States hurricane landfalls.
The media also noted that when the hurricane season began last year, “nearly every major weather agency predicted a normal 2017 hurricane season – but only Global Weather Oscillations Inc. (GWO) had an accurate forecast” – with a prediction for a destructive hurricane season with 16 named storms, eight hurricanes, four major hurricanes – and 2 major impact hurricanes for the United States.
GWO also predicted the United States would have 6 named storms and 3 hurricanes making landfall in 2017 – and where they would occur. Just as predicted, the U.S. ended up with six named storms and 3 hurricanes. GWO predicted that the Florida Peninsula would break out of their 12-year hurricane drought with a major category 3-4 hurricane making landfall on the south tip of Florida. GWO also predicted that Texas could break out of their 8-year hurricane drought with a landfalling hurricane just above Corpus Christi – and a Category 1 hurricane striking the upper Gulf Coast. The 2017 landfalling hurricanes ended up being – Harvey, Irma and Nate.
Professor David Dilley – senior research and prediction scientist for Global Weather Oscillations – prepares hurricane and tropical storm predictions for 11 zones stretching from New England to Texas. By using Climate Pulse Technology developed by Mr. Dilley, GWO can issue accurate zone predictions for release in January – well before the beginning of the hurricane season.
Professor David Dilley, states that the “Climate Pulse Technology Model” is based on natural rhythm cycles that control hurricane landfall cycles and the position of the Bermuda High Pressure Center. By utilizing this technology, GWO has issued the most accurate predictions by any organization during the past 10 years. The preseason zone predictions are so accurate – updates to the forecasts are not required during the hurricane season. Although GWO does offer special weekly hurricane outlook webinars and tracking webinars when a storm may threaten the United States. GWO is a working partner with the International Hurricane Protection Association – INHPA.
Prediction: 2018 Atlantic Basin Hurricane Season — (includes the Caribbean Sea and Gulf of Mexico)
As predicted by Mr. Dilley and GWO – last year (2017) was the costliest year on record for the United States, and one of the most destructive. Mr. Dilley says that “some United States zones are currently in their strongest hurricane landfall cycle in 40 to 70-years.” This is a Natural Climate Pulse Cycle that produced extremely active and dangerous hurricane conditions in some zones back in the 1930s and 1940s – and is now repeating.
Mr. Dilley predicts that 2018 will be somewhat of a repeat of 2017 – and possibly another record breaker. Although it will be strikingly similar to last year- some hurricane landfalls will occur in different locations this year. You can expect 16 named storms, 8 hurricanes, 4 major hurricanes, potential for 4 United States hurricane landfalls – 2 of which will likely be major impact storms. There is the potential for 6 named storms making United States landfalls. On the average, the entire Atlantic Basin has 12 named storms, 6 hurricanes and 2.7 major hurricanes.
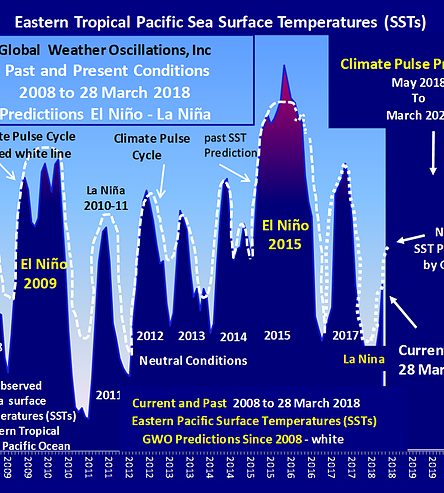
The reason for another destructive hurricane season is 3-fold. The ocean water temperatures continue to run warmer than normal across most of the Atlantic Basin (red and orange in the graphic), and especially in the Caribbean region and the Atlantic near the United States. This is very similar to the ocean temperatures of last year, and this will again be conducive for tropical storms and/or hurricanes forming and/or strengthening close to the United States. Mr. Dilley also expects the Bermuda-Azores High Pressure Center will again be in a favorable location – thus allowing more named storms to maintain strength – or strengthen as they move from east to west across the Atlantic toward the United States.
Source: Global Weather Oscillations
Then we come to the last item – El Niño. GWO’s Climate Pulse Technology model indicates that the Tropical South Pacific Ocean temperatures where El Niño events typically form – will warm significantly during late winter and approach weak El Niño conditions during the spring- much like the El Niño scare of last year. However, all years are not the same – therefore it could mature enough to form a very weak El Niño, but not strong enough to dampen the hurricane season. Historical records indicate that moderate to strong El Nino events dampen hurricane activity – whereas years with very weak El Niño conditions can be associated with active hurricane seasons if a Climate Pulse Hurricane Enhancement Cycle is in place – and it is.
A recent article displays the intersection of fears and facts comprising the climate paradox, in this case the issue of precipitation. Rainfall’s natural variation hides climate change signal appeared today in phys.org by Kate Prestt, Australian National University. Excerpts with my bolds.
New research from The Australian National University (ANU) and ARC Centre of Excellence for Climate System Science suggests natural rainfall variation is so great that it could take a human lifetime for significant climate signals to appear in regional or global rainfall measures.
Even exceptional droughts like those over the Murray Darling Basin (2000-2009) and the 2011 to 2017 Californian drought fit within the natural variations in the long-term precipitation records, according to the statistical method used by the researchers.
This has significant implications for policymakers in the water resources, irrigation and agricultural industries.
“Our findings suggest that for most parts of the world, we won’t be able to recognise long term or permanent changes in annual rainfall driven by climate change until they have already occurred and persisted for some time,” said Professor Michael Roderick from the ANU Research School of Earth Sciences.
“This means those who make decisions around the construction of desalination plants or introduce new policies to conserve water resources will effectively be making these decisions blind.
“Conversely, if they wait and don’t act until the precipitation changes are recognised they will be acting too late. It puts policymakers in an invidious position.”
To get their results the researchers first tested the statistical approach on the 244-year-long observational record of precipitation at the Radcliffe Observatory in Oxford, UK. They compared rainfall changes over 30-year-intervals. They found any changes over each interval were indistinguishable from random or natural variation.
They then applied the same process to California, which has a record going back to 1895, and the Murray Darling Basin from 1901-2007. In both cases the long dry periods seem to fit within expected variations.
Finally, they applied the process to reliable global records that extended from 1940-2009. Only 14 per cent of the global landmass showed, with 90 per cent confidence, increases or decreases in precipitation outside natural variation.
Professor Graham Farquhar AO also from the ANU Research School of Biology said natural variation was so large in most regions that even if climate change was affecting rainfall, it was effectively hidden in the noise.
“We know that humans have already had a measurable influence on streamflows and groundwater levels through extraction and making significant changes to the landscape,” Professor Farquhar said.
“But the natural variability of precipitation found in this paper presents policymakers with a large known unknown that has to be factored into their estimates to effectively assess our long-term water resource needs.” The research has been published in the journal Proceedings of the National Academy of Sciences.
Summary
Much like sea level rise, scientists fearing the worst seek and hope to find a nanosignal inside noisy imprecise measurements of a naturally varying phenomenon.