Frackingphobia: Facts vs. Fears

Hydraulic fracturing (AKA “fracking”) is in the news every day, and often in a disparaging way, despite the great benefits bestowed on nations applying the process, especially the US.

On a recent river cruise I found myself at a table with a couple from California, and the woman began spouting about the dangers and horribleness of fracking. My civility censor was suppressed by the wine I’d consumed, and I interrupted to say she was talking Bullshit. She halted, then asked her husband, a retired geologist, to comment, and he stated that fracking is a risky business. The geologist husband did not present any evidence for his view, IMO he was only speaking to support his spouse. I said I respected his opinion but still disagreed. The next day I apologized for my rudeness but said I still think she has been misled. We shared a congenial dinner later on, but avoided the subject.

The experience revealed I had been unprepared to engage on the details of the fracking issue. So this post is to summarize some research to assemble persuasive facts and resources to counter the fear mongering on this subject.

Originated at treehugger.com.


1.Obama’s EPA Found Fracking Has Not Contaminated Drinking Water

(Source: EPA Has Not Actually Changed Its Conclusion On Risks Of Fracking To Drinking Water by Robert Rapier for Forbes) Excerpts in italics with my bolds.

First, let me provide a bit of background on hydraulic fracturing. I find that most people who are against fracking don’t actually know what it is. The EPA report goes out of its way to blur the lines as well by lumping it all into “activities in the hydraulic fracturing water cycle.” By doing this, if a guy driving a truck filled with fracking chemicals has a wreck, it’s a “fracking issue.” So let’s define some terms.

Hydraulic fracturing has been around since the late 1940s, and has now been used in the U.S. more than a million times to increase production from oil and gas wells. Fracking involves pumping water, chemicals and a proppant down an oil or gas well under high pressure to break open channels (fractures) in the reservoir rock trapping the deposit. Oil and gas do not travel easily through these some formations, which is why they need to be fractured. The proppant is a granular material (usually sand) designed to hold those channels open, allowing the oil (or natural gas) to flow to the well bore.
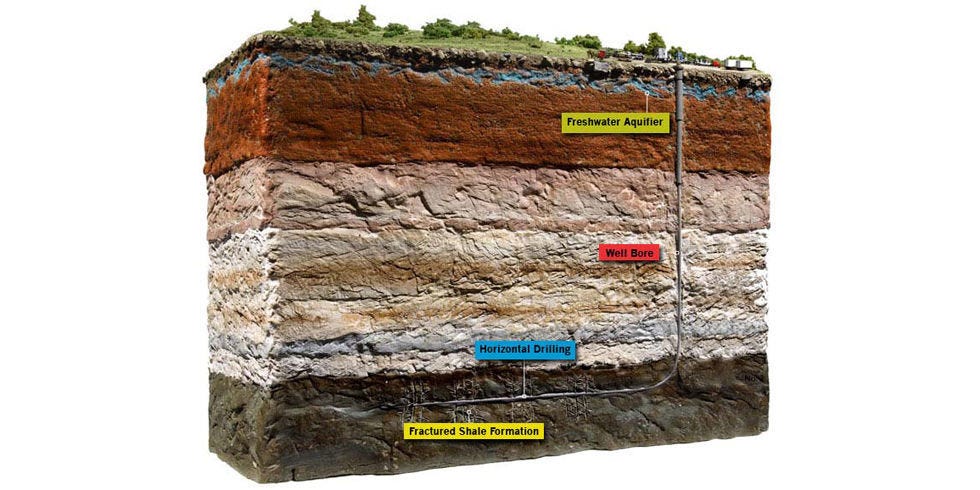
While fracking has been around for decades, two developments in recent years are responsible for thrusting the technique into the public eye. The first is the fairly recent development in which fracking was combined with horizontal drilling, another common technique used in the oil and gas industry.

Like fracking, horizontal drilling was invented decades ago, and has been widely used in the oil and gas industry since the 1980s. As its name implies, horizontal drilling involves drilling down to an oil or gas deposit and then turning the drill horizontal to the formation to access a greater fraction of the deposit.

The marriage of these two techniques of hydraulic fracturing and horizontal drilling enabled the shale oil and gas boom in the U.S.

But the second development is what primarily thrust the technique(s) into the public spotlight. Some of the shale oil and gas formations are in areas that had never experienced significant fossil fuel development. Many locals resented this intrusion into their lives, and anti-fracking sentiments fed into a great deal of misinformation around the technique.

The movie Gasland is a perfect example. Director Josh Fox, whose family farm lies atop the Marcellus Shale in Pennsylvania, relied on misinformation and appeals to emotion instead of scientific data. Nevertheless, it was embraced by anti-fracking activists, and many who had never heard of fracking became convinced the technique was regularly polluting water supplies.

The concern among anti-fracking activists was that the fractures that allowed oil and gas to reach the well bore could also allow oil, gas, and chemicals to seep into the water supplies. But the reason this is a remote possibility is that a mile or more of rock will separate an oil and gas formation that is being fractured and an underground water resource. The fractures themselves extend for a few hundred feet, thus unsurprisingly there has never been a proven case where chemicals migrated from a fracked zone into water supplies.

That hasn’t stopped some from claiming that fracking has contaminated water supplies. However, those cases have always been a result of some activity peripheral to fracking. For example, if a well is improperly cemented it can leak. That in fact has happened, leading to the charge that “fracking contaminated the water.” There is an important distinction, however, and that is that this is not a result of the fracking process. A well may leak regardless of whether it was fracked. But activists (and now the EPA) seem bent on blurring the lines to the greatest extent possible by lumping lots of peripheral activities into the “fracking process.”

In 2010, Congress asked the EPA to investigate the safety of fracking. In 2015, the EPA issued a draft report. The bombshell statement from that report was that there was no evidence that fracking had “led to widespread, systemic impacts on drinking water resources in the United States.” This report was cheered by the fossil fuel industry, but caused a backlash with environmentalists, and spawned many counterclaims that the “fracking process” had led to contaminated water.

In December 2016 the EPA released its final report on the topic: Hydraulic Fracturing for Oil and Gas: Impacts from the Hydraulic Fracturing Water Cycle on Drinking Water Resources in the United States. Environmentalists were quick to note that the EPA had deleted its previous claim of no evidence of widespread water contamination, and were now reporting that “hydraulic fracturing activities can impact drinking water resources under some circumstances.” This story from The New York Times, for instance, was pretty typical of the reporting on the issue: Reversing Course, E.P.A. Says Fracking Can Contaminate Drinking Water.

But did the EPA actually reverse course? No. They gave examples where fracking could contaminate water. For instance they state that “Injection of hydraulic fracturing fluids directly into groundwater resources” can cause contamination. Yeah, no joke. Likewise, filling your car with gasoline can contaminate drinking water, because if you spill the gasoline all over the ground, it can get into the drinking water.

The EPA’s final report on hydraulic fracturing wasn’t that much different from the draft report. As in the previous report, the EPA noted that activities related to — but not exclusive to — fracking, have contaminated water supplies. Chemical spills happen all the time, but if the chemicals in question are for fracking, it becomes a “fracking issue.” Note that if the chemicals in question are to be used for fighting fires, we don’t say “firefighting contaminates water.” We should properly identify and address the actual problem, which in this instance would be the cause of the chemical spill.

Ultimately, the final report deleted a phrase from the draft report that there was no evidence of widespread impact on water supplies, and selectively used hypotheticals to show how fracking “could” contaminate water supplies. This is the Obama Administration laying down one more speed bump for the oil and gas industry while it still can.

Shale gas drilling rig in Ohio.

2. Discredited Fracking Studies are used to Target School Children
(Source: New Activist Report Rehashes Discredited Fracking Studies to Target School Children by Seth Whitehead for EnergyinDepth

A new Environment America “report” uses a couple old anti-fracking tactics — exploitation of children and blatant misinformation from activist studies — to try to stoke fears and rally support for its extremist call to ban fracking nationwide.

The ominously-titled “Dangerous and Close: Fracking Puts the Nation’s Most Vulnerable People at Risk” finds there are nearly 2,000 child care facilities, better than 1,300 schools, nearly 250 nursing care providers and more than 100 hospitals within a one-mile radius of fracked wells in the nine states examined, stating:

“Given the scale and severity of fracking’s impacts, fracking should be prohibited wherever possible and existing wells should be shut down beginning with those near institutions that serve our most vulnerable populations.”

Here are the report’s most egregious claims, followed by the facts.

Environment America Claim: “Fracking creates a range of threats to our health, including creating toxic air pollution that can reduce lung function even among healthy people, trigger asthma attacks, and has been linked to premature death. Children and the elderly are especially vulnerable to fracking’s health risks.”

A pumpjack works in the Bakken shale of North Dakota.

REALITY: There is actually ample evidence that fracking is improving overall air quality and health by reducing major pollutants such as fine particulate matter, sulfur dioxide and nitrogen dioxide. Furthermore, all three studies EA singles out as “evidence” close proximity to fracking sites can lead to the myriad of adverse health effects have been thoroughly debunked.

EA even cites an Earthworks study that claims “A series of 2012 measurements by officials of the Texas Commission on Environmental Quality (TCEQ) found VOCs levels so high at one fracking location that the officials themselves were forced to stop taking measurements and leave the site because it was too dangerous for them to remain.”

EA fails to mention TCEQ responded to Earthworks’ report by saying the agency has collected “several millions of data points for volatile organic compounds” in the Barnett Shale and Eagle Ford Shale and “Overall, the monitoring data provide evidence that shale play activity does not significantly impact air quality or pose a threat to human health.”

EA also conveniently ignores that the West Virginia Department of Environmental Protection (DEP) and the Colorado Department of Public Health (CDPH) have conducted air monitoring near well sites as well and found no credible risk to public health.

Environment America Claim: “Currently, oil and gas companies are exempt from key provisions in the Safe Drinking Water Act, the Clean Air Act, the Clean Water Act, and the Resource Conservation and Recovery Act.”

REALITY: The notion that the oil and natural gas industry is under-regulated is absolutely absurd narrative activists such as EA continue to push. Oil and gas production activities are subject to eight federal laws: including all relevant provisions of the Safe Drinking Water Act (SDWA); Clean Water Act (CWA); Clean Air Act (CAA); Resources Conservation and Recovery Act (RCRA); Comprehensive Environmental Response, Compensation, and Liability Act (CERCLA); the EPCRA; Toxic Substances Control Act (TSCA); and Federal Insecticide, Fungicide and Rodenticide Act (FIFRA). Additionally, the oil and gas production sector is also heavily regulated at the state level.

A drilling rig works  in the Eagle Ford shale, South Texas region.

Environment America Claim: “Exposure to low levels of many of the chemicals used in or generated by oil and gas extraction activities can contribute to a variety of health effects, including asthma, cancer, birth defects, damage to the reproductive system and impaired brain development. For example, children’s long-term exposure to low levels of benzene, generally classified as a carcinogen, also harms respiratory health.”

REALITY: It is essential to understand that toxicity is completely dependent on dose level and exposure. The mere presence of benzene, for example, does not mean that it is present in toxic levels, as the numerous studies air monitoring studies referred to earlier illustrate. EA insinuates that even low-level benzene exposure is harmful. But benzene is actually present in countless everyday products such as shampoo, tooth paste, paint, PVC pipes and countless plastic products.

Environment America Claim: “Fracking targets the oil and gas trapped in shale formations… Sometimes that means wells are drilled in rural areas, such as portions of Colorado or North Dakota, and sometimes that wells are in densely populated areas, such as Los Angeles…”

REALITY: There are no fracking or unconventional oil production operations in the city of Los Angeles — none. EA attempts to justify this claim by employing the common activist tactic of expanding the definition of fracking to encompass all oil and gas related activity:

“Throughout this report, we refer to “fracking” as including all of the activities needed to bring a well into production using high-volume hydraulic fracturing. This includes drilling the well, operating that well, processing the gas or oil produced from that well, and delivering the gas or oil to market. The oil and gas industry often uses a more restrictive definition of “fracking” that includes only the actual moment in the extraction process when rock is fractured – a definition that obscures the broad changes to environmental, health and community conditions that result from the use of high-volume hydraulic fracturing in oil and gas extraction.”

Fracking is not used as a completion technique at any of the urban drill sites in the city. All of the facilities recover oil through traditional water flood operations. The report’s attempt to shoehorn fracking and unconventional production into its report proves that it is not engaged in an honest attempt to inform the public.

Environment America Claim: “Because of the health hazard created by radon, Pennsylvania has a long record of radon measurements in homes. An analysis of those radon measurements by researchers at Johns Hopkins School of Public Health found that radon levels have increased in counties with extensive fracking since 2004, and also found elevated radon levels on the first floor of houses located within 12.5 miles of a fracked well.”

REALITY: The Johns Hopkins study EA is referring to actually found the highest concentrations of radon were in areas with no shale development and direct sampling found radon not linked to fracking. As is the case with so many of the studies EA uses as evidence, the authors merely speculated fracking was the cause.

Environment America Claim: “Oil and gas production at fracked wells releases volatile organic compounds and nitrogen oxides that contribute to the formation of smog.”

REALITY: Oil and gas production is not a major contributor to ground-level ozone.

As EID has emphasized before, publicly available information demonstrates oil and gas production is not the significant contributor to ozone levels. Vehicle exhaust adds far more non-methane volatile organic compounds (NMVOCs) and nitrogen oxides (NOx) — both precursors to ground-level ozone — to the atmosphere than oil and gas production, as data from the EPA’s 2016 Greenhouse Gas Inventory clearly demonstrates.

Not only do oil and gas activities account for just six percent of total NOx emissions, which play more of a role in ground-level formation than VOCs, another recent NOAA report found that “The increased use of natural gas has…led to emissions reductions of NOx (40%) and SO2 (44%).”

Environment America Claim: “Contaminants can reach water supplies through faulty well construction, through surface spills, through improper wastewater disposal, or potentially through migration from the shale layer itself.”

REALITY: The EPA’s landmark five-year study confirmed, “hydraulic fracturing activities have not led to widespread, systemic impacts to drinking water resources,” and at least 15 other studies say the fracking process, specifically, have not contaminated groundwater.

Conclusion

EA’s claims in this report — aimed at generating headlines — are quite profound.

“Schools and day care centers should be safe places for kids to play and learn,” said Rachel Richardson, director of Environment America’s Stop Drilling program and co-author of the report. “Unfortunately our research shows far too many kids may be exposed to dirty air and toxic chemicals from fracking right next door.”

The problem is EA’s “research” merely found that there are some schools, nursing homes and hospitals near oil and natural gas development. It made no effort to collect its own data to support their claim that this is leading to adverse health effects.

Instead, it relied on long-debunked studies and tired fear tactics. Maybe that’s why the report’s hyperbolic claim that it “serves as a reminder of the unacceptable dangers of fracking, its potential to harm, and the need to bring this risky form of drilling to an end” was virtually ignored by the media.

3. Extensive research Study Found No link between groundwater pollution and fracking.
(Source: National Science Foundation and Duke University study summarized by Jeffrey Folks for American Thinker The science is settled, fracking is safe.)

Among the 130 wells studied, the researchers found only a subset of cases, including seven in Pennsylvania and one in Texas, in which faulty well construction or cementing was to blame for the seepage of gases into groundwater. According to Professor Avner Bengosh of Duke University, “[t]hese results appear to rule out the migration of methane up into drinking water aquifers from depth because of horizontal drilling or hydraulic fracturing.” That is to say, in the rare cases where it occurs, gases are entering the water supply from outside the borehead as a result of faulty well construction or poor cementing, both of which are manageable problems.

While the new report answers the most important question, proving beyond doubt that fracking itself does not cause gas to seep into the water supply, it does not address several other important questions. One of these is the frequency of contamination of water supplies by naturally occurring petroleum, methane, and other gases.

Natural pollution of this kind would seem to be extremely common, and in fact this natural process has been known for millennia. At sites where petroleum seeped to the surface, as in the vicinity of the 19th-century Drake oil field in Pennsylvania, Native Americans had made use of the oily substance as a lubricant for hundreds if not thousands of years. That oil, flowing naturally to the surface, was “contaminating” nearby streams and groundwater.

What humans add to natural emisions as a result of drilling is so minor as to be of little consequence. If some future study confirmed this fact, it would help to counter the myth that oil and gas drilling is polluting an otherwise pure land and sea environment. The reality is that wherever shale and other carbon-rich formations occur, natural leakage of petroleum and/or methane is inevitable. Oil and gas are naturally occurring features that are constantly interacting with the environment and entering the water supply through natural processes. As is so often the case, the idea that there once existed an environment free of all that modern intellectuals might consider unpleasant is simply a fantasy.

The NSF/Duke report is crucial to the debate over the safety of hydraulic fracturing. The oil and gas industry has already achieved a near perfect safety record, given the handful of failed wells in proportion to more than one million that have been fracked. The industry needs to continue working to achieve certainty that wells do not fail. It also needs to do a better job of communicating its intention to do so to a skeptical public.

4. Is Fracking Safe? The 10 Most Controversial Claims About Natural Gas Drilling by Seamus McGraw Popular Mechanics 2016

Members of Congress, gas companies, news organization, drilling opponents: They’ve all made bold claims about hydraulic fracturing (fracking) and the U.S. supply of underground natural gas. We take on 10 controversial quotes about natural gas and set the record straight.

WE ARE THE SAUDI ARABIA OF NATURAL GAS.” SEN. JOHN KERRY, D-MASS., MAY 2010

Less than a decade ago, industry analysts and government officials fretted that the United States was in danger of running out of gas. No more. Over the past several years, vast caches of natural gas trapped in deeply buried rock have been made accessible by advances in two key technologies: horizontal drilling, which allows vertical wells to turn and snake more than a mile sideways through the earth, and hydraulic fracturing, or fracking. Developed more than 60 years ago, fracking involves pumping millions of gallons of chemically treated water into deep shale formations at pressures of 9000 pounds per square inch or more. This fluid cracks the shale or widens existing cracks, freeing hydrocarbons to flow toward the well.

These advances have led to an eightfold increase in shale gas production over the past decade. According to the Energy Information Administration, shale gas will account for nearly half of the natural gas produced in the U.S. by 2035. But the bonanza is not without controversy, and nowhere, perhaps, has the dispute over fracking grown more heated than in the vicinity of the Marcellus Shale. According to Terry Engelder, a professor of geosciences at Penn State, the vast formation sprawling primarily beneath West Virginia, Pennsylvania and New York could produce an estimated 493 trillion cubic feet of gas over its 50- to 100-year life span. That’s nowhere close to Saudi Arabia’s total energy reserves, but it is enough to power every natural gas—burning device in the country for more than 20 years. The debate over the Marcellus Shale will shape national energy policy—including how fully, and at what cost, we exploit this vast resource.

HYDRAULIC FRACTURING SQUANDERS OUR PRECIOUS WATER RESOURCES.” Green Party of Pennsylvania, April 2011

There is no question that hydraulic fracturing uses a lot of water: It can take up to 7 million gallons to frack a single well, and at least 30 percent of that water is lost forever, after being trapped deep in the shale. And while there is some evidence that fracking has contributed to the depletion of water supplies in drought-stricken Texas, a study by Carnegie Mellon University indicates the Marcellus region has plenty of water and, in most cases, an adequate system to regulate its usage. The amount of water required to drill all 2916 of the Marcellus wells permitted in Pennsylvania in the first 11 months of 2010 would equal the amount of drinking water used by just one city, Pittsburgh, during the same period, says environmental engineering professor Jeanne VanBriesen, the study’s lead author. Plus, she notes, water withdrawals of this new industry are taking the place of water once used by industries, like steel manufacturing, that the state has lost. Hydrogeologist David Yoxtheimer of Penn State’s Marcellus Center for Outreach and Research gives the withdrawals more context: Of the 9.5 billion gallons of water used daily in Pennsylvania, natural gas development consumes 1.9 million gallons a day (mgd); livestock use 62 mgd; mining, 96 mgd; and industry, 770 mgd.

NATURAL GAS IS CLEANER, CHEAPER, DOMESTIC, AND IT’S VIABLE NOW.” OILMAN TURNED NATURAL-GAS CHEERLEADER T. BOONE PICKENS, SEPTEMBER 2009

Burning natural gas is cleaner than oil or gasoline, and it emits half as much carbon dioxide, less than one-third the nitrogen oxides, and 1 percent as much sulfur oxides as coal combustion. But not all shale gas makes it to the fuel tank or power plant. The methane that escapes during the drilling process, and later as the fuel is shipped via pipelines, is a significant greenhouse gas. At least one scientist, Robert Howarth at Cornell University, has calculated that methane losses could be as high as 8 percent. Industry officials concede that they could be losing anywhere between 1 and 3 percent. Some of those leaks can be prevented by aggressively sealing condensers, pipelines and wellheads. But there’s another upstream factor to consider: Drilling is an energy-intensive business. It relies on diesel engines and generators running around the clock to power rigs, and heavy trucks making hundreds of trips to drill sites before a well is completed. Those in the industry say there’s a solution at hand to lower emissions—using natural gas itself to power the process. So far, however, few companies have done that.

“[THERE’S] NEVER BEEN ONE CASE—DOCUMENTED CASE—OF GROUNDWATER CONTAMINATION IN THE HISTORY OF THE THOUSANDS AND THOUSANDS OF HYDRAULIC FRACTURING [WELLS]” SEN. JAMES INHOFE, R-OKLA., APRIL 2011

The senator is incorrect. In the past two years alone, a series of surface spills, including two blowouts at wells operated by Chesapeake Energy and EOG Resources and a spill of 8000 gallons of fracking fluid at a site in Dimock, Pa., have contaminated groundwater in the Marcellus Shale region. But the idea stressed by fracking critics that deep-injected fluids will migrate into groundwater is mostly false. Basic geology prevents such contamination from starting below ground. A fracture caused by the drilling process would have to extend through the several thousand feet of rock that separate deep shale gas deposits from freshwater aquifers. According to geologist Gary Lash of the State University of New York at Fredonia, the intervening layers of rock have distinct mechanical properties that would prevent the fissures from expanding a mile or more toward the surface. It would be like stacking a dozen bricks on top of each other, he says, and expecting a crack in the bottom brick to extend all the way to the top one. What’s more, the fracking fluid itself, thickened with additives, is too dense to ascend upward through such a channel. EPA officials are closely watching one place for evidence otherwise: tiny Pavillion, Wyo., a remote town of 160 where high levels of chemicals linked to fracking have been found in groundwater supplies. Pavillion’s aquifer sits several hundred feet above the gas cache, far closer than aquifers atop other gas fields. If the investigation documents the first case of fracking fluid seeping into groundwater directly from gas wells, drillers may be forced to abandon shallow deposits—which wouldn’t affect Marcellus wells.

“THE GAS ERA IS COMING, AND THE LANDSCAPE NORTH AND WEST OF [NEW YORK CITY] WILL INEVITABLY BE TRANSFORMED AS A RESULT. WHEN THE VALVES START OPENING NEXT YEAR, A LOT OF POOR FARM FOLK MAY BECOME TEXAS RICH. AND A LOT OF OTHER PEOPLE—ESPECIALLY THE ECOSENSITIVE NEW YORK CITY CROWD THAT HAS SETTLED AMONG THEM—WILL BE APOPLECTIC AS THEIR PRISTINE WEEKEND SANCTUARY IS CONVERTED INTO AN INDUSTRIAL ZONE, CRISSCROSSED WITH DRILL PADS, PIPELINES, AND ACCESS ROADS.” New York magazine, Sept. 21, 2008

Much of the political opposition to fracking has focused on the Catskill region, headwaters of the Delaware River and the source of most of New York City’s drinking water. But the expected boom never happened—there’s not enough gas in the watershed to make drilling worthwhile. “No one has to get excited about contaminated New York City drinking water,” Penn State’s Engelder told the Times Herald-Record of Middletown, N.Y., in April. The shale is so close to the surface that it’s not concentrated in large enough quantities to make recovering it economically feasible. But just to the west, natural gas development is dramatically changing the landscape. Drilling rigs are running around the clock in western Pennsylvania. Though buoyed by the economic windfall, residents fear that regulators can’t keep up with the pace of development. “It’s going to be hard to freeze-frame and say, ‘Let’s slow down,’?” Sen. Robert P. Casey Jr., D-Pa., said last fall. “That makes it more difficult for folks like us, who say we want to create the jobs and opportunity in the new industry, but we don’t want to do it at the expense of water quality and quality of life.”

“NATURAL GAS IS AFFORDABLE, ABUNDANT AND AMERICAN. IT COSTS ONE-THIRD LESS TO FILL UP WITH NATURAL GAS THAN TRADITIONAL GASOLINE.” REP. JOHN LARSON, D-CONN., CO-SPONSOR OF H.R. 1380, A MEASURE THAT WOULD PROVIDE TAX INCENTIVES FOR THE DEVELOPMENT AND PURCHASE OF NATURAL GAS VEHICLES, MARCH 2011

That may be true. Plus, there’s another incentive: Vehicles powered by liquefied natural gas, propane or compressed natural gas run cleaner than cars with either gasoline or diesel in the tank. According to the Department of Energy, if the transportation sector switched to natural gas, it would cut the nation’s carbon-monoxide emissions by at least 90 percent, carbon-dioxide emissions by 25 and nitrogen-oxide emissions by up to 60. But it’s not realistic: Nationwide, there are only about 3500 service stations (out of 120,000) that offer natural gas—based automotive fuel, and it would cost billions of dollars and take years to develop sufficient infrastructure to make that fuel competitive with gasoline or diesel. And only Honda makes a car that can run on natural gas. That doesn’t mean natural gas has no role in meeting the nation’s short-term transportation needs. In fact, buses in several cities now rely on it, getting around the lack of widespread refueling opportunities by returning to a central terminal for a fill-up. The same could be done for local truck fleets. But perhaps the biggest contribution natural gas could make to America’s transportation picture would be more indirect—as a fuel for electric-generation plants that will power the increasingly popular plug-in hybrid vehicles.

“DO NOT DRINK THIS WATER” HANDWRITTEN SIGN IN THE DOCUMENTARY GASLAND, 2010

It’s an iconic image, captured in the 2010 Academy Award—nominated documentary GasLand. A Colorado man holds a flame to his kitchen faucet and turns on the water. The pipes rattle and hiss, and suddenly a ball of fire erupts. It appears a damning indictment of the gas drilling nearby. But Colorado officials determined the gas wells weren’t to blame; instead, the homeowner’s own water well had been drilled into a naturally occurring pocket of methane. Nonetheless, up to 50 layers of natural gas can occur between the surface and deep shale formations, and methane from these shallow deposits has intruded on groundwater near fracking sites. In May, Pennsylvania officials fined Chesapeake Energy $1 million for contaminating the water supplies of 16 families in Bradford County. Because the company had not properly cemented its boreholes, gas migrated up along the outside of the well, between the rock and steel casing, into aquifers. The problem can be corrected by using stronger cement and processing casings to create a better bond, ensuring an impermeable seal.

“AS NEW YORK GEARS UP FOR A MASSIVE EXPANSION OF GAS DRILLING IN THE MARCELLUS SHALE, STATE OFFICIALS HAVE MADE A POTENTIALLY TROUBLING DISCOVERY ABOUT THE WASTEWATER CREATED BY THE PROCESS: IT’S RADIOACTIVE.” ProPublica, November 2009

Shale has a radioactive signature—from uranium isotopes such as radium-226 and radium-228—that geologists and drillers often measure to chart the vast underground formations. The higher the radiation levels, the greater the likelihood those deposits will yield significant amounts of gas. But that does not necessarily mean the radioactivity poses a public health hazard; after all, some homes in Pennsylvania and New York have been built directly on Marcellus shale. Tests conducted earlier this year in Pennsylvania waterways that had received treated water—both produced water (the fracking fluid that returns to the surface) and brine (naturally occurring water that contains radioactive elements, as well as other toxins and heavy metals from the shale)—found no evidence of elevated radiation levels. Conrad Dan Volz, former scientific director of the Center for Healthy Environments and Communities at the University of Pittsburgh, is a vocal critic of the speed with which the Marcellus is being developed—but even he says that radioactivity is probably one of the least pressing issues. “If I were to bet on this, I’d bet that it’s not going to be a problem,” he says.

“CLAIMING THAT THE INFORMATION IS PROPRIETARY, DRILLING COMPANIES HAVE STILL NOT COME OUT AND FULLY DISCLOSED WHAT FRACKING FLUID IS MADE OF.” Vanity Fair, June 2010

Under mounting pressure, companies such as Schlumberger and Range Resources have posted the chemical compounds used in some of their wells, and in June, Texas became the first state to pass a law requiring full public disclosure. This greater transparency has revealed some oddly benign ingredients, such as instant coffee and walnut shells—but also some known and suspected carcinogens, including benzene and methanol. Even if these chemicals can be found under kitchen sinks, as industry points out, they’re poured down wells in much greater volumes: about 5000 gallons of additives for every 1 million gallons of water and sand. A more pressing question is what to do with this fluid once it rises back to the surface. In Texas’s Barnett Shale, wastewater can be reinjected into impermeable rock 1.5 miles below ground. This isn’t feasible in the Marcellus Shale region; the underlying rocks are not porous enough. Currently, a handful of facilities in Pennsylvania are approved to treat the wastewater. More plants, purpose-built for the task, are planned. In the meantime, most companies now recycle this water to drill their next well.

“THE INCREASING ABUNDANCE OF CHEAP NATURAL GAS, COUPLED WITH RISING DEMAND FOR THE FUEL FROM CHINA AND THE FALL-OUT FROM THE FUKUSHIMA NUCLEAR DISASTER IN JAPAN, MAY HAVE SET THE STAGE FOR A ‘GOLDEN AGE OF GAS.” WALL STREET JOURNAL SUMMARIZING AN INTERNATIONAL ENERGY AGENCY REPORT, JUNE 6, 2011

There’s little question that the United States, with 110 years’ worth of natural gas (at the 2009 rate of consumption), is destined to play a major role in the fuel’s development. But even its most ardent supporters, men like T. Boone Pickens, concede that it should be a bridge fuel between more polluting fossil fuels and cleaner, renewable energy. In the meantime, the U.S. should continue to invest in solar and wind, conserve power and implement energy-efficient technology. Whether we can effectively manage our natural gas resource while developing next-gen sources remains to be seen. Margie Tatro, director of fuel and water systems at Sandia National Laboratories, says, “I think natural gas is a transitioning fuel for the electricity sector until we can get a greater percentage of nuclear and renewables on the grid.”


5.Compendium of Studies Demonstrating the Safety and Health Benefits of Fracking

The United States has made massive improvements in air quality over the past decade
and study after study has shown that the increased use of natural gas for electricity
generation – made possible by the shale revolution – is the reason we’ve achieved this
feat.

This progress is the centerpiece of Energy In Depth’s new report – Compendium of
Studies Demonstrating the Safety and Health Benefits of Fracking – which includes data
from 23 peer-reviewed studies, 17 government health and regulatory agencies and
reports from 10 research institutions that clearly demonstrate:
• Increased natural gas use — thanks to hydraulic fracturing —has led to dramatic
declines in air pollution. The United States is the number one oil and gas producer in
the world and it has some of the lowest death rates from air pollution in the world.
Numerous studies have shown that pollution has plummeted as natural gas production
has soared.
Emissions from well sites and associated infrastructure are below thresholds
regulatory authorities consider to be a threat to public health – that’s the conclusion of
multiple studies using air monitors that measure emissions directly.
• There is no credible evidence that fracking causes or exacerbates asthma. In fact,
asthma rates and asthma hospitalizations across the United States have declined as
natural gas production has ramped up.
• There is no credible evidence that fracking causes cancer. Studies that have directly
measured emissions at fracking sites have found emissions are below the threshold
that would be harmful to public health.
• There is no credible evidence that fracking leads to adverse birth outcomes. In fact,
adverse birth outcomes have decreased while life expectancy has increased in areas
that are ramping up natural gas use.
Fracking is not a credible threat to groundwater. Study after study has shown that
there are no widespread, systemic impacts to drinking water from hydraulic fracturing.
It is well known that the shale revolution has been a boon to our nation’s economy,
its geopolitical position, and the millions of consumers and manufacturers who
continue to benefit from historically low energy costs. But the case in support of
shale’s salubrious effect on air quality and health continues to be an underreported
phenomenon – this new report puts the health benefits of our increased use of natural
gas in the spotlight.

Conclusion
To be clear, no form of energy development, whether we’re talking about fossil fuels or
renewables, is risk free. But the data clearly show, time and time again, that emissions
from fracking are not a credible risk to public health.

In fact, the data show that enormous reductions in pollution across the board are
attributable to the significant increases in natural gas consumption that hydraulic
fracturing has made possible.

They show power plant emissions of SO2 declining by 86 percent, emissions of NOx
declining by 67 percent, and emissions of mercury by 55 percent. They also show
hospitalizations for asthma declining as natural gas ramps up. At the same time life
expectancy and birth outcomes have improved.

And, of course, all these positive health outcomes can be largely traced back to
significantly cleaner air, thanks to fracking.
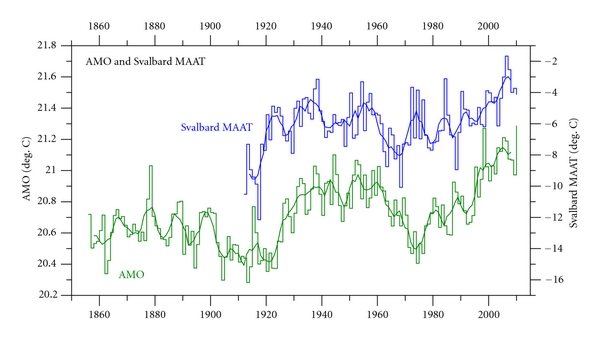
Why People Rely on Pipelines

The Trans-Alaska Pipeline system’s 420 miles above ground segments are built in a zig-zag configuration to allow for expansion or contraction of the pipe.

In their near-religious belief about demonic CO2, activists are obstructing construction or expansion of pipelines delivering the energy undergirding our civilization.  The story is explained by James Conca in a recent Forbes article Supersize It! Building Bigger Pipelines Over Old Ones Is A Good Idea Excerpts below with my bolds.

The idea of replacing an older small pipe with a wider new pipe is not new. But it really makes a difference when applied to the oil and natural gas pipelines that crisscross North America.

The concept of supersizing pipelines is taking hold in the United States and Canada to address the growing dearth of pipelines in areas where oil production is increasing but can’t get to the refineries in the Gulf.

At the same time, natural gas use is increasing in places that don’t have many pipelines and where the public is strongly against building new pipelines.

A bigger pipeline along the same route as the older smaller one is cheaper to build than a bunch of new small ones. It also falls under the existing permits and rights-of-way of the old pipe. And the public doesn’t have to approve any new pipeline routes.

Supersizing also increases safety and ensures less environmental impact since you’re not building additional lines, but replacing an old one with a new one, and older lines are more likely to leak or fail completely, like the Colonial Pipeline Spill.

Not only do we need more crude oil pipelines, the ones we have quite old. But they can be supersized without finding and permitting new routes, which saves a lot of money and time and doesn’t increase their environmental footprint. Of course, if there are no pipelines to supersize, like in much of New England and New York, that’s a whole other problem. Photo is of a section of the Alaska Pipeline.

Increasing the diameter of a pipe increases the flow within it much more than you might think. In fact, the volume of flow per minute goes as the fourth power of the change in diameter. This means, if you double the diameter, you increase the flow by 16 times – (2^4 = 2 x 2 x 2 x 2 = 16).

Enbridge is a good example. The company has replaced a 26-inch-diameter shale gas line running from Pennsylvania into New England with a 42-inch line. That doesn’t seem like much, it’s only 1.6 times as big. But raised to the power of four, this new pipeline can carry six times as much gas as the old one.

‘Once the pipe is in the ground, you can do a lot of things: reverse flows, expand it, optimize it,’ said Al Monaco, President and Chief Executive of Enbridge.

These types of upgrades have essentially made the controversial portion of the Keystone XL pipeline unnecessary.

Of course, if you don’t have old pipelines to begin with, supersizing doesn’t help. Parts of the U.S. simply need more pipelines, especially where fracking has unleashed huge amounts of oil and gas in areas that didn’t have a lot pipelines to begin with.

New England is a good example.

New England is closing their nuclear plants faster than you can say “who cares about science.” They are replacing them with natural gas and renewables. But there are hardly any gas pipelines in the region. They are forced to import liquefied natural gas from places like Russia or use dirty oil plants when demand is high, like this last winter. When this happens the customers in New England pay a high price for their electricity, sometimes ten times the normal price.

Yet, the people of New England do not want more gas pipelines.

The citizens of New England also want more renewables, whose electricity has to be imported into the northeast from other regions, especially hydropower from Canada. But this requires installing high voltage transmission lines which the public keeps voting down.

When the public does not listen to scientists and experts, things don’t go well. This problem is engulfing the energy sector. The public seems to care about climate change, but don’t want to do what the climate scientists advise – to increase nuclear and renewables – because they reject them, or their infrastructure requirements, out of ignorance.

And they aren’t putting solar panels on their roofs very much either.

So next year, they will wonder why electricity costs keep going up, their carbon emissions keep going up, and their black-outs keep getting longer.

Natural gas requires the least steel and concrete of any energy source, is cheap and quick to build, has cheap fuel, and is beloved by state legislatures. But you need pipelines to deliver it, and no one wants them in their backyard. Supersizing helps with this problem.

Natural gas is the fastest growing energy source in America. Replacing coal plants with gas plants is the only reason our carbon emissions are at a 27-year low. It’s the easiest power plant to build, requires the least amount of steel and concrete (see figure above), is the easiest to permit, will have cheap fuel for decades, and is vastly preferred over coal.

However, it requires pipelines to deliver the gas and no one seems to like them. You can ship gas as liquefied natural gas (LNG), which is what happens a lot in the New England, but that’s three times more expensive and we have very limited LNG facilities.

This is a classic case of the public misunderstanding how the real world works. These issues are somewhat complex and you have to juggle a lot of conflicting issues. Our oil pipelines themselves are generally old (see figure above). Half of them are older than 40 years. Some date from before World War One.

They need to be replaced, and new ones built, or we risk the very environmental damage feared by those who don’t want them at all. Just supersizing the oldest half would be tremendous, and remove most of the need for additional pipelines.

Our pipelines, refineries and transmission lines are all at capacity. When problems occur, there’s no back-up plan. We have over 3,000 blackouts a year, the highest in the developed world. It’s why the American Society of Civil Engineers gave America a D+ on our 2017 Infrastructure Report Card.

Somewhere around 1985, we became the world’s richest, most powerful, greatest nation in the history of the world. But we still have to work hard to remain the best. It doesn’t just maintain itself. And infrastructure is where long-term neglect first shows, often catastrophically.

So we need to upgrade our transmission lines and transformers, build new non-fossil power plants and supersize our pipelines.

We can’t afford not to.

Dr. James Conca is an expert on energy, nuclear and dirty bombs, a planetary geologist, and a professional speaker.

Footnote:

Dr. Conca is writing from an American perspective, while in Canada a major pipeline supersizing project is being resisted by one province, British Columbia, despite the pipeline gaining federal approval after a long, tortuous environmental assessment process.

The BC Premier is holding power in a coalition government beholden to a few Greens, who are adamant about “keeping it in the ground.”

Latest news at The many ways B.C. Premier John Horgan is wrong about Trans Mountain.

“The current developments are a real test of Canada’s commitment to the rule of law and the ability of any resource company to rely on the legal approval process for projects,” said Dwight Newman, one of Canada’s top constitutional scholars and Munk senior fellow at the Macdonald-Laurier Institute.

To diminish the importance to Alberta and Canada of the Trans Mountain project, Horgan refers to it as a Texas project, adopting the pejorative jargon of eco-activists dependent on U.S. funding and organizational support to run their campaigns.

“The interest of the Texas boardrooms are not the interests of British Columbians,” Horgan said. In fact, Kinder Morgan Canada has been publicly traded since last year and is 77-per-cent owned by Canadians, with Manulife and TD the biggest shareholders. Its shippers are predominantly Canadian oilsands producers and Canada as a whole benefits from the pipeline’s opening of the Asian market.

Horgan’s actions have already triggered a trade war with Alberta, fomented irrational fears about oil spills, put the spotlight on B.C. for all the wrong reasons, and exposed his province to potentially hard retribution from both from Alberta and from Ottawa. If Horgan doesn’t see that, he’s not looking.

Fossil Fuels ≠ Global Warming Updated

Note: This Analysis was updated with 2019 statistics in the post 2020 Update: Fossil Fuels ≠ Global Warming

Previous posts addressed the claim that fossil fuels are driving global warming. This post updates that analysis with the latest (2016) numbers from BP Statistics and compares World Fossil Fuel Consumption (WFFC) with three estimates of Global Mean Temperature (GMT). More on both these variables below.

WFFC

2016 statistics are now available from BP for international consumption of Primary Energy sources. Statistical Review of World Energy.  2017 numbers should be available this summer.

The reporting categories are:
Oil
Natural Gas
Coal
Nuclear
Hydro
Renewables (other than hydro)

This analysis combines the first three, Oil, Gas, and Coal for total fossil fuel consumption world wide. The chart below shows the patterns for WFFC compared to world consumption of Primary Energy from 1965 through 2016.

WFFC 2016 BP

The graph shows that Primary Energy consumption has grown continuously for 5 decades. Over that period oil, gas and coal (sometimes termed “Thermal”) averaged 90% of PE consumed, ranging from 94% in 1965 to 86% in 2016.  MToe is millions of tons of oil equivalents.

Global Mean Temperatures

Everyone acknowledges that GMT is a fiction since temperature is an intrinsic property of objects, and varies dramatically over time and over the surface of the earth. No place on earth determines “average” temperature for the globe. Yet for the purpose of detecting change in temperature, major climate data sets estimate GMT and report anomalies from it.

UAH record consists of satellite era global temperature estimates for the lower troposphere, a layer of air from 0 to 4km above the surface. HadSST estimates sea surface temperatures from oceans covering 71% of the planet. HADCRUT combines HadSST estimates with records from land stations whose elevations range up to 6km above sea level.

Both GISS LOTI (land and ocean) and HADCRUT4 (land and ocean) use 14.0 Celsius as the climate normal, so I will add that number back into the anomalies. This is done not claiming any validity other than to achieve a reasonable measure of magnitude regarding the observed fluctuations.

No doubt global sea surface temperatures are typically higher than 14C, more like 17 or 18C, and of course warmer in the tropics and colder at higher latitudes. Likewise, the lapse rate in the atmosphere means that air temperatures both from satellites and elevated land stations will range colder than 14C. Still, that climate normal is a generally accepted indicator of GMT.

Correlations of GMT and WFFC

The next graph compares WFFC to GMT estimates over the five decades from 1965 to 2016 from HADCRUT4, which includes HadSST3.

WFFC HadGMT 2016

Over the last five decades the increase in fossil fuel consumption is dramatic and monotonic, steadily increasing by 223% from 3.5B to 11.4 B oil equivalent tons.  Meanwhile the GMT record from Hadcrut shows multiple ups and downs with an accumulated rise of 0.9C over 51 years, 7% of the starting value.

The second graph compares to GMT estimates from UAH6, and HadSST3 for the satellite era from 1979 to 2016, a period of 37 years.

WFFC HadSST UAH 2016

In the satellite era WFFC has increased at a compounded rate of nearly 2% per year, for a total increase of 84% since 1979. At the same time, SST warming amounted to 0.55C, or 3.9% of the starting value.  UAH warming was 0.72, or 5.5% up from 1979.  The temperature compounded rate of change is 0.1% per year, an order of magnitude less.  Even more obvious is the 1998 El Nino peak and flat GMT since.

Summary

The climate alarmist/activist claim is straight forward: Burning fossil fuels makes measured temperatures warmer. The Paris Accord further asserts that by reducing human use of fossil fuels, further warming can be prevented.  Those claims do not bear up under scrutiny.

It is enough for simple minds to see that two time series are both rising and to think that one must be causing the other. But both scientific and legal methods assert causation only when the two variables are both strongly and consistently aligned. The above shows a weak and inconsistent linkage between WFFC and GMT.

Going further back in history shows even weaker correlation between fossil fuels consumption and global temperature estimates:

wfc-vs-sat

Figure 5.1. Comparative dynamics of the World Fuel Consumption (WFC) and Global Surface Air Temperature Anomaly (ΔT), 1861-2000. The thin dashed line represents annual ΔT, the bold line—its 13-year smoothing, and the line constructed from rectangles—WFC (in millions of tons of nominal fuel) (Klyashtorin and Lyubushin, 2003). Source: Frolov et al. 2009

In legal terms, as long as there is another equally or more likely explanation for the set of facts, the claimed causation is unproven. The more likely explanation is that global temperatures vary due to oceanic and solar cycles. The proof is clearly and thoroughly set forward in the post Quantifying Natural Climate Change.

Background context for today’s post is at Claim: Fossil Fuels Cause Global Warming.

Payback Upon Climate Grasshoppers

Grasshopper begs for food from the ant, but is turned away.

Aesop’s Fable of The Ant and the Grasshopper

In a field one summer’s day a Grasshopper was hopping about, chirping and singing to its heart’s content. An Ant passed by, bearing along with great toil an ear of corn he was taking to the nest.

“Why not come and chat with me,” said the Grasshopper, “instead of toiling and moiling in that way?”

“I am helping to lay up food for the winter,” said the Ant, “and recommend you to do the same.”

“Why bother about winter?” said the Grasshopper; “We have got plenty of food at present.” But the Ant went on its way and continued its toil.

When the winter came the Grasshopper had no food and found itself dying of hunger – while it saw the ants distributing every day corn and grain from the stores they had collected in the summer. Then the Grasshopper knew: It is best to prepare for days of need.

Children are told this story and given the moral truth that warm summer days (good times) don’t last and wise people “make hay while the sun shines.” In the longer version of the story, the starving grasshopper begs for food from the ants and is turned away.

Climate Grasshoppers

Today we are seeing climate alarmists in the role of grasshoppers. They presume future warming is certain and want to stop anyone from storing energy reserves. A post yesterday (NIMBY Wars) reported on west coast grasshoppers in Oregon and British Columbia acting against fossil fuel transport and storage. Today is a report on New England’s energy outlook facing the return of normal winters.

Dean Foreman wrote A Deeper Dive into New England’s Self-Imposed Pipeline Capacity Problem in Energy Tomorrow.  Excerpts below with my bolds.

U.S. infrastructure promises to be a top priority for the Trump administration in 2018. In his State of American Energy keynote address, API President and CEO Jack Gerard highlighted how resistance to infrastructure development has left New Englanders with some of the highest electricity costs in the nation, particularly so through extreme winters.

In December and early January, New England’s wholesale electricity prices averaged nearly three times those of equally-frigid Chicago. Over the past four years, New England’s wholesale electricity prices averaged 24 percent higher than those in Chicago and were nearly three times more volatile.

df20ng20vs20imports20volatility


While price volatility provides signals that are important to the efficiency of wholesale energy markets, the disproportionate rise of the region’s winter prices stems from New York’s beggar-thy-neighbor policies, which blocked planned, much needed and federally approved new pipeline capacity. Politics and policies that accentuate high and volatile natural gas and electricity prices, not only in New York but also in New England, harm consumers and undermine regional investment, jobs and competitiveness. It is high time that New York and New England take a collective and collaborative approach to solve the problems with permitting and incentives that utilities have to contract longer-term for natural gas.

Project abandoned in 2017

In the first week of January, contrasting headlines proclaimed natural gas got bomb-cycloned in the new year with daily New York (Transco Zone 6) prices spiking as high as $140 per million BTU (MMBtu). Yet the U.S. Energy Information Administration (EIA) reduced its 2018 price forecast to $2.88/MMBtu at Henry Hub, Louisiana. The low Henry Hub price represents a major natural gas production region and liquid trading hub. By contrast, the high New York City price reflects a major natural gas production region that could have ample low-cost natural gas, except that it is stymied by a lack of effective political and regulatory mechanisms to enable responsible resource and infrastructure development.

The rise in natural gas prices has reverberated through electricity markets. For example, the chart below compares wholesale electricity prices for December through early January between Boston and equally-frigid Chicago. Chicago is amply supplied by natural gas pipelines that flow from the U.S. Gulf Coast, Appalachia, and Rockies regions plus Canada. Based on data from Bloomberg, wholesale electricity prices between Dec. 1 and Jan. 8 averaged $31.31/MWh and had a standard deviation of more than $35/MWh. By comparison, Boston’s prices averaged $85.36/MWh with a standard deviation of $67.64/MWh over the same period. New England utilities thus paid more than twice as much for electricity and experienced about twice the price volatility.

Project abandoned in April 2016.

The region’s relatively high and volatile energy prices are rooted in the inadequacy of natural gas infrastructure to meet peak seasonal demand and, to a lesser extent, the long-standing shift in market incentives toward utilities’ reliance mainly on spot markets and very short-term contracts for gas. Specifically, natural gas-fired generators set the region’s electricity price about 75 percent of the time. Gas-fired power generation in the Northeast census region rose by 53 percent between 2007 and 2017, according to the EIA short-term energy outlook. Natural gas-fired generation contributed 38.6 percent of the region’s electricity in 2017, compared with 24.3 percent in 2007, and gained market share due to its abundance, low cost and efficient and clean-burning environmental properties.

chart2

However, natural gas pipeline constraints have hampered utilization at peak times. For example, ISO New England recently highlighted that four gigawatts of natural gas-fired generation capacity – 24% of the region’s gas-fired net winter capacity – was at risk of not being able to get fuel when needed. Much of the constraint is due to New York state’s blocking the Constitution and Northern Access Pipeline projects, among others.

To compensate for New York’s un-neighborly policies, ISO New England performed triage for the past five years with its Winter Reliability Program, which has been paying as much as $32 million per year for reserves of oil and liquified natural gas (LNG) as back-up fuels. Beginning this year, ISO New England will change to a Pay for Performance plan that alters how a generation resource’s capacity payments are calculated. These costly plans might not be needed if economic rationality and the overall region’s welfare were top of the New York state of mind.

New York and New England must take a collective and collaborative approach to solve the problems with permitting and incentives that utilities have to contract longer-term for natural gas. Given policy alternatives that provide positive incentives and enable investment and infrastructure development, lower prices, and lessen price volatility, it should be a dominant strategy for the region to pursue outcomes that are less risky, better facilitate market operations and ultimately provide a win for the region’s consumers and economy.

The Bigger Picture: Energy and Human Development

At Forbes, Jude Clemente adds this perspective: More Oil And Natural Gas Invalidates ‘Keep It In The Ground’ Movement

There is a destructive “keep it in the ground” movement arising from environmental groups to block oil and natural gas development and the pipelines required to transport them. The center of this is New York and the New England states, where numerous policymakers seek to artificially constrain energy supply. Yet, despite producing none themselves, their reliance on gas electricity has surged. ISO New England now gets about 50% of its power from gas, versus 10-15% a decade ago. New York sits in the same boat: gas now generates ~45% of the state’s electricity, doubling its market share since 2005.

It’s no wonder then that blocking energy development and pipelines has established home power rates in New England and New York that are at least 50% higher than the national average. Industrial rates are more than double, and encourages companies to leave the area. This is unfortunate and illogical since U.S. natural gas prices have been at historic lows.

Policies intended to reduce oil and gas consumption are dubious: even if they work in the short-term, over time they just lower oil and gas prices and encourage more usage. I’ve already clearly explained it. Oil and gas are so obviously ingrained in the U.S. and global economies, supplying over 60% of all energy. In the real world, this means that more economic growth ultimately means more oil and gas demand. That’s why year after year demand continues to grow. There is no significant substitute for oil whatsoever. And know that natural gas power plants don’t get retired with more wind and solar power, but get built even more because gas is flexible backup required.

This is also why more oil and gas pipelines are so crucial, not just the most economical way to transport energy but also the safest. The Trump administration calls for a bill that gets at least $1.5 trillion for the new infrastructure investment that our country so desperately needs. It’s safe to assume that much of that would include provisions for oil and gas infrastructure. But it’s increasingly obvious that the approval process for pipelines needs expedited, now taking an average of four years for permits to be issued.

Summary

Climatists are fixated on future warming and blaming fossil fuels, the very energy which society needs to face cold or stormy weather. It is not only New York state at fault, but also obstructionists in states like Massachusetts and Connecticut. Climate change is not the problem, it’s climate policies that threaten our collective security.

NIMBY Wars: Portland Bans Fossils Fuels! Or not.

Mayor Hales and Community Activists Celebrate Unanimous Fossil Fuel Infrastructure Ban.

Lots of cheerleaders celebrated when in 2015, the City of Portland Oregon passed a city ordinance against fossil fuel infrastructure. Resilience.org published today praising Portland as the “First U.S. City to Ban Fossil Fuel Expansion Offers Roadmap for Others”. A year ago the event was proclaimed: Portland Makes History with New Protections from Fossil Fuels Dec. 14, 2016. It was a successful blow by protesters motivated by NIMBY (Not In My Back Yard). Excerpts below with my bolds.

But there’s more to the story. In July 2017 came this story from the Oregonian:

Oregon’s Land Use Board of Appeals (LUBA) on Wednesday rejected Portland’s limits on the expansion of fossil fuel infrastructure in the city, saying the ordinance violated the commerce clause of the U.S. Constitution.

The Portland Business Alliance joined fuel suppliers to appeal to the state Land Use Board of Appeals. They cited a number of grounds for the appeal, but Wednesday’s decision was based on a violation of the commerce clause, which gives the federal government the right to regulate trade between states and other nations.

The city is considering an appeal to the State Court of Appeals.

“This decision is disappointing and goes against the interests of our community,” according to a statement issued by Mayor Ted Wheeler. “It is incumbent upon us to protect our residents from the enormous risks posed by fossil fuels. The City is reviewing the ruling and exploring our options, including an appeal. Additionally, we will continue to work with environmental, energy, and resiliency experts to ensure Portland remains a leader on these issues.”

Then in January 2018 comes a ruling from the Appeals court: Portland Ban On Fossil Fuel Terminals Is Constitutional

The Oregon Court of Appeals ruled Thursday that the Portland City Council did not violate the U.S. Constitution with a 2015 resolution that banned new fossil fuel terminals.

The court reversed a significant portion of an Oregon Land Use Board of Appeals ruling, which found the ban unconstitutional.

Portland’s use of zoning laws to ban the construction and expansion of fossil fuel terminals matters for a couple reasons.

In Oregon, tanks located in North Portland supply about 90 percent of the fossil fuels used statewide.

Nationally, the ordinance also tested a new strategy for left-leaning cities that want to limit fossil fuel use as a way to combat climate change.

“Other cities were looking to the city of Portland and what they had done as a potential model for other ordinances,” said attorney Maura Fahey with the Crag Law Center.

The text of the Oregon Court of Appeal ruling is at Columbia Pacific v. City of Portland

The review concerned the July ruling by Land Use Board of Appeals (LUBA), The arguments revolve around the federal commerce principle that states are not allowed to favor their own merchants by discriminating against out of state suppliers, or favor their consumers over out of state consumers. The court decided that Portland was not guilty of that result, and also considered a precedent from Pike (US Supreme Court case):

“Where the statute regulates even-handedly to effectuate a legitimate local public interest, and its effects on interstate commerce are only incidental, it will be upheld unless the burden on such commerce is clearly excessive in relation to the putative local benefits. If a legitimate local purpose is found, then the question becomes one of degree. And the extent of the burden that will be tolerated will of course depend on the nature of the local interest involved, and on whether it could be promoted as well with a lesser impact on interstate activities.”

LUBA concluded that the amendments impose burdens on interstate commerce that are clearly excessive in relation to the putative local benefits. Columbia Pacific, ___ Or LUBA at ___ (slip op at 92). We disagree and, in contrast, conclude that Columbia Pacific did not meet its burden to demonstrate that the claimed burdens on interstate commerce are clearly excessive in relation to the putative local benefits.

However, the judges left a door open regarding the public detriment due to restricting fossil fuels for consumers.

Before LUBA, Columbia Pacific argued that that finding was essential to the city’s decision not to allow expansion of existing bulk fossil-fuel terminals and that the specific finding that use of fossil fuels may “plateau and decline” with a continued shift to other modes of transportation, more fuel efficient vehicles, electric vehicles, and other carbon reduction strategies was not supported by an adequate factual base as required by Goal 2. Columbia Pacific, ___ Or LUBA at ___ (slip op at 55). LUBA agreed with Columbia Pacific, concluding that Finding 21 was “key support for the prohibition on any expansion of existing terminals to meet * ** local or regional needs” and its conclusion that fossil-fuel use “may plateau and decline” was “not supported by substantial evidence, and hence not supported by an adequate factual base.”

The Appeals court sided with the defendants on this aspect, noting that “the only evidence in the record projecting future fossil-fuel demand cited to us by either party or LUBA are trend-based forecasts indicating that demand will moderately increase over time.”

Will reasonable people come together and set aside irrational fears?  It remains to be seen.  From the Portland Business Journal

The Portland Business Alliance, in a statement to Willamette Week, said it hopes the city sees the ruling as “an opportunity to bring parties back to the table to revisit elements of the ordinance which, as originally adopted, significantly impact fuel access and affordability” throughout the region.

The Western States Petroleum Association, asked via email if it would appeal the new ruling, sent this statement from Oyango Snell, its general counsel:

The Columbia Pacific Building Trades Council and the Western States Petroleum Association and its members are disappointed with the Oregon Court of Appeals’ decision to allow an unconstitutional ban on new fossil fuel infrastructure in Portland. The Fossil Fuel Zoning Ordinance is not only a violation of Oregon and Portland City land use laws, but punishes consumers and businesses in the city and throughout Oregon, who rely on affordable fuel to power their homes, their businesses and the economy.

Here is what they are up against on the other side:


NIMBY in Canada:  Alberta and British Columbia go to war over pipeline expansion

In a similar power struggle, BC province, led by leftist Vancouverites has moved to prevent construction of the expanded Kinder-Morgan pipeline to move bitumen from Alberta to west coast seaports serving Asian customers.  Canadian federal authorities have signed off on this, with PM Trudeau telling the greens that if they liked his carbon tax, they have to swallow this because it is a package deal.

Ironically both provinces are governed by left wing NDP politicos, but despite (or perhaps because of that) the rhetoric is going over the top.  National Post reports
Could Alberta bring B.C. to its knees by shutting off the oil?
If they don’t like pipelines, let’s see if B.C. likes having a main supply of gasoline turned off.  This comes after the Alberta premier earlier threatened to stop importation of BC wines.

Next:  Attacks on energy access on the East Coast (New England) Payback Upon Climate Grasshoppers

For more on climate issues in courts of law:

Judiciary Climate Confusion

Critical Climate Intelligence for Jurists (and others)

Climate Law Alaska Update


Fossil Fuels ≠ Global Warming

Previous posts addressed the claim that fossil fuels are driving global warming. This post updates that analysis with the latest numbers from BP Statistics and compares World Fossil Fuel Consumption (WFFC) with three estimates of Global Mean Temperature (GMT). More on both these variables below.

WFFC

2015 statistics are now available from BP for international consumption of Primary Energy sources. Statistical Review of World Energy.  H/T  Euan Mearns

The reporting categories are:
Oil
Natural Gas
Coal
Nuclear
Hydro
Renewables (other than hydro)

This analysis combines the first three, Oil, Gas, and Coal for total fossil fuel consumption world wide. The chart below shows the patterns for WFFC compared to world consumption of Primary Energy from 1965 through 2015.

The graph shows that Primary Energy consumption has grown continuously for 5 decades. Over that period oil, gas and coal (sometimes termed “Thermal”) averaged 90% of PE consumed, ranging from 94% in 1965 to 86% in 2015.  MToe is millions of tons of oil equivalents.

Global Mean Temperatures

Everyone acknowledges that GMT is a fiction since temperature is an intrinsic property of objects, and varies dramatically over time and over the surface of the earth. No place on earth determines “average” temperature for the globe. Yet for the purpose of detecting change in temperature, major climate data sets estimate GMT and report anomalies from it.

UAH record consists of satellite era global temperature estimates for the lower troposphere, a layer of air from 0 to 4km above the surface. HadSST estimates sea surface temperatures from oceans covering 71% of the planet. HADCRUT combines HadSST estimates with records from land stations whose elevations range up to 6km above sea level.

Both GISS LOTI (land and ocean) and HADCRUT4 (land and ocean) use 14.0 Celsius as the climate normal, so I will add that number back into the anomalies. This is done not claiming any validity other than to achieve a reasonable measure of magnitude regarding the observed fluctuations.

No doubt global sea surface temperatures are typically higher than 14C, more like 17 or 18C, and of course warmer in the tropics and colder at higher latitudes. Likewise, the lapse rate in the atmosphere means that air temperatures both from satellites and elevated land stations will range colder than 14C. Still, that climate normal is a generally accepted indicator of GMT.

Correlations of GMT and WFFC

The first graph compares to GMT estimates over the five decades from 1965 to 2015 from HADCRUT4, which includes HadSST3.

Over the last five decades the increase in fossil fuel consumption is dramatic and monotonic, steadily increasing by 220% from 3.5B to 11.3 B oil equivalent tons.  Meanwhile the GMT record from Hadcrut shows multiple ups and downs with an accumulated rise of 0.9C over 50 years, 6% of the starting value.

The second graph compares to GMT estimates from UAH6, and HadSST3 for the satellite era from 1979 to 2015, a period of 36 years.

In the satellite era WFFC has increased at a compounded rate of nearly 2% per year, for a total increase of 84% since 1979. At the same time, SSTs and  lower troposphere warming amounted to 0.5C, or 3.4% of the starting value.  The temperature rate of change is 0.1% per year, an order of magnitude less.  Even more obvious is the 1998 El Nino peak and flat GMT since.

Summary

The climate alarmist/activist claim is straight forward: Burning fossil fuels makes measured temperatures warmer. The Paris Accord further asserts that by reducing human use of fossil fuels, further warming can be prevented.  Those claims do not bear up under scrutiny.

It is enough for simple minds to see that two time series are both rising and to think that one must be causing the other. But both scientific and legal methods assert causation only when the two variables are both strongly and consistently aligned. The above shows a weak and inconsistent linkage between WFFC and GMT.

In legal terms, as long as there is another equally or more likely explanation for the set of facts, the claimed causation is unproven. The more likely explanation is that global temperatures vary due to oceanic and solar cycles. The proof is clearly and thoroughly set forward in the post Quantifying Natural Climate Change.

Background context for today’s post is at Claim: Fossil Fuels Cause Global Warming.

Norway’s Climate Angst.

It is not only US climatists alarmed about faithless political appointees to energy and environmental positions. Now some Norwegians are stewing. International Business Times article (here) A climate change denier has just been put in charge of melting Arctic island of Svalbard  Per-Willy Amundsen has stated previously that he believes climate change to be a socialist ploy.

Climate change sceptic Per-Willy Amundsen of the populist right-wing Progress Party has been appointed Minister of Justice and Public Security in Norway in a cabinet reshuffle.

Amundsen does not believe that human activity is driving climate change, and says that climate change is used to disguise socialist policies, he previously told the Norwegian newspaper Stavanger Aftenblad.

Norway’s Polar Affairs Department will fall under Amundsen’s brief, including administrative responsibility for Svalbard. The island is surrounded by the Arctic Ocean, the Greenland Sea and the Barents Sea, and lies between mainland Norway and the North Pole. It has been facing increasing challenges due to climate change in recent years.

This is another crisis brewing for the climate movement because Norwegian officials are resolute believers in climatism, despite (or maybe because of) the oil wealth pouring into their sovereign fund. Norwegians seem conflicted about their oil wealth, going out of their way to proclaim their faith in climate change doctrine.

For example, in the Exxon shareholder activist initiative last May, a large portion of supporting votes came from shares held by the Norwegian wealth fund. Another bunch of votes came from the Rockefeller family acting against management of the company founded by their patriarch. (Details here).

Note the posturing by Norway PM Solberg:
Despite Amundsen’s stated views in the past, Norway’s prime minister Erna Solberg denied that she had appointed climate-change sceptics to her cabinet. “Everybody in this government believe climate change is man-made,” EUobserver reported Solberg to have said.

The appointment raises questions about how Amundsen will address the problems of Svalbard, and other areas of Norway being affected by climate change.

“Many of the challenges faced on Svalbard are related to climate change one way or the other,” Ivar Berthling, professor of geography at the Norwegian University of Science and Technology, told IBTimes UK.

This is interesting also because of the recent deluge of media reports about shrinking reindeer on Svalbard (here). Fortunately for Norwegians, and for all of us, Norway has scientists who are not confused about climate change and have made their evidence and analyses widely available. Chief among them is Dr. Ole Humlum founder of the excellent climate information website Climate4you.

Arctic gateway seas (20W-40E. 70-80N) heat content 0-700 m depth

Map showing the Arctic Gateway Seas within 20W-40E and 70-80N, for which the heat content within the uppermost 700 m is shown in the three diagrams, for East Greenland Sea, West Svalbard Sea and Barents Sea.

Svalbard archipelago, which includes Spitzbergen, is located at the gateway for Gulfstream Atlantic water entering the Arctic. Thus changes there are indicative of climate across the entire Arctic. As with other oceanic islands, like Australia, variations in land surface temperatures are synchronized with sea surface temperatures.

Figure 4: Svalbard MAAT 1912–2010 (blue) and Atlantic Multidecadal Oscillation (AMO, green) annual index values 1856–2010. The thick lines are the simple running 5 year average. Note that the temperature scales are different

Figure 4: Svalbard MAAT 1912–2010 (blue) and Atlantic Multidecadal Oscillation (AMO, green) annual index values 1856–2010. The thick lines are the simple running 5 year average. Note that the temperature scales are different

From Spectral Analysis of the Svalbard Temperature Record 1912–2010
Ole Humlum, Jan-Erik Solheim, and Kjell Stordahl (here)

During summer the daily meteorological conditions are highly influenced by the incoming solar radiation, which at 78°13′N are continuously above the horizon from 19 April to 23 August. Nevertheless, because of the nearby ocean, the air temperature usually stays relatively low, with July having an average temperature of 6.5°C (1981–2010). Summer air temperatures are also influenced by local wind conditions, partly reflecting land-sea breeze effects because of relatively small regional air pressure differences during the summer. All these factors are relatively stable from summer to summer.

During winter the meteorological conditions are very different from the summer. The sun stays below the horizon from 28 October to 14 February, and there is very little incoming solar radiation from December to February. The ground is snow covered, and much of the surrounding ocean and fjords are covered by sea ice. So whenever calm conditions prevail, inversions tend to develop and temperatures will be low at Svalbard Airport. However, conditions are frequently windy during the winter, destroying inversions, and from time to time warm air masses are advected towards Svalbard from the North Atlantic. Whenever this happens, the air temperature will rise significantly, as much as 10–15°C within few hours. In winters with high frequency of such events, the average temperature will be high and vice versa in winters where advection of warm air masses occurs less often. Also local foehn effects may be important during the winter. Together, this explains the high degree of winter temperature variability compared to the summer variability.

Advection of warm air masses from lower latitudes towards Svalbard occurs at all seasons, but is most frequent during the winter. This explains why the Svalbard air temperature is well coupled to North Atlantic temperature conditions both in summer and winter, and why several oscillations can be recognised in the spectra of both summer and winter temperature records (Figure 5). Had this not be so, one would expect at least potential solar signals to be absent from the winter data.

Figure 1: The Svalbard temperature record 1912–2010 [4], showing the mean annual air temperature (MAAT), the average summer temperature (JJA), and the average winter temperature (DJF). Thin lines show annual values, and thick lines show the simple 5 yr average. The linear MAAT increase 1912–2010 is 0.23°C per decade.

Figure 1: The Svalbard temperature record 1912–2010 [4], showing the mean annual air temperature (MAAT), the average summer temperature (JJA), and the average winter temperature (DJF). Thin lines show annual values, and thick lines show the simple 5 yr average. The linear MAAT increase 1912–2010 is 0.23°C per decade.

Strength and persistence of several cyclic variations identified in the Svalbard temperature record suggests that a natural cycle-based forecasting of future climate may be feasible for the Svalbard record, at least for a limited time ranges. Our empirical experience suggests a forecasting time range of 10–25% of the total record length.

For Svalbard our experimental forecast suggests that the observed late 20th century warming is not going to continue, but are likely to be followed by variable, but generally not higher temperatures for at least the coming 20–25 years. The falsification time scale for this forecast is about 7 years.

Summary

Once again, climate confusion and angst is born by activists conflating human and natural influences on weather patterns.

The Original Sin of debasing the term “climate change” was committed by the IPCC when they intentionally limited their scope to man made climate change. From the Principles Governing IPCC Work

The role of the IPCC is to assess on a comprehensive, objective, open and transparent basis the scientific, technical and socio-economic information relevant to understanding the scientific basis of risk of human-induced climate change, its potential impacts and options for adaptation and mitigation.

All five IPCC reports have proceeded to claim most or all of the warming since 1950 is caused by human activity, especially burning of fossil fuels. They express confidence levels of 95% or more, all the while dismissing natural factors and long term warming and cooling cycles without even analyzing them.

Norway needs to listen to and take comfort from their own scientists. As Humlum at al. point out:

Climate development with possible anthropogenic effects occurs on a background of natural climatic variations, which may be considerable, and especially in the Arctic. Natural climate variations however remain poorly understood, although they remain important for discriminating between natural and anthropogenic influences on current climate change.

Natural cycles that have remained strong over long time are likely to continue without major changes into at the near future. Knowledge on such natural oscillations is therefore essential for forecasting future climate.

For more on Svalbard’s largest island see Spitsbergen Triangle: Ground Zero for Climate Mysteries


Petroleum Age Just Beginning

Activists often say to stop burning fossil fuels now because we will run out soon anyway. In fact, we are only starting to tap into such fuel resources. From the Scientific American blog (here):

The Age of Cheap Oil and Natural Gas Is Just Beginning

We believe the period of excessively high oil prices has come to an end. The international spread of two revolutions will assure much ampler oil supplies, and will deliver prices far below the highs that reigned between the end of 2010 and mid-2014.

Beginning less than a decade ago, the shale revolution – a result of technological breakthroughs in horizontal drilling and fracking – has turned the long run declining oil production trends in the US into rises of 88% from 2008 to 2015. Despite current low prices and the damage done to profits, an exceedingly high rate of productivity improvements in this relatively new industry promises to strengthen the competitiveness of shale output even further.

A series of environmental problems related to shale exploitation have been identified, most of which are likely to be successfully handled as the infant, “wild west” industry matures and as environmental regulation is introduced and sharpened.

Geologically, the US does not stand out in terms of shale resources. A very incomplete global mapping suggests a US shale oil share of no more than 17% of a huge geological wealth, widely geographically spread. Given the mainly non-proprietary shale technology and the many advantages accruing to the producing nations, it is inevitable that the revolution will spread beyond the US.

We have assessed the prospects of non-US shale oil output in 2035, positing that the rest of the world will by then exploit its shale resources as successfully as the US has done in the revolution’s first ten years. This would yield rest of world output of 20 million barrels per day in 2035, which is similar to the global rise of all oil production in the preceding 20 years – a stunning increase with far-reaching implications in many fields.

Another related revolution is beginning to see the light of the day, but news about it has barely reached the media. It is being gradually realized that advancements in horizontal drilling and fracking, technologies normally associated with shale, can also be applied to fuller extraction from conventional, but old and tired, oil fields. If the rest of the world applies these techniques to conventional oil, as the US has done in recent years, this would yield a further addition of conventional oil amounting to 20 million barrels per day by 2035.

By Marian Radetzki, Roberto F. Aguilera on May 3, 2016
“The views expressed are those of the author(s) and are not necessarily those of Scientific American”  (Anyone surprised? At least they allowed publication)

Historical Background

Dr. David Deming provides the historical context (here)

Peak Oil is the theory that the production history of petroleum follows a symmetrical bell-shaped curve. Once the curve peaks, decline is inevitable. The theory is commonly invoked to justify the development of alternative energy sources that are allegedly renewable and sustainable.

It’s time to consign Peak Oil theory to the dust bin of history. The flaw of the theory is that it assumes the amount of a resource is a static number determined solely by geological factors. But the size of an exploitable resource also depends upon price and technology. These factors are difficult to predict.

The U.S. oil industry began in 1859 when Edwin Drake hired blacksmith Billy Smith to drill a 69-foot-deep well. Subsequent technological advances have opened up resources beyond the limits of our ancestors’ imaginations. We can drill offshore in water up to 8,000 feet deep. We have enhanced recovery techniques, horizontal drilling and four-dimensional seismic imaging. Oklahoma oilman Harold Hamm is turning North Dakota into Saudi Arabia by using hydraulic fracturing technology. U.S. oil production has reversed its 40-year decline. By the year 2020, it is anticipated that the U.S. will be the world’s top oil producer.

Share of Fuels in the Global Energy Mix Across Modern History

Nine years ago, I predicted that the age of petroleum has only just begun. I was right. The Peak Oil theorists, the malthusians and the environmentalists were all wrong. They’ve been proven wrong, over and over again, for decades. A tabulation of every failed prediction of resource exhaustion would fill a library.

Sustainability is a chimera. No energy source has been, or ever will be, sustainable. In the 11th century, Europeans anticipated the industrial revolution by transforming their society from dependence on human and animal power to water power. In the 18th century, water power was superseded by steam engines fired by burning wood. Coal replaced wood, and oil and gas have now largely supplanted coal. In the far distant future we’ll probably use some type of nuclear power. But for at least the next hundred years, oil will remain our primary energy source because it’s abundant, inexpensive and reliable.

Summary

Petroleum is the lifeblood of our industrial economy. The U.S. economy will remain stagnant and depressed until we begin to aggressively develop our native energy resources. As Hamm has said, “We can do this.” What’s stopping us isn’t geology. What’s stopping us is ignorance and bad public policy.

Deming is a geologist with a Ph.D in geophysics  and an associate professor of arts and sciences at the University of Oklahoma.

Killing the Energy Goose

golden-goose

Aesop’s Fable of The Man and the Golden Eggs

A man had a hen that laid a golden egg for him each and every day. The man was not satisfied with this daily profit, and instead he foolishly grasped for more. Expecting to find a treasure inside, the man slaughtered the hen. When he found that the hen did not have a treasure inside her after all, he remarked to himself, ‘While chasing after hopes of a treasure, I lost the profit I held in my hands!’

The Moral: People often grasp for more than they need and thus lose the little they have.

Energy is the Golden Goose of Modern Society

Poverty and energy scarcity are obviously tied together.

Access to cleaner and affordable energy options is essential for improving the livelihoods of the poor in developing countries. The link between energy and poverty is demonstrated by the fact that the poor in developing countries constitute the bulk of an estimated 2.7 billion people relying on traditional biomass for cooking and the overwhelming majority of the 1.4 billion without access to grid electricity. Most of the people still reliant on traditional biomass live in Africa and South Asia.

The relationship is, in many respects, a vicious cycle in which people who lack access to cleaner and affordable energy are often trapped in a re-enforcing cycle of deprivation, lower incomes and the means to improve their living conditions while at the same time using significant amounts of their very limited income on expensive and unhealthy forms of energy that provide poor and/or unsafe services.  Energy, Poverty, and Development

The moral of this modern story is very clear. Where energy is scarce and expensive, people’s labor is cheap and they live in poverty. Where energy is reliable and cheap, people are paid well to work and they have a better life.

Golden Eggs Aplenty in the US

From Shale Revolution Keeps Growing, Sept. 12, 2016, Corpus Christi Caller Times

Consider that in the near blink of an eye natural gas has overtaken coal as the country’s largest fuel for electricity generation. Coal generated more than 50 percent of U.S. power just a decade ago. Today, it produces just a third of our electricity and is poised to fall further.

Second, our same supply of low-cost gas is leading a manufacturing resurgence. Along the Gulf Coast and in shale fields in Pennsylvania and Ohio huge manufacturing facilities — be they steel or chemical plants — are now either entering production or are under construction. Chemical producers who use natural gas as the building blocks for their products can now make the same products here for a fraction of what they can overseas.

The American Chemistry Council, the trade association for the nation’s chemical companies, now reports that nearly 270 new chemical projects are in play, totaling $170 billion in investment. Roughly 60 percent of that investment is coming directly from overseas. Affordable, abundant natural gas is proving decisively positive for U.S. manufacturing. Jobs and investment that once slipped away are now returning. (my bold)

And last, but not least, we are on the verge of becoming one of the world’s largest natural gas exporters. Just a few years ago, America was poised to become a major natural gas importer. It has been a remarkable turn of events.

The Illusory Treasure of Fighting Climate Change

Meanwhile in jurisdictions grasping for the moral treasure of reducing CO2, governments are starving or poisoning the Energy Goose and the suffering is only beginning. Exhibit A is oil-rich Alberta Canada where provincial policies have halved business investment in just 2 years.

barrel-poison-7388531rev

Barry Cooper explains in this article published today in the Calgary Herald NDP climate policies are bearing their inevitable poisoned fruit

Contrary to what many NDP supporters, and many of my colleagues believe, businesses are more likely to respond to government policies than to set them. One of the responses to egregiously irresponsible policies is to invest elsewhere.

The Birn report did not discuss the scientific premises of anthropogenic climate warming, nor the prudence of attempting to regulate GHG emissions. What matters are the consequences of policy choices by Canadian and U.S. governments for Alberta and Saskatchewan.

Here are some pertinent facts.

The interdependence of North American economies and the familiar 10-to-one ratio between the two countries means that Canada must always adjust its policies to American realities. That ratio applies to global CO2 emissions (16 per cent for the U.S.; 1.7 per cent for Canada, of which the oilsands’ contribution is minuscule) as well as to GDP and much else. Canadian CO2 emissions are comparable to those of Texas. The big difference is how that CO2 is generated.

Coal is the largest source of American CO2, mostly from electricity generation, followed by transportation and industry. In Canada, industry — from fertilizer manufacturing to mining, smelting and pulp production — is the largest emitter, followed by transportation and then electricity generation. The main reason for this difference is that in B.C. and Laurentian Canada, hydroelectricity is the chief source of power. Prairie rivers furnish great fishing opportunities, but few electrons.

Since CO2 from American coal plants alone are double those from the entire Canadian economy, they have been the focus of U.S. policies. Replacing coal-generation with natural gas has been made easier by low natural gas prices, partly the result of innovative shale-gas exploitation.

In Canada, things are different. Because more than 80 per cent of Canadian electricity is generated by non-emitting sources, other sectors must be targeted to achieve levels of emission reductions comparable to the Americans’. The cost, however, is bound to be higher: here, cheap gas hardly matters.

This is what makes carbon taxes so attractive to Canadian governments. They can’t go after coal plants, because there are so few left, so they go after the entire economy. Alberta’s carbon tax and Ontario’s cap-and-trade policy mean that over two-thirds of Canadian emissions will be covered by next year.

Big-government Liberals, socialists and members of the green cult will rejoice that we are saving the planet. However, the costs of the new NEP — the national emissions policy — achieved by carbon-tax harmonization, will introduce more incentives for investment in places where anthropogenic climate change is not an unquestioned public policy dogma.

Because the Prairie petroleum industry competes globally for both capital and markets, parochial Canadian climate policies add to costs and induce investors abroad. And they make no difference at all to global GHG emissions.

That is one reason why energy investment in Alberta is half 2014 levels. No wonder Finance Minister Joe Ceci is sad. The consequences of his own policies are bearing their inevitably poisoned fruit.

Barry Cooper is a professor of political science at the University of Calgary.

Footnote:

Former Canadian PM Stephen Harper (from Alberta) based his climate change policy on the realities mentioned in the article.  His administration was committed to matching US energy policies on a sector by sector basis.  Since the US went after coal, so did Canada.  The US has not done anything about oil and gas, so neither should Canada.

The ruling NDP party are on thin ice because Albertans are mostly skeptical of global warming claims.  A recent Canadian survey shows the % of people whose beliefs would support what the administration is doing.  That’s right: Alberta is the dark blue province in the map.

More on survey of Canadian attitudes toward global warming:      https://rclutz.wordpress.com/2016/02/25/uncensored-canadians-view-global-warming/

More on toxic effects from Green energy policies:  https://rclutz.wordpress.com/2016/08/01/electrical-madness-in-green-ontario/

Background on Alberta oilsands:  https://rclutz.wordpress.com/2015/11/07/brer-canada-and-the-tar-baby/

Postscript:  Alberta is ahead of Ontario in the Golden Goose Killing Race, with electricity rates now among the highest in North America.  But Ontario’s rates are rising faster.


Power (and $) to the People

Donald Trump was half right when speaking recently in Montana, saying that people should have the say whether to frack or not in their backyard.

“I’m in favor of fracking, but I think that voters should have a big say in it. I mean, there’s some areas, maybe, that don’t want to have fracking, and I think if the voters are voting for it that’s up to them.”

UK Prime Minister has got it all right when she announced that the wealth will be shared with residents receiving checks directly if they choose to go with the extraction. Green and anti-fossil fuel activists are scrambling to denounce her move as “bribery” while ignoring their own undemocratic posture.  They worry about losing their power to stop progress when the discourse changes from “Not In My Back Yard” (NIMBY) to “Please In My Back Yard” (PIMBY).

A £1 billion shale wealth fund unveiled by former chancellor George Osborne in November will set aside up to 10 per cent of the tax proceeds from fracking to benefit the communities hosting wells.

But now the Prime Minister is amending the scheme so the money can go direct to residents rather than being given to councils or community trusts to spend, as Mr Osborne planned.

It is expected that the new fund could deliver as much as £10 million to each community where wells are sited.

Speaking ahead of the launch of a consultation on the fund, Mrs May said she wanted to make sure that individuals benefit personally from economic decisions.

She indicated that the model could be applied to other Government programmes, such as the Community Infrastructure Levy charge on property development in England and Wales.

“The Government I lead will always be driven by the interests of the many – ordinary families for whom life is harder than many people in politics realise,” said Mrs May. “As I said on my first night as Prime Minister, when we take the big calls, we’ll think not of the powerful but of you. This announcement is an example of putting those principles into action.”
Source: Fracking payments: Households in line for cash under Government plans Shropshire Star

Summary

Margaret Thatcher and Ronald Reagan don’t get enough credit for leading the free world to out-prosper the socialist block, thereby leading to the iron curtain collapsing, and eventually to economic reforms even in places like China and Cuba.

Today we are facing a growing tyranny of unelected bureaucrats at the EU and the UN whose power and resources are committed to a statist, left-wing agenda, using climate hysteria as justification.

Theresa May looks to be up for the fight. But will the next US President be a willing partner against entrenched special interests, activists and rent-seekers, or will it be someone beholden to them and to the status quo?