Al Gore famously warned that sea level rise caused by man’s use of fossil fuels was going to kill us. Barack Obama implied that he had magic powers that would control surging sea levels. A fresh study shows just how dishonest this pair and the many others who did their best to misinform the public have been.
Gore’s 2006 propaganda film told us to beware of sea levels rising by 20 feet, devastating New York and Florida. The uber-narcissistic Obama promised an adoring crowd that his nomination to be the Democratic Party’s 2008 presidential nominee “was the moment when the rise of the oceans began to slow and our planet began to heal.” California Gov. Jerry Brown predicted a little more than a decade ago that collapsing glaciers would submerge both the Los Angeles and San Francisco international airports.
These of course are just three of many examples of alarmists, hacks, globalist busybodies, NASA eggheads, academic ideologues and true believers fear-mongering over sea-level rise.
Obama, no climate refugee he, was later roasted for buying oceanfront compounds in Martha’s Vineyard and Hawaii. The purchases clearly show he didn’t believe what he said – he was just another political hack appealing for votes and hoping to burnish a legacy before he even set foot in the White House.
But how can we know it’s just fear-mongering?
Actual science, not Gore’s junk variety, now tells us that “approximately 95% of the suitable locations” researchers looked at showed “no statistically significant acceleration of the rate of sea level rise.” This “suggests that local, non-climatic phenomena are a plausible cause of the accelerated sea level rise observed at the remaining 5% of the suitable locations.”
“On average,” the European paper says, “the rate of rise projected by the IPCC is biased upward with approximately 2 mm per year in comparison with the observed rate.”
As it turns out:
The majority of the local causes of rapid sea level rise (or drop) appear to be geologic. Tectonic motion explains sudden changes of sea level rise found in a few places. More gradual but rapid rise (or fall) of sea level is mostly caused by glacial isostatic adjustment and in a few isolated cases by an excessive sediment load.
What else do we know about the oceans? It’s been well established that sea levels, like Earth’s climate, have been constantly changing without any human influence.
We acknowledge that we live in an era of rising sea levels, just as we live in a time in which we are escaping the lower temperatures of the Little Ice Age that lasted until the late 19th century, if not, according to some researchers, the early 20th century. But the rise we’re seeing is slow, not remotely catastrophic, and not outside of historical norms (even though the hysterics continue to claim the rise is “accelerating” and is “unprecedented”).
The climate cranks, warming crackpots, and those possessed of Marxphilia won’t be deterred by this or any other scientific evidence. But it’s news that can help persuade larger swaths of voters that the global warming scare is a con. As more Americans learn the truth, the radicals and zealots who perpetuate the fiction will fade into the oblivion they deserve.
In 2018 climatists applied their considerable PR skills and budgets swamping the media with warnings targeting major coastal cities, designed to strike terror in anyone holding real estate in those places. Example headlines included:
Sea level rise could put thousands of homes in this SC county at risk, study says The State, South Carolina
Taxpayers in the Hamptons among the most exposed to rising seas Crain’s New York Business
Adapting to Climate Change Will Take More Than Just Seawalls and Levees Scientific American
The Biggest Threat Facing the City of Miami Smithsonian Magazine
What Does Maryland’s Gubernatorial Race Mean For Flood Management?The Real News Network
Study: Thousands of Palm Beach County homes impacted by sea-level rise WPTV, Florida
Sinking Land and Climate Change Are Worsening Tidal Floods on the Texas Coast Texas Observer
Sea Level Rise Will Threaten Thousands of California HomesScientific American
300,000 coastal homes in US, worth $120 billion, at risk of chronic floods from rising seas USA Today
Sea levels are rising. Tides are inching higher. High-tide floods are becoming more frequent and reaching farther inland. And hundreds of US coastal communities will soon face chronic, disruptive flooding that directly affects people’s homes, lives, and properties.
Yet property values in most coastal real estate markets do not currently reflect this risk. And most homeowners, communities, and investors are not aware of the financial losses they may soon face.
This analysis looks at what’s at risk for US coastal real estate from sea level rise—and the challenges and choices we face now and in the decades to come.
The report and supporting documents gave detailed dire warnings state by state, and even down to counties and townships. As example of the damage projections is this table estimating 2030 impacts:
State
Homes at Risk
Value at Risk
Property Tax at Risk
Population in at-risk homes
AL
3,542
$1,230,676,217
$5,918,124
4,367
CA
13,554
$10,312,366,952
$128,270,417
33,430
CT
2,540
$1,921,428,017
$29,273,072
5,690
DC
–
$0
$0
–
DE
2,539
$127,620,700
$2,180,222
3,328
FL
20,999
$7,861,230,791
$101,267,251
32,341
GA
4,028
$1,379,638,946
$13,736,791
7,563
LA
26,336
$2,528,283,022
$20,251,201
63,773
MA
3,303
$2,018,914,670
$17,887,931
6,500
MD
8,381
$1,965,882,200
$16,808,488
13,808
ME
788
$330,580,830
$3,933,806
1,047
MS
918
$100,859,844
$1,392,059
1,932
NC
6,376
$1,449,186,258
$9,531,481
10,234
NH
1,034
$376,087,216
$5,129,494
1,659
NJ
26,651
$10,440,814,375
$162,755,196
35,773
NY
6,175
$3,646,706,494
$74,353,809
16,881
OR
677
$110,461,140
$990,850
1,277
PA
138
$18,199,572
$204,111
310
RI
419
$299,462,350
$3,842,996
793
SC
5,779
$2,882,357,415
$22,921,550
8,715
TX
5,505
$1,172,865,533
$19,453,940
9,802
VA
3,849
$838,437,710
$8,296,637
6,086
WA
3,691
$1,392,047,121
$13,440,420
7,320
The methodology, of course is climate models all the way down. They explain:
Three sea level rise scenarios, developed by the National Oceanic and Atmospheric Administration (NOAA) and localized for this analysis, are included:
A high scenario that assumes a continued rise in global carbon emissions and an increasing loss of land ice; global average sea level is projected to rise about 2 feet by 2045 and about 6.5 feet by 2100.
An intermediate scenario that assumes global carbon emissions rise through the middle of the century then begin to decline, and ice sheets melt at rates in line with historical observations; global average sea level is projected to rise about 1 foot by 2035 and about 4 feet by 2100.
A low scenario that assumes nations successfully limit global warming to less than 2 degrees Celsius (the goal set by the Paris Climate Agreement) and ice loss is limited; global average sea level is projected to rise about 1.6 feet by 2100.
Oh, and they did not forget the disclaimer:
Disclaimer This research is intended to help individuals and communities appreciate when sea level rise may place existing coastal properties (aggregated by community) at risk of tidal flooding. It captures the current value and tax base contribution of those properties (also aggregated by community) and is not intended to project changes in those values, nor in the value of any specific property.
The projections herein are made to the best of our scientific knowledge and comport with our scientific and peer review standards. They are limited by a range of factors, including but not limited to the quality of property-level data, the resolution of coastal elevation models, the potential installment of defensive measures not captured by those models, and uncertainty around the future pace of sea level rise. More information on caveats and limitations can be found at http://www.ucsusa.org/underwater.
Neither the authors nor the Union of Concerned Scientists are responsible or liable for financial or reputational implications or damages to homeowners, insurers, investors, mortgage holders, municipalities, or other any entities. The content of this analysis should not be relied on to make business, real estate or other real world decisions without independent consultation with professional experts with relevant experience. The views expressed by individuals in the quoted text of this report do not represent an endorsement of the analysis or its results.
The need for a disclaimer becomes evident when looking into the details. The NOAA reference is GLOBAL AND REGIONAL SEA LEVEL RISE SCENARIOS FOR THE UNITED STATES NOAA Technical Report NOS CO-OPS 083
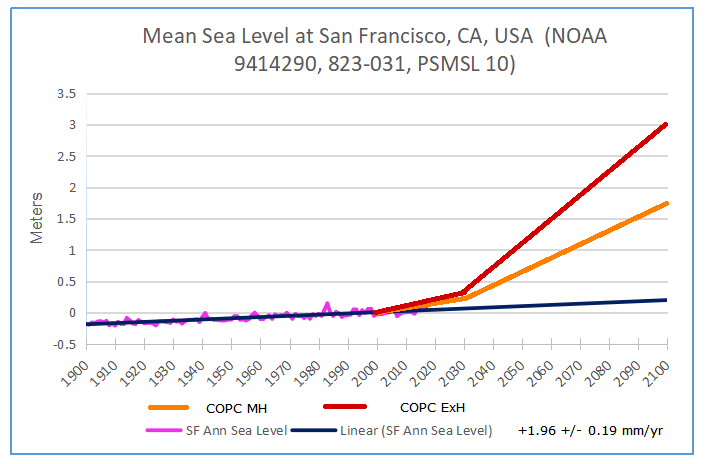
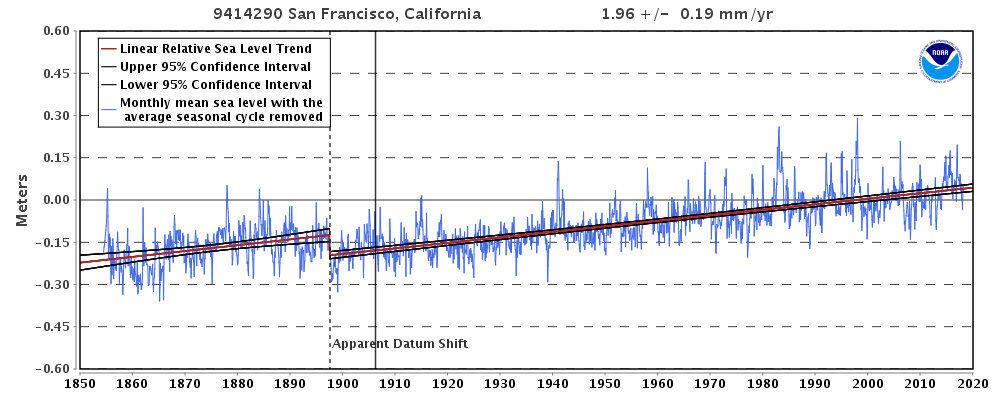
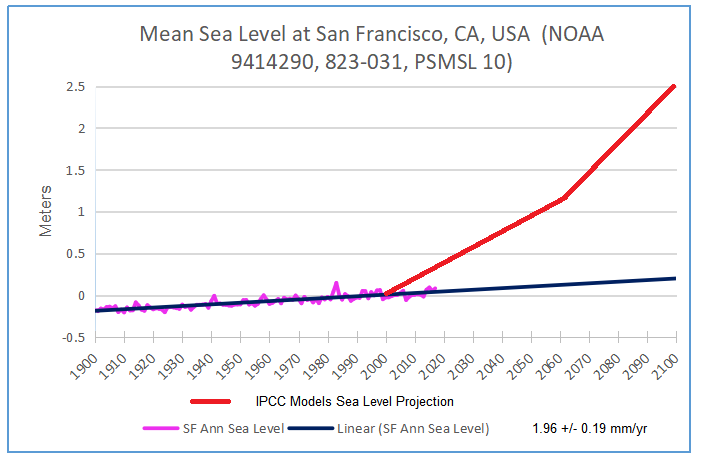
Since the text emphasizes four examples of their scenarios, let’s consider them here. First there is San Francisco, a city that sued oil companies over sea level rise. From tidesandcurrents comes this tidal gauge record It’s a solid, long-term record providing more than a century of measurements from 1900 through 2020. The graph below compares the present observed trend with climate models projections out to 2100.
Since the record is set at zero in 2000, the difference in 21st century expectation is stark. Instead of the existing trend out to around 20 cm, models project 2.5 meters rise by 2100.
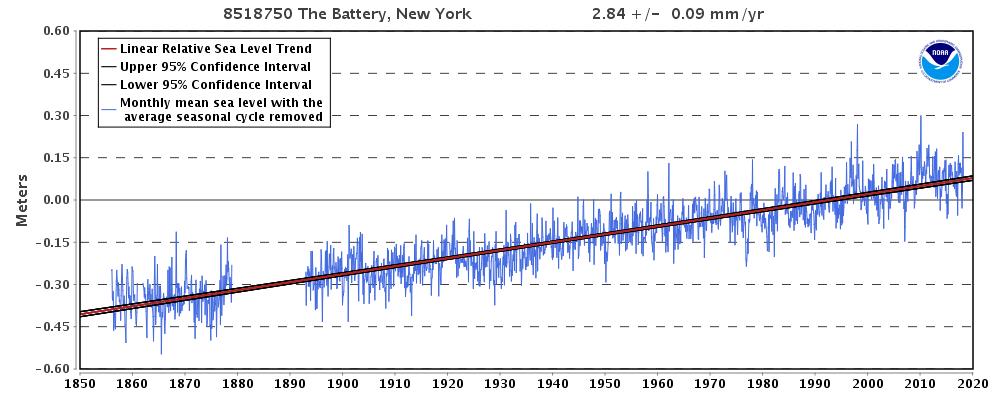
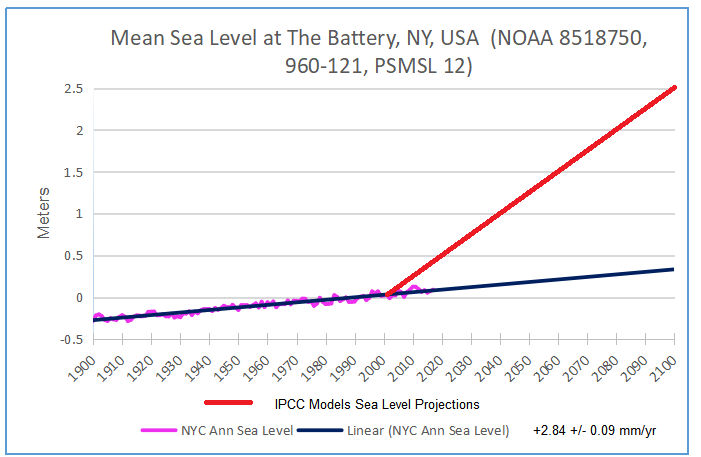
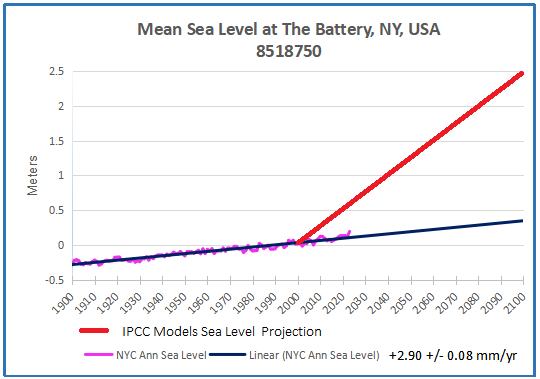
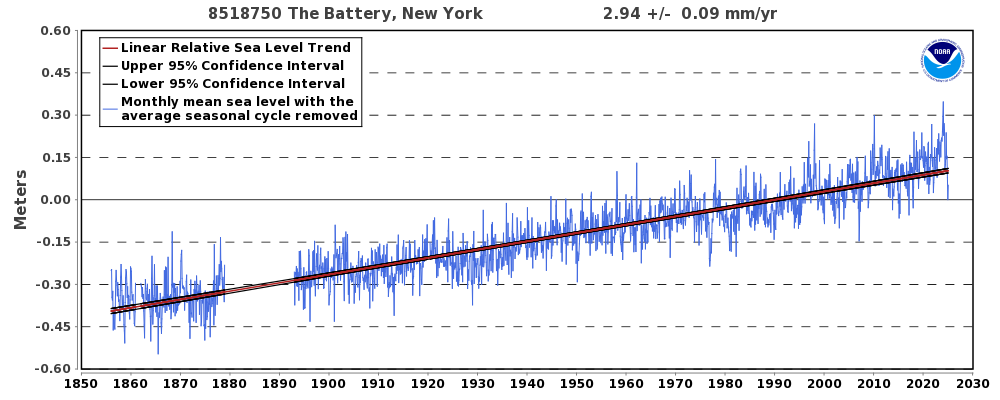
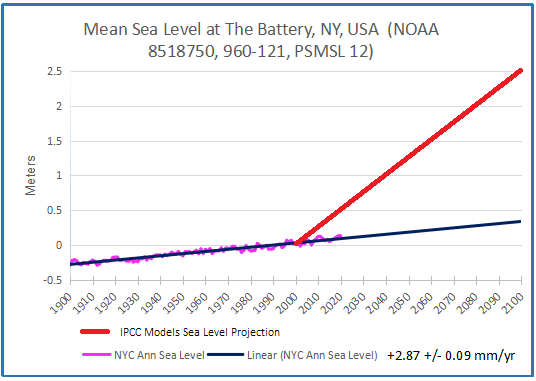
New York City is represented by the Battery tidal gauge:
Again, a respectable record with a good 20th century coverage. And the models say:
The red line projects 2500 mm rise vs. 287 mm, almost a factor of 10 more. The divergence is evident even in the first 20 years.
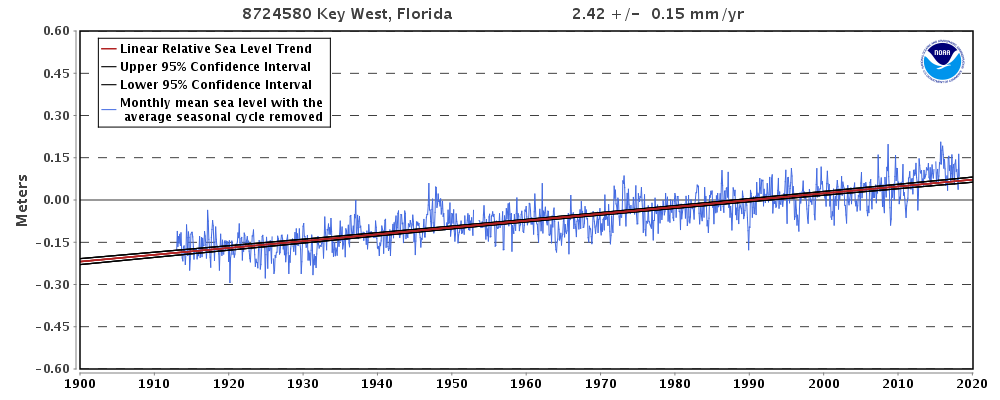
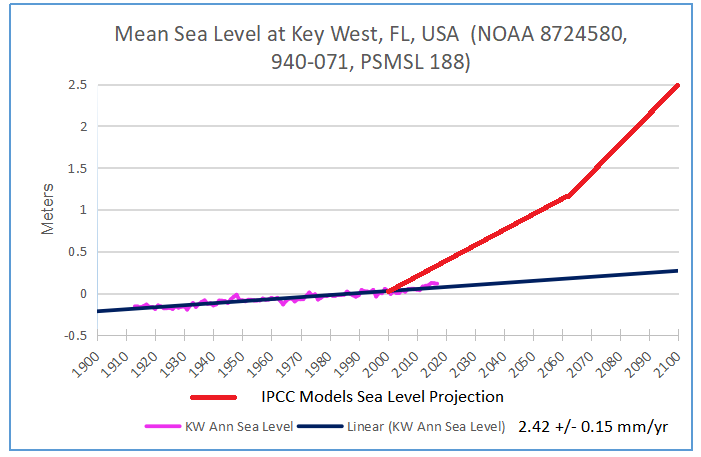
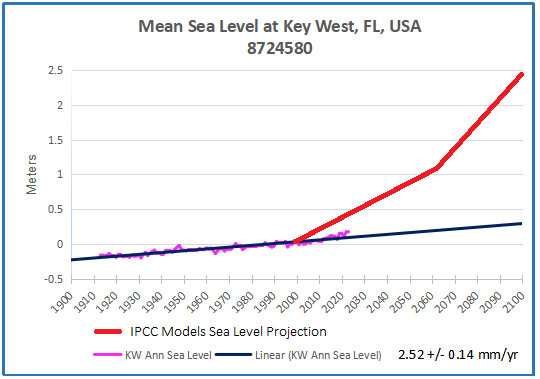
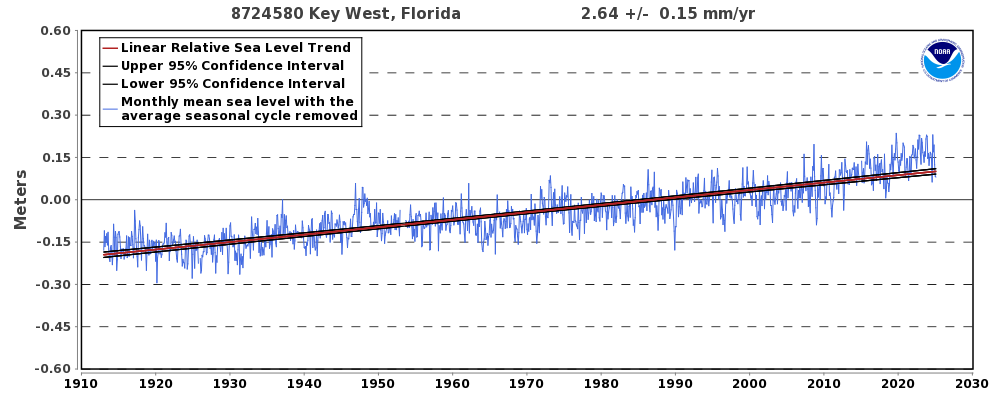
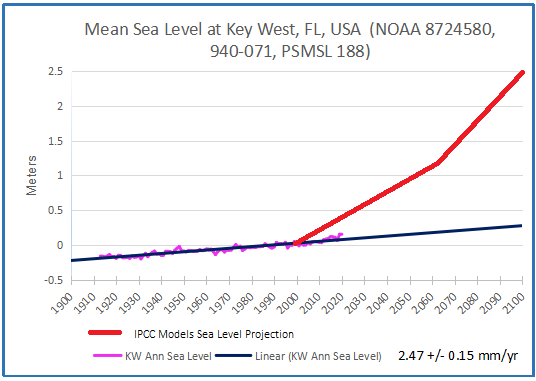
Florida comes in for a lot of attention, especially the keys, so here is Key West:
A similar pattern to NYC Battery gauge, and here is the projection:
The pattern is established: Instead of a rise of about 25 cm, the models project 250 cm.
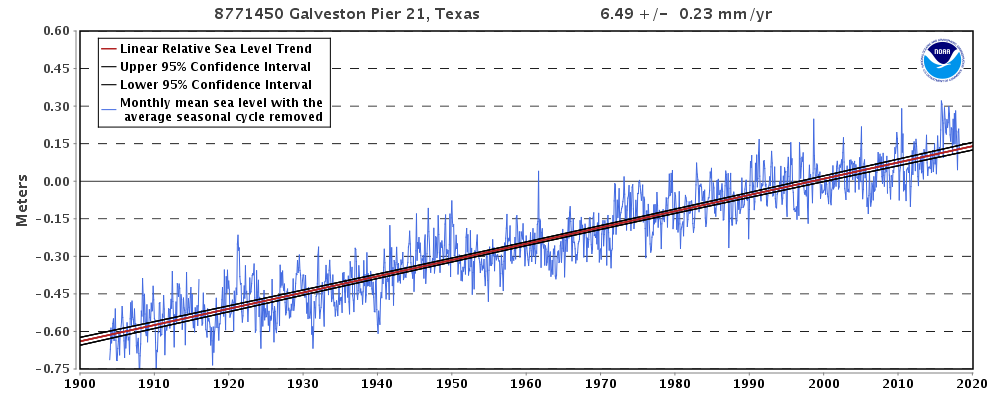
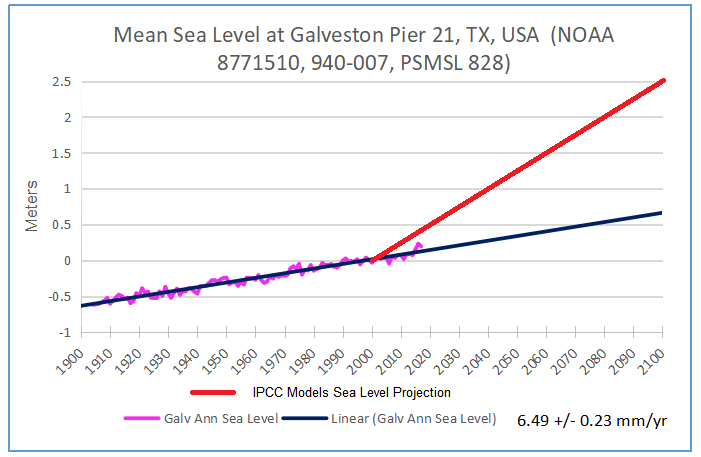
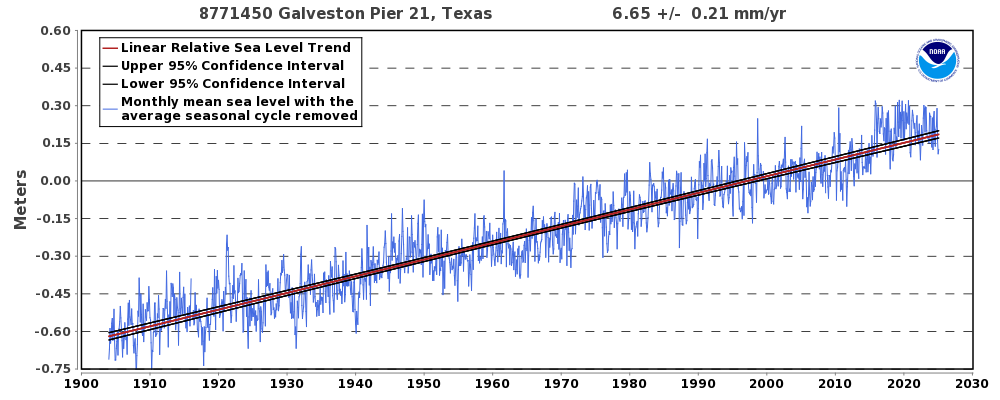
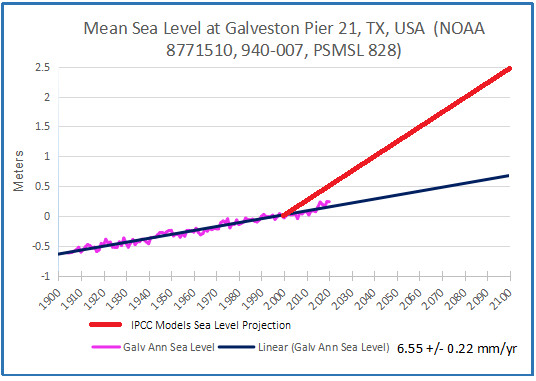
Finally, probably the worst case, and already well-known to all is Galveston, Texas:
The water has been rising there for a long time, so maybe the models got this one close.
The gap is less than the others since the rising trend is much higher, but the projection is still nearly four times the past. Galveston is at risk, all right, but we didn’t need this analysis to tell us that.
A previous post Unbelievable Climate Models goes into why they are running so hot and so extreme, and why they can not be trusted.
Footnote Regarding Alarms in Other Places
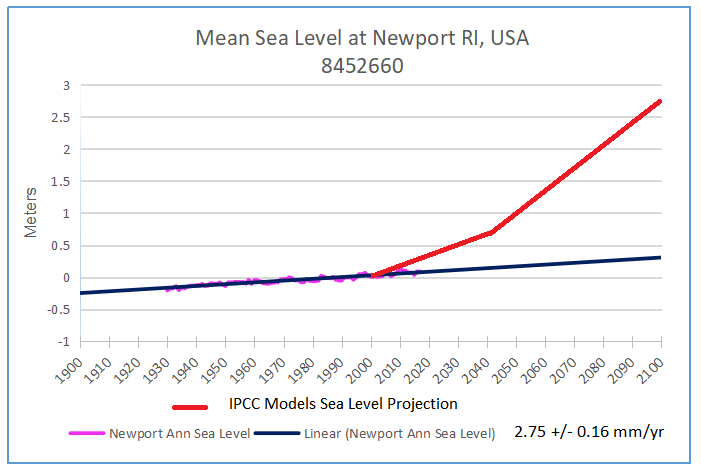
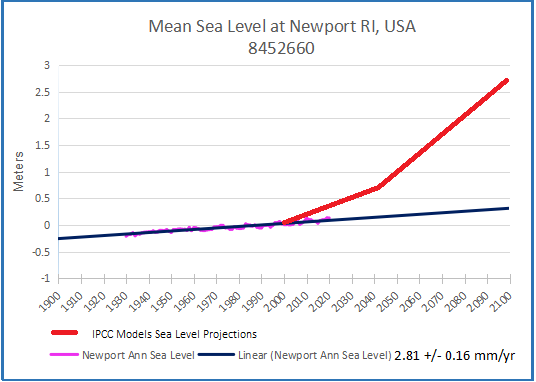
Recently there was a flap over future sea levels at Rhode Island, so I took a look at Newport RI, the best tidal gauge record there. Same Story: Observed sea levels already well below projections that are 10 times the tidal gauge trend.
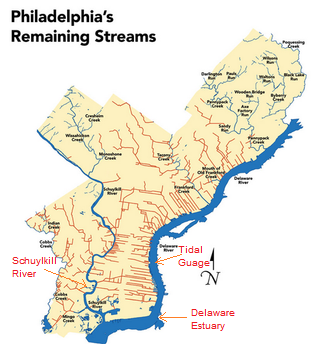
Another city focused upon urban flooding is Philadelphia. As with other coastal settlements, claims of sea level rise from global warming are unfounded.
Consumers of the climate religion media – which comprises pretty much every outlet from CNN leftward – should be forgiven for believing that a climate crisis requires that we ban the cheap, reliable energy that powers 80 percent of the world economy. After all, those outlets only run stories on one side of the question and brook no debate. The recent “Earth Day” issue of the Washington Post Sunday magazine is a case in point. It was devoted to finding evidence of climate changes caused by the warming gases that are emitted when fossil fuels are converted to energy. The most important of these emissions, by far, is carbon dioxide, a non-toxic plant, and plankton food. Unfortunately, the evidence started out weak and got weaker. And of course, the magazine refused to run letters pointing that out.
There was the requisite image of a polar bear clinging to a melting iceberg, and a story on lower counts of wood thrush in the DC region. But neither of those has anything to do with climate change. Polar bear counts, as all researchers have shown since the elegant animal became a favored fund-raiser for Green groups 20 years ago, are increasing. The wood thrush story itself pointed out that housing development and deer density are the primary problems.
The final insult to scientific fact, though, was the centerpiece story on flooding in communities around Norfolk, Virginia, which was presented with this subtitle: “Climate change is forcing many communities to imagine leaving the waterfront behind.” That claim mirrors the U.S. government’s 2018 summary National Climate Assessment, which includes Norfolk and its U.S. naval facilities as examples of places threatened by rising seas due to CO2-driven climate change.
However, according to the UN’s most recent report, the current global rate of sea-level rise – about an inch a decade, or 3.2 millimeters per year – is the same as it was 100 years ago. These estimates are uncertain, as sea-level is difficult to measure, but it is clear that the rise is related to the steady increase in global temperature since the Little Ice Age ended around 1800. All of this, of course, was long before 1950, which the UN reports were when industrial carbon dioxide was first emitted in sufficient quantities to cause measurable warming. Ironically, this UN information about sea-level rates being the same before and after CO2 warming was included in the scientifically-detailed version of the National Climate Assessment, contradicting the widely-publicized summary.
Sea-level rates include the fall, or “subsidence,” of land due to a variety of natural and human-caused processes that have nothing to do with temperature. The reason that sea-level rise is higher than average (about 3.9 mm per year, according to the U.S. Geological Service) at the mouth of the Chesapeake is that the land there is sinking at a rate that far exceeds the global subsidence rate. Who says so? Every scientist who studies it, as shown in the U.S. Geological Service’s 2013 report, Land Subsidence and Relative Sea-Level Rise in the Southern Chesapeake Bay Region: “Land subsidence has been observed since the 1940s in the southern Chesapeake Bay region at rates of 1.1 to 4.8 millimeters per year (mm/yr), and subsidence continues today. This land subsidence helps explain why the region has the highest rates of sea-level rise on the Atlantic Coast of the United States. Data indicate that land subsidence has been responsible for more than half the relative sea-level rise measured in the region.”
Why is land falling around Norfolk? As the USGS points out, “most land subsidence in the United States is caused by human activities.” The withdrawal of groundwater for human use and agriculture causes 80 percent of it nationally. In the Norfolk area, the USGS reports that water use compacts the clay layers in the aquifer system, permanently. That is why the USGS recommends moving Norfolk’s pumping activities far inland. Groundwater levels have already fallen by about 200 feet around Norfolk in the past century. But in Norfolk, there is yet another important source of land subsidence: what the USGS calls “glacial isostatic adjustment” and estimates at one mm per year. As land levels a few hundred miles north of Norfolk rebound from the melting of heavy, mile-high ice 18,000 to 12,000 years ago, Norfolk sinks in response.
For purposes of comparison, let’s use the data for the longest periods in the USGS report’s Chart 3: 3.9 mm annual rise in sea-level, but a long-term global average of 1.8 mm, both of which include land subsidence. But the local land subsidence is 2.8 mm, meaning that at least 72 percent of the change in flooding is due not to rising seas but sinking lands. Yet in the magazine article, there is no mention – not one word out of thousands – about land subsidence.
An additional possible factor in land subsidence is the geology around Norfolk, which is unique in America due to a remarkable event 35 million years ago: the impact of an asteroid that left a crater right at the opening of the Chesapeake 55 miles around and a mile deep. Some USGS scientists see the crater as a continuing factor in land subsidence, while others, as in the 2013 summary report, discount it. Like the rest of the possible factors in sea-level rise in Norfolk, the crater has nothing to do with CO2-driven “climate change.”
About the Authors
Ecologist Patrick Moore is the chair of the CO2 Coalition of 55 climate scientists and energy economists. Dr. Moore was a long-time leader of Greenpeace and leads the Allow Golden Rice Now campaign.
Climate statistician Caleb Stewart Rossiter is the Coalition’s executive director. Dr. Rossiter was formerly a professor of international affairs, mathematics, and statistics at American University.
A previous post (reprinted further on) took issue with climatists exploiting fear of flooding in Philly. This post adds more context disputing these attempts to blame urban flooding on sea level rise and to claim reducing CO2 emissions provides some sort of protection.
Background
Hydro engineers know that urban flooding is a complex problem with multiple factors beyond the effect from sea level. This paper by James Andrew Griffiths et al. presents the situation faced by all coastline cities: Modelling the impact of sea-level rise on urban flood probability in SE China. Excerpts in italics with my bolds
Estimating the likelihood of flooding in urban areas poses a greater challenge than in natural landscapes as land-surfaces are more heterogeneous and consist of many more runoff pathways. Data acquisition and process identification are also more difficult in urban areas as networks undergo more frequent and rapid change. To reduce complexity therefore, a lumped-parameter model can be used to represent hydrologically connected areas, rather than individual streets.
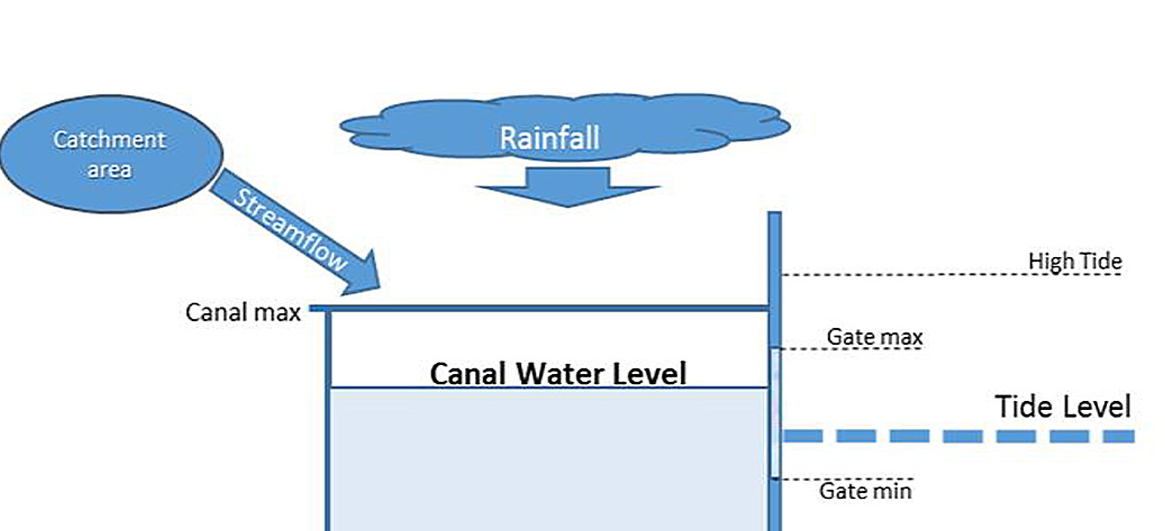
This diagram presents the typical situation.
The drainage systems of cities on China’s East coast generally consist of networks of channels or canals that are fed by streams from the surrounding catchments. The canal network is protected from tidal intrusion by a combination of sluice-gates, weirs and large flood-gates. Water is released from the system between high tides until a minimum water level is reached. If catchment runoff exceeds the rate of drainage from the system (for example during extreme rainfall) there is a risk of canal capacity exceedance and flooding. During normal operating conditions, a minimum water-level is preserved in canals to ensure sufficient water for irrigation, recreation or commercial use.
In summary, Urban drainage systems in coastal cities in SE China are characterized by often complex canal and sluice-gate systems that are designed to safely drain pluvial flooding whilst preventing tidal inundation. However, the risk of coastal flooding in the region is expected to increase over the next 50–100 years, as urban areas continue to expand and sea-levels are expected to rise. To assess the impact of projected sea-level rise on this type of urban drainage system, a one-dimensional model and decision support tool was developed. The model indicated that although sea-level rise represents a significant challenge, flood probability will continue to be most influenced by rainfall. Events that are significant enough to cause flooding will most likely be minimally impacted by changes to the tidal frame. However, it was found that a sea-level rise of up to 1.2 m by 2010 would result in increased drainage times and higher volumes of over-topping when flooding occurs.
Philadelphia is a Career Flood Fighter
Just like Rocky Balboa atop the Art Museum steps, Philadelphia has long contended with flood events and has always to be prepared. There have been 65 Philly floods since 1769, most recently in 2014. The city floods when water level in the Schuylkill basin goes over 11 feet, according to Historical Floods: Schuylkill River at Philadelphia, Pennsylvania from NOAA.
The table below shows the most severe events, 15 in all from 1869 to 2014, along with the crest level in feet and the measured streamflow in cubic feet per second.
Date of Flood
Crest (ft)
Streamflow (cfs)
Category
CO2 ppm
10/04/1869
17.00
135,000
Major
287.5
3/1/1902
14.80
98,000
Moderate
296.6
8/24/1933
14.70
96,200
Moderate
308.9
7/9/1935
14.10
82,000
Moderate
309.7
8/9/1942
13.10
71,500
Moderate
310.7
6/2/1946
14.57
94,600
Moderate
310.3
11/25/1950
14.32
89,800
Moderate
311.3
8/19/1955
14.32
90,100
Moderate
313.7
9/13/1971
13.28
70,300
Moderate
326.4
6/23/1972
14.65
103,000
Moderate
327.5
1/19/1996
13.36
79,000
Moderate
362.6
9/17/1999
14.10
92,500
Moderate
368.4
10/1/2010
13.05
76,300
Moderate
389.2
8/28/2011
13.56
83,900
Moderate
391.2
5/1/2014
13.91
88,300
Moderate
397.2
I have also provided the CO2 atmospheric concentrations for the flood dates, as reported by NASA. Climatists advocate reducing CO2 emissions as a policy to prevent urban flooding. However, the correlation between CO2 in ppm and Philly flood crests is -.58 and -.42 with streamflow. So the severity of Philly flooding has decreased while CO2 has risen. Perhaps burning more fossil fuels would be the prudent action.
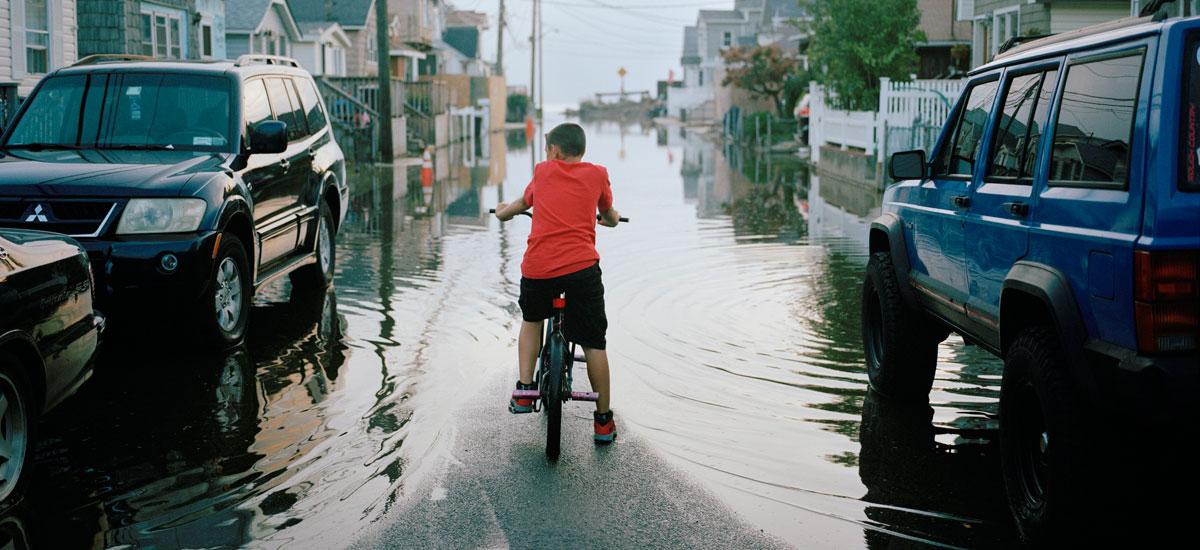
Mahbubur Meenar, a professor of community and regional planning at Temple, says that much of the flooding we see happens because of the city’s drainage system. In about 2/3 of the city, stormwater and wastewater — whatever comes out of your house or office building — drains through the same system. This happens because, well, the city is old. It’s so old, and so ingrained in the city’s infrastructure that it would be prohibitively expensive, if not impossible, to change.
On normal days, the drainage system works fine. Wastewater goes through and is treated before making its way to one of the rivers. But rain throws a wrench into the process. It flows into the same drains and mixes with the wastewater. The extra water can rise and flow onto the streets. Litter and fallen leaves don’t help, either. They can gather in the drains and make it more likely for flooding.
Another variable: Especially around Center City there are few natural resources that can capture water, i.e. streams and creeks. Nearly all of them have been filled in and turned into sewers. Dock Street is probably the best known example. That brick street in Society Hill used to be a creek. Dozens more have experienced the same fate, mostly in Center City and the neighborhoods closest to it. Check it out. The red lines indicate former bodies of water that have been filled in:
Creeks Flood Philly PHILLYH2O.ORG
If those creeks were still around, they could collect rainwater. Without them, stormwater lingers on the streets and has to go somewhere else — and in Philadelphia that’s through the drains where wastewater is already going.
“Depending on all these things,” Meenar said, “the road gets flooded.”
To some extent, there’s not much the Water Department can do. It can’t restore all of Philadelphia’s creeks or overhaul the city’s infrastructure, particularly in the oldest parts of the city where stormwater and wastewater drain together. But the Water Department is working on green stormwater infrastructure to combat the problem. There have been some inroads throughout the city’s neighborhoods — things like green roofs, rain gardens and even man-made wetlands. They are designed to collect stormwater.
The primary purpose of these measures actually has to do with keeping our rivers clean. Stormwater that hits Philly’s streets can pick up chemicals harmful to our rivers and to us if it ends up in our drinking water. By storing the stormwater for a while, it can be released into a system where it will be properly treated, rather than flowing directly into the Schuylkill or Delaware.
The secondary effect for green stormwater infrastructure is that it helps prevent flooding. Not all of the water is rushing into drains at once.
“They try to store water as long as possible and then slowly release it to the drain,” Meenar said.
So that’s how the City is dealing with flooding from rainstorms. Besides rain and severe storms, of course, Philadelphia’s 3,000 miles of leaky pipes can cause flooding, too. That’s an entirely different problem, though.
For example, just today Philadelphia NBC TV affiliate aired a segment declaring Climate Change Studies Show Philly Underwater. Previously Philly CBS station had their piece shown below.
All of this fearmongering over sea level rise is a coordinated campaign to terrorize coastal dwellers and landowners. UCS (Union of Concerned Scientists) together with Climate Central are collaborating to do a drip, drip, drip water torture treatment exploiting the public addiction to television.
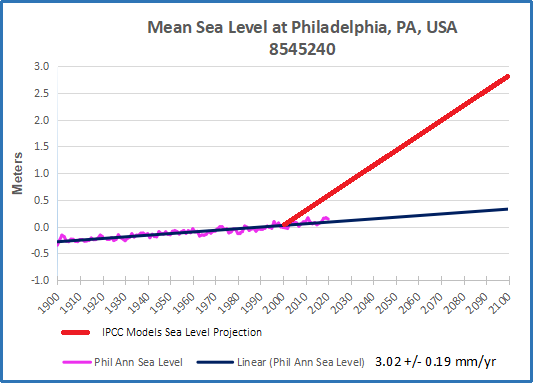
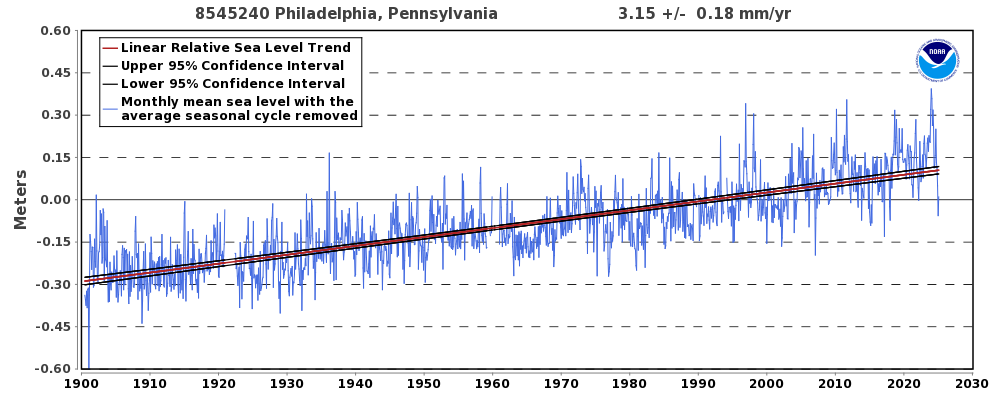
Philadelphia, PA – Station ID: 8545240
What They Are Not Telling People
From NOAA Tides and currents comes this long record of service by the tidal guage at Philadelphia.
In records running back to 1900, Philadelphia has never seen waterfront flooding that reaches 4 feet above the local high tide line. But under a mid-range sea level rise scenario, floods within the Delaware Estuary exceeding 4 feet are more likely than not to take place by 2040, less than one 30-year mortgage cycle away. Under a low-range scenario, chances are just below even; and under a high-range scenario, they reach 3 in 4. At the other end of the spectrum, under high-range projections, there is roughly a 4 in 5 chance of floods above 9 feet by the end of the century.
Putting the projections together with the observational record gives this graph. Both the record and projection are zero at year 2000. If the past trend continues, a further rise of 30 cm would be observed by 2100. If Climate Central model-based projection is true, the red line shows 122 cm rise by 2040, and 274 cm by 2100. So alarmists are projecting in 20 years, Philadelphia will get four times the rise that occurred in the last 100 years. Even now, in 2019, the projection is off by 50 cm, and observations are going down.
Not to worry, UCS provides this Disclaimer:
Neither the authors nor the Union of Concerned Scientists are responsible or liable for financial or reputational implications or damages to homeowners, insurers, investors, mortgage holders, municipalities, or other any entities. The content of this analysis should not be relied on to make business, real estate or other real world decisions without independent consultation with professional experts with relevant experience. The views expressed by individuals in the quoted text of this report do not represent an endorsement of the analysis or its results.
None of that uncertainty appears in the TV clips. And even worse, computing technology and desktop publishing are being exploited not to empower people, but to terrify them. An entire web page is devoted to Google Earth images photoshopped to show chunks of Philadelphia under water. Here’s what Philly could look like in 2100 if sea levels rise
Conclusion
More and more, the media are pushing people into the Hobbesian Choice. Thomas Hobbes (1544–1631) believed that man must choose between living in a state of nature (a life which is “solitary, poor, nasty, brutish, and short”) or suffering under an arbitrary and absolute government. And the media content forces another awful decision: Either believe nothing (or the opposite) of what you read or see on TV, or go into full panic mode.
Footnote
The hottest temperatures ever reported in Phoenix came in January 2015, when Fox 10 weatherman Cory McCloskey faced a malfunctioning temperature map on live television. “Wow, 750 degrees in Gila Bend right now,” he said, without breaking a sweat. “And 1,270 in Ahwatukee. Now, I’m not authorized to evacuate, but this temperature seems pretty high.” More than 6 million people have watched the blooper on YouTube.
For example, just today Philadelphia NBC TV affiliate aired a segment declaring Climate Change Studies Show Philly Underwater. Previously Philly CBS station had their piece shown below.
All of this fearmongering over sea level rise is a coordinated campaign to terrorize coastal dwellers and landowners. UCS (Union of Concerned Scientists) together with Climate Central are collaborating to do a drip, drip, drip water torture treatment exploiting the public addiction to television.
What They Are Not Telling People
From NOAA Tides and currents comes this long record of service by the tidal guage at Philadelphia.
In records running back to 1900, Philadelphia has never seen waterfront flooding that reaches 4 feet above the local high tide line. But under a mid-range sea level rise scenario, floods within the Delaware Estuary exceeding 4 feet are more likely than not to take place by 2040, less than one 30-year mortgage cycle away. Under a low-range scenario, chances are just below even; and under a high-range scenario, they reach 3 in 4. At the other end of the spectrum, under high-range projections, there is roughly a 4 in 5 chance of floods above 9 feet by the end of the century.
Putting the projections together with the observational record gives this graph. Both the record and projection are zero at year 2000. If the past trend continues, a further rise of 30 cm would be observed by 2100. If Climate Central model-based projection is true, the red line shows 122 cm rise by 2040, and 274 cm by 2100. So alarmists are projecting in 20 years, Philadelphia will get four times the rise that occurred in the last 100 years. Even now, in 2019, the projection is off by 50 cm, and observations are going down.
Not to worry, UCS provides this Disclaimer:
Neither the authors nor the Union of Concerned Scientists are responsible or liable for financial or reputational implications or damages to homeowners, insurers, investors, mortgage holders, municipalities, or other any entities. The content of this analysis should not be relied on to make business, real estate or other real world decisions without independent consultation with professional experts with relevant experience. The views expressed by individuals in the quoted text of this report do not represent an endorsement of the analysis or its results.
None of that uncertainty appears in the TV clips. And even worse, computing technology and desktop publishing are being exploited not to empower people, but to terrify them. An entire web page is devoted to Google Earth images photoshopped to show chunks of Philadelphia under water. Here’s what Philly could look like in 2100 if sea levels rise
Conclusion
More and more, the media are pushing people into the Hobbesian Choice. Thomas Hobbes (1544–1631) believed that man must choose between living in a state of nature (a life which is “solitary, poor, nasty, brutish, and short”) or suffering under an arbitrary and absolute government. And the media content forces another awful decision: Either believe nothing (or the opposite) of what you read or see on TV, or go into full panic mode.
Footnote
The hottest temperatures ever reported in Phoenix came in January 2015, when Fox 10 weatherman Cory McCloskey faced a malfunctioning temperature map on live television. “Wow, 750 degrees in Gila Bend right now,” he said, without breaking a sweat. “And 1,270 in Ahwatukee. Now, I’m not authorized to evacuate, but this temperature seems pretty high.” More than 6 million people have watched the blooper on YouTube.
To believe humans are dangerously warming earth’s climate, you have to swallow a bunch of unbelievable notions. You have to think the atmosphere drives temperature, instead of the ocean with 1000 times the heat capacity. You have to disregard the sun despite its obvious effects from summer to winter and longer term. You have to think CO2 drives radiative heat transfers, instead of H2O which does 95% of the radiative work. You have to think rises in CO2 cause temperatures to rise, rather than the other way around. You have to forget it was warmer than now in the Middle Ages, warmer still in the Roman era, and warmest of all during Minoan times. And on and on. The global warmist narrative is full of ideas upside down and backwards, including many reversals of cause and effect.
It is like a massive hot air balloon, so why doesn’t it deflate? Answer: It is because so many interests are served by keeping it alive and pumping up public fears. In this brief video, Richard Lindzen explains how it serves politicians, NGOs and the media to be on the global warming bandwagon.
In addition, there are businesses and industries that can and do contribute to global warming fears to further their own interests. For example,Terence Corcoran explains how the insurance industry benefits by promoting global warming in his Financial Post article Why insurers keep hyping ‘climate risks’ that don’t materialize Excerpts in italics with my bolds.
Insurers are urging the government to invest in natural, green infrastructure even though engineers call it ineffective
For more than two decades, insurance firms facing rising property damage costs in Canada and abroad have sought some kind of salvation in the environmental movement’s climate change crusade.
The latest insurance industry initiative wanders even deeper into the quagmire of green policy advocacy. Combating Canada’s Rising Flood Costs, a new report from the Insurance Bureau of Canada (IBC), urged governments across the country to adopt “natural infrastructure” to limit escalating climate change risks.
The report continues the insurance industry’s 20-year practice of hyping climate risks. At an industry conference in 1999, one executive warned: “The increase in extreme weather events (in Canada) is part of a global trend in which climate change has played a significant role.”
The evidence was non-existent then, and not much has changed in the interim, despite the industry’s claim that climate-driven flood risk is escalating. According to the insurers, Canada needs all levels of government to turn to natural and “green” infrastructure before installing traditional “grey” infrastructure.
The first priority is to retain existing ponds, streams, trees and other natural infrastructure systems, according to the report. The second is to rebuild and replace natural infrastructure that has been lost. And the third — building new and replacing old sewers, pipes, concrete drainways, diversions, improved building techniques — should be undertaken only on a “build what you must” basis.
However, that’s not what the Ontario Society of Professional Engineers recommends. In an April report for provincial officials it said: “Numerous studies have demonstrated that green infrastructure does not provide a flood risk reduction benefit.” The engineers advised that protective plumbing, pump-station modifications and sanitary-sewer improvements are among the measures that should be taken to control urban flooding.
Insurers have an understandable self-interest in promoting infrastructure spending and government policies, laws and regulations that would protect their businesses from rising insurance claims. But the report reads like a document from the World Wildlife Fund. It was sponsored by the IBC and “generously supported” by Intact Financial Corp., Canada’s largest insurance company. The University of Waterloo-based Intact Centre on Climate Adaptation (funded by Intact, which has given millions to the centre) was also involved.
Despite the heavy corporate involvement, the CBC opened up about 10 minutes of The National, it’s flagship news show, to the industry report when it was released last month. Would The National give the pipeline, mining and telecom companies 10 minutes to promote their views?
The stars of The National that night were Blair Feltmate, head of the Centre on Climate Adaptation, and CBC News meteorologist Johanna Wagstaffe. Both repeated the insurance industry’s 20-year-old claims that climate devastation is ravaging Canada through extreme weather events — and warned the public to look out for rising insurance premiums if nothing is done. Here’s a sample:
Wagstaffe: “Every single extreme weather event is connected to a warming climate because… as we see longer and hotter summers, we see more moisture being held in our atmosphere, we see higher water levels, that means every single event is amplified by climate change.”
Feltmate: “I totally agree. So all the modelling on climate change that’s been done over the last many years by groups like the Intergovernmental Panel on Climate Change, which is a group of several hundred climate scientists… their predictions are that, yes, climate change has happened, is happening and will continue to happen. And we’re seeing the expression of extreme weather events as a result of that.”
Feltmate added the magnitude of flooding, which is the No. 1 cost due to climate change in the country, is increasing.
Such climate warnings have been official insurance industry mantra since the 1990s. Flooding and extreme weather are becoming more frequent, the industry said again and again.
Not true, according to the latest IPCC science report released this month. The impacts chapter said: “There is low confidence due to limited evidence, however, that anthropogenic climate change has affected the frequency and the magnitude of floods.” Furthermore, from 1950 to 2012 “precipitation and (fluvial) runoff have… decreased over most of Africa, East and South Asia, eastern coastal Australia, southeastern and northwestern United States, western and eastern Canada.”
Despite a lack of evidence, the industry recently claimed conditions are so bad in Canada that “weather events that used to occur every 40 years now happen every six years” — a factoid attributed to a 2012 IBC-commissioned report by veteran Western University climatologist and climate-policy activist Gordon McBean. He cited an Environment Canada report to support the 40-to-six claim, but in 2016 Canadian Underwriter magazine published a note quoting an Environment Canada official who said studies “have not shown evidence to support” the 40-to-six year frequency shift. The claim has since been scrubbed from the insurance industry’s communications on climate issues.
The insurers have a newer warning widget in the form of a graphic that appears to show a dramatic rise in catastrophic insurance losses due to climate change. A trend line rises from the mid-1980s to 2017 to a $5-billion peak with the 2016 Fort McMurray fire (see first accompanying chart). The new IBC flood report said these numbers illustrate the financial impacts of climate change and extreme weather events that are being felt by a growing number of homeowners and communities. These losses “averaged $405 million per year between 1983 and 2008, and $1.8 billion between 2009 and 2017.”
The graphic contains three dubious elements as a source for a flood report. First is an inconsistency in the source of data, a problem identified by Robert Muir, a professional engineer and member of in infrastructure task force at the Ontario Society of Professional Engineers. The 1983–2007 data set was collected through informal industry surveys, while the 2008–2017 data are tabulated systematically by an independent agency.
Data inconsistency may explain the bizarre result that the insurance industry had zero losses due to floods, water, rain and storm perils in four of 17 years between 1983 and 2000.
Second, the IBC graph also counts fire losses, including the Fort McMurray fire of 2016 — an event unrelated to flood risk. Removal of fire losses significantly flattens the curve (see the second accompanying chart). If the 2013 floods in Alberta and Toronto are treated as possible one-off freak events, the average insurance losses come to $182 million in the 1990s, $198 million during the 2000s and $268 million over the past nine years, which is not a dramatic shift considering there are many other explanations for insurance losses, including increasing individual wealth beyond mere per capita GDP values, urbanization, failure of governments to maintain decaying ancient water infrastructures, and the risks people take by moving into flood-prone areas.
The insurance industry has an obvious motive in highlighting flood risk. It is part of a concerted climate campaign by NGOs, governments and sustainable development advocates. As one executive put it at a 2016 conference the objective is to “monetize” the flood risk, an idea the IBC is pushing with the help of a relatively new “flood model” that identifies high-risk areas.
When risks are real, people should of course take steps to avoid them or get protection, including taking out insurance. But the industry seems to be heading in a questionable direction by promoting insurance for climate risks that may not exist and at the same time advocating for green protective infrastructure (see below) that will cost more and may — if the engineers are right — increase the risk.
The graph displays three projections of mean sea level at San Francisco CA. The tidal gauge trend adds 0.2 meters (0.7 feet) by 2100. California Ocean Protection Council (COPC) has issued 2018 guidance on sea level rise along the California coastline. COPC takes IPCC models as gospel truth and projects future sea levels accordingly. The orange line represents COPC Medium-High risk aversion and produces 1.75 meters (5.7 feet) rise by 2100. The red line represents COPC Extremely High risk avoidance (worst case) resulting in 3.1 meters (10.2 feet) rise by 2100.
In the wake of the city’s losing lawsuit against Big Oil companies, new model projections are going for more scary numbers.
Sea level rise projections from the state Ocean Protection Council were increased earlier this year from a maximum of 66 inches to as high as 122 inches by 2100. That projection includes both sea level rise, which will account for 11 to 24 inches by 2050, and coastal erosion and shoreline flooding.
Planning Department Director John Rahaim said at a Planning Commission hearing Thursday that certain areas of The City will likely see “routine flooding” by 2030.
“Some of the numbers… are in big ranges and there’s this tendency to think of sea level rise as so far in the future that it’s hard to get people’s attention,” Rahaim said. “There are things that are happening in the short term that we really have to start thinking about. It’s not something we can put off to the next generation.”
The commission was briefed Thursday on the progress of efforts to curb the impacts of inundated shorelines since the publication of the 2016 Sea Level Rise Action Plan, which directed city agencies to assess the impacts of sea level rise on San Francisco.
State projections for how high the ocean could rise this century have as much as doubled, giving new urgency to efforts to plan for mitigation efforts, San Francisco planning officials said this week. Sea level rise projections from the state Ocean Protection Council were increased earlier this year from a maximum of 66 inches to as high as 122 inches by 2100. (Kevin N. Hume/S.F. Examiner)
“We have been working with our public infrastructure agencies to really understand, ‘What does this mean for MUNI? What does this mean for our Public Utilities Commission, for our parks?” Maggie Wenger, an adaption planner with the department. “And then what does it mean if those systems face impacts, for the people who live here, work here and come to visit.”
Preliminary findings suggest that between 17 and 84 miles of streets, 242 to 704 acres of open space, 335 acres to 1,203 acres of public land and 2 to 20 schools will be affected by flooding between 2030 and 2100.
The assessment found that roughly 6 percent of land area along San Francisco’s coastal areas is vulnerable to sea level rise.
“Not all areas in this zone are equally vulnerable,” said Wenger, adding that some are likely to see flooding impacts “in the next decades, others in the next century.”
Along with the assessment, The City is currently rolling out a its Port Seawall Earthquake Safety program and has adopted the Islais Creek Southeast/Southeast Mobility Adaptation strategy which focuses on design solutions to strengthening the area and improving the resilience of transportation assets.
A more than $400 million bond proposal to repair San Francisco’s seawall will go before San Francisco voters in November.
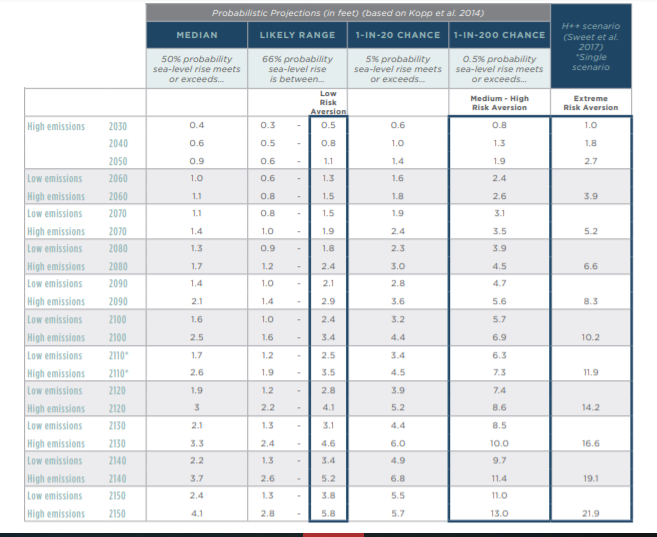
Table 1 is Projected Sea-Level Rise (in feet) for San Francisco
Probabilistic projections for the height of sea-level rise shown below, along with the H++ scenario (depicted in blue in the far right column), as seen in the Rising Seas Report. The H++ projection is a single scenario and does not have an associated likelihood of occurrence as do the probabilistic projections. Probabilistic projections are with respect to a baseline of the year 2000, or more specifically the average relative sea level over 1991 – 2009. High emissions represents RCP 8.5; low emissions represents RCP 2.6. Recommended projections for use in low, medium-high and extreme risk aversion decisions are outlined in blue boxes below.
Summary
Note that the Medium High projection adds 5 feet on top of the tidal gauge trend of 0.7 feet, a multiple of 8 times greater based upon climate models. By 2030, both COPC projections already exceed the end of century tidal gauge rise. Note also they project actual sea level rise may be only on the order of 1 or 2 feet by 2050, with rise from erosion on top. This compares to 0.3 feet estimated by 2050 from the tidal gauge including land movements.
By all means repair the sea wall to resist an additional foot or two. But the rest of it is coming from Puff the Magic Dragon.
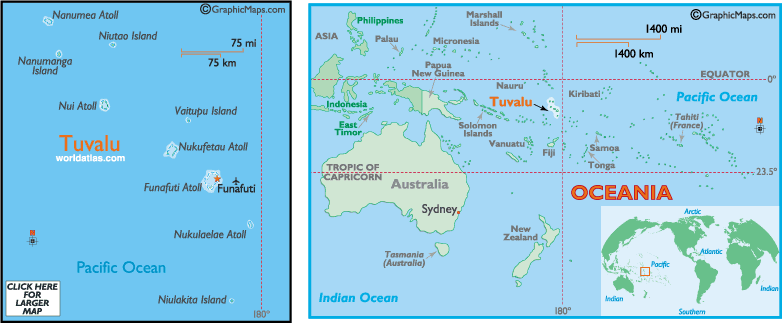
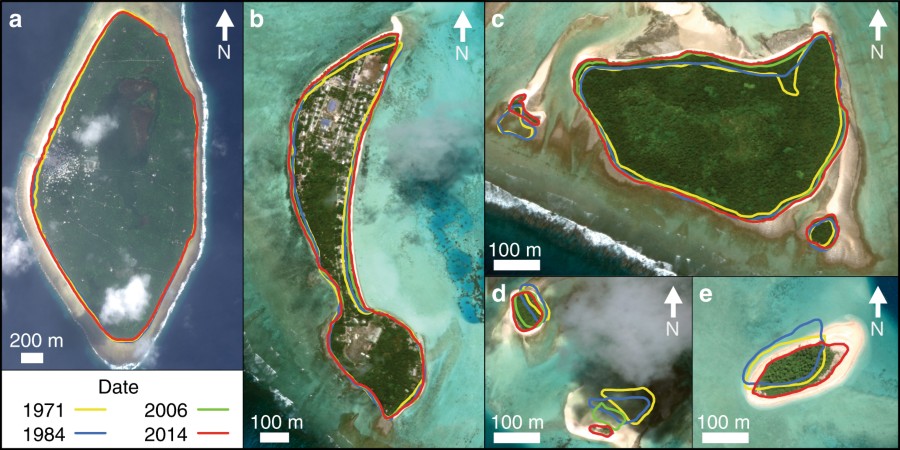
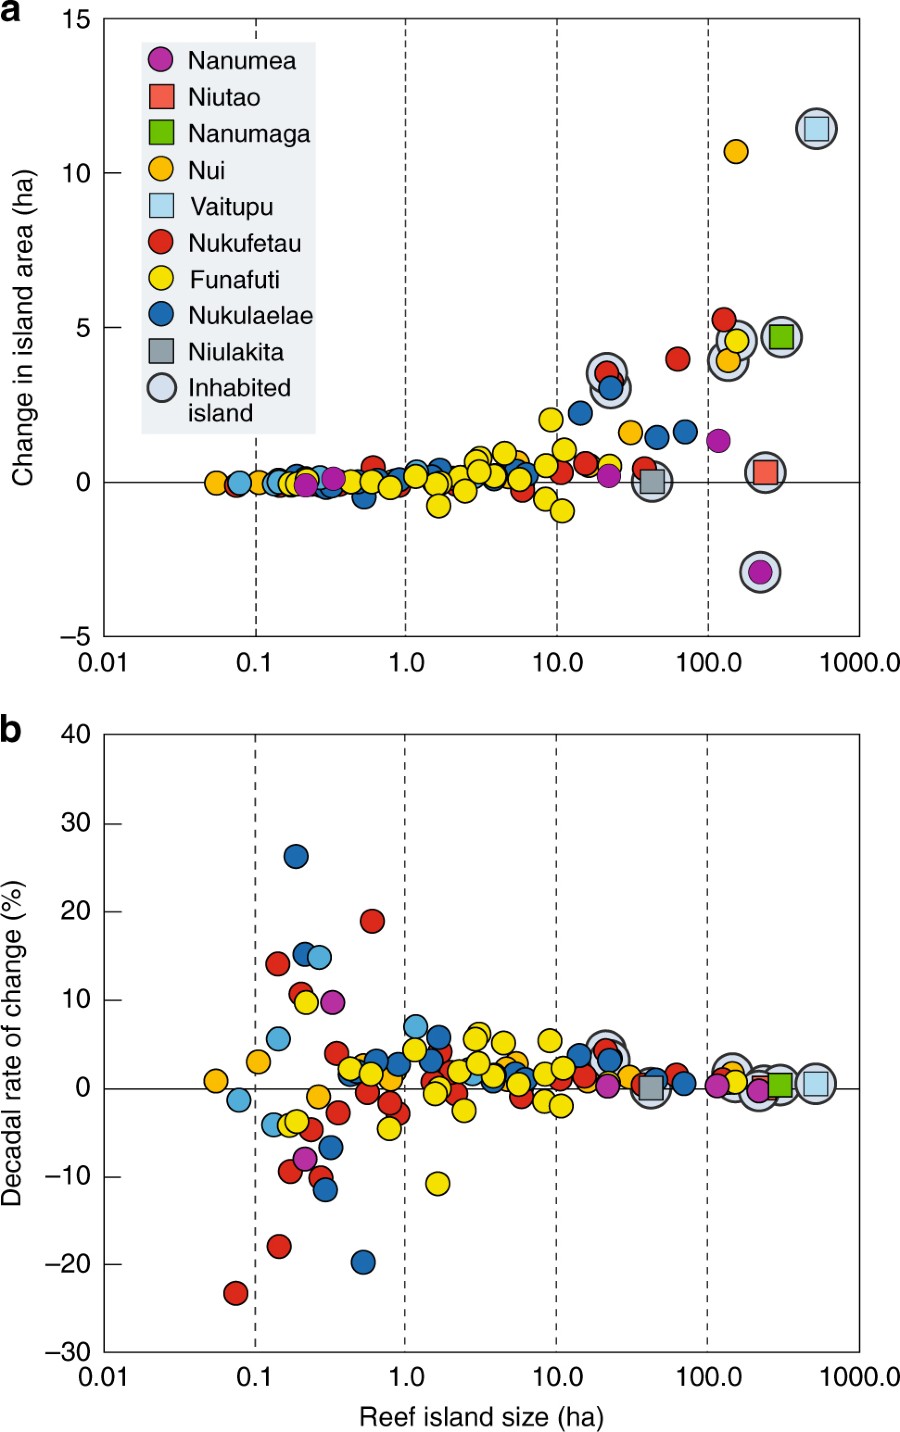
Sea-level rise and climatic change threaten the existence of atoll nations. Inundation and erosion are expected to render islands uninhabitable over the next century, forcing human migration. Here we present analysis of shoreline change in all 101 islands in the Pacific atoll nation of Tuvalu. Using remotely sensed data, change is analysed over the past four decades, a period when local sea level has risen at twice the global average (~3.90 ± 0.4 mm.yr−1). Results highlight a net increase in land area in Tuvalu of 73.5 ha (2.9%), despite sea-level rise, and land area increase in eight of nine atolls. Island change has lacked uniformity with 74% increasing and 27% decreasing in size. Results challenge perceptions of island loss, showing islands are dynamic features that will persist as sites for habitation over the next century, presenting alternate opportunities for adaptation that embrace the heterogeneity of island types and their dynamics.
Under these environmental scenarios, conjectures of habitability and mobility become entwined and have driven an urgency in socio-political discourse about atoll nation futures and human security. Strategies for adaptation to changing biophysical conditions are coupled with narratives of environmentally determined exodus. Such persistent messages have normalised island loss and undermined robust and sustainable adaptive planning in small island nations. In their place are adaptive responses characterised by in-place solutions, seeking to defend the line and include solutions such as reclamation and seawalls, potentially reinforcing maladaptive practices. Notwithstanding the maladaptive outcomes of such approaches, such dialogues present a binary of stay and defend the line or eventual displacement. There is limited space within these constructs to reflect on possibilities that a heterogeneous archipelago (size, number and dynamics of islands) may offer in terms of sustained habitability, beyond the historic imprint of colonial agendas and entrenched land tenure systems that may constrain novel adaptation responses at the national scale.
Summary data of physical island change of islands in Tuvalu between 1971 and 2014. a Absolute changes in island area in hectares with respect to island size. b Percentage change in islands per decade with respect to island size. Raw data contained in Supplementary Data 1. Note: square symbols denote reef platform islands; solid circles denote atoll rim islands; and light blue circles enclosing symbols denote populatedislands
We argue that indeed there are a more nuanced set of options to be explored to support adaptation in atoll states. Existing paradigms are based on flawed assumptions that islands are static landforms, which will simply drown as the sea level rises4,23. There is growing evidence that islands are geologically dynamic features that will adjust to changing sea level and climatic conditions. However, such studies have typically examined a limited number of islands within atoll nations, and not provided forward trajectories of land availability, thereby limiting the findings for broader adaptation considerations. Furthermore, the existing range of adaptive solutions are narrowly constrained and do not reflect the inherent physical heterogeneity and dynamics of archipelagic systems.
Here we present the first comprehensive national-scale analysis of the transformation in physical land resources of the Pacific atoll nation Tuvalu, situated in the central western Pacific (Supplementary Note 1). Comprising 9 atolls and 101 individual reef islands, the nation is home to 10,600 people, 50% of whom are located on the urban island of Fogafale, in Funafuti atoll. We specifically examine spatial differences in island behaviour, of all 101 islands in Tuvalu, over the past four decades (1971–2014), a period in which local sea level has risen at twice the global average (Supplementary Note 2). Surprisingly, we show that all islands have changed and that the dominant mode of change has been island expansion, which has increased the land area of the nation. Results are used to project future landform availability and consider opportunities for a vastly more nuanced and creative set of adaptation pathways for atoll nations.
This post is about the SEAFRAME network measuring sea levels in the Pacific, and about the difficulty to discern multi-decadal trends of rising or accelerating sea levels as evidence of climate change.
Update July 9, 2018
Asked a question today about sea levels and Pacific islands, I referred to this article. Realizing it was posted 2 years ago, it seemed important to check the most recent project report. Thus at the bottom there are now results through May 2018.
Update May 10 below, regarding recent Solomon Islands news
Pacific Sea Level Monitoring Network
The PSLM project was established in response to concerns voiced by Pacific Island countries about the potential effects of climate change. The project aims to provide an accurate long-term record of sea levels in the area for partner countries and the international scientific community, and enable the former to make informed decisions about managing their coastal environments and resources.
In 1991, the National Tidal Facility (NTF) of the Flinders University of South Australia was awarded the contract to undertake the management of the project. Between July 1991 and December 2000 sea level and meteorological monitoring stations were installed at 11 sites. Between 2001 and 2005 another station was established in the Federated States of Micronesia and continuous global positioning systems (CGPS) were installed in numerous locations to monitor the islands’ vertical movements.
The 14 Pacific Island countries now participating in the project provide a wide coverage across the Pacific Basin: the Cook Islands, Federated States of Micronesia, Fiji, Kiribati, Marshall Islands, Nauru, Niue, Palau, Papua New Guinea, Samoa, Solomon Islands, Tonga, Tuvalu and Vanuatu.
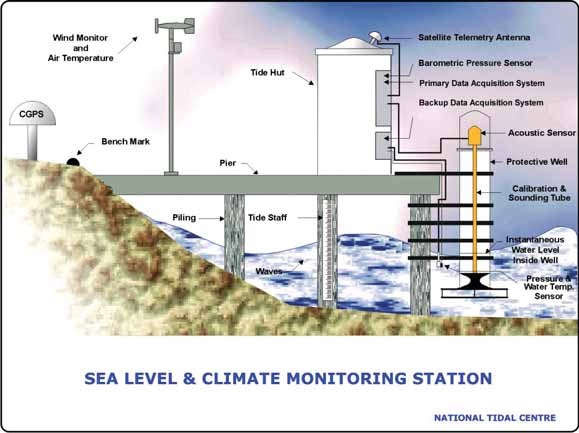
Each of these SEA Level Fine Resolution Acoustic Measuring Equipment (SEAFRAME) stations in the Pacific region are continuously monitoring the Sea Level, Wind Speed and Direction, Wind Gust, Air and Water Temperatures and Atmospheric Pressure.
In addition to its system of tide gauge facilities, the Pacific Sea-Level Monitoring Network also includes a network of earth monitoring stations for geodetic observations, implemented and maintained by Geoscience Australia. The earth monitoring installations provide Global Navigation Satellite System (GNSS) measurements to allow absolute determination of the vertical height of the tide gauges that measure sea level.
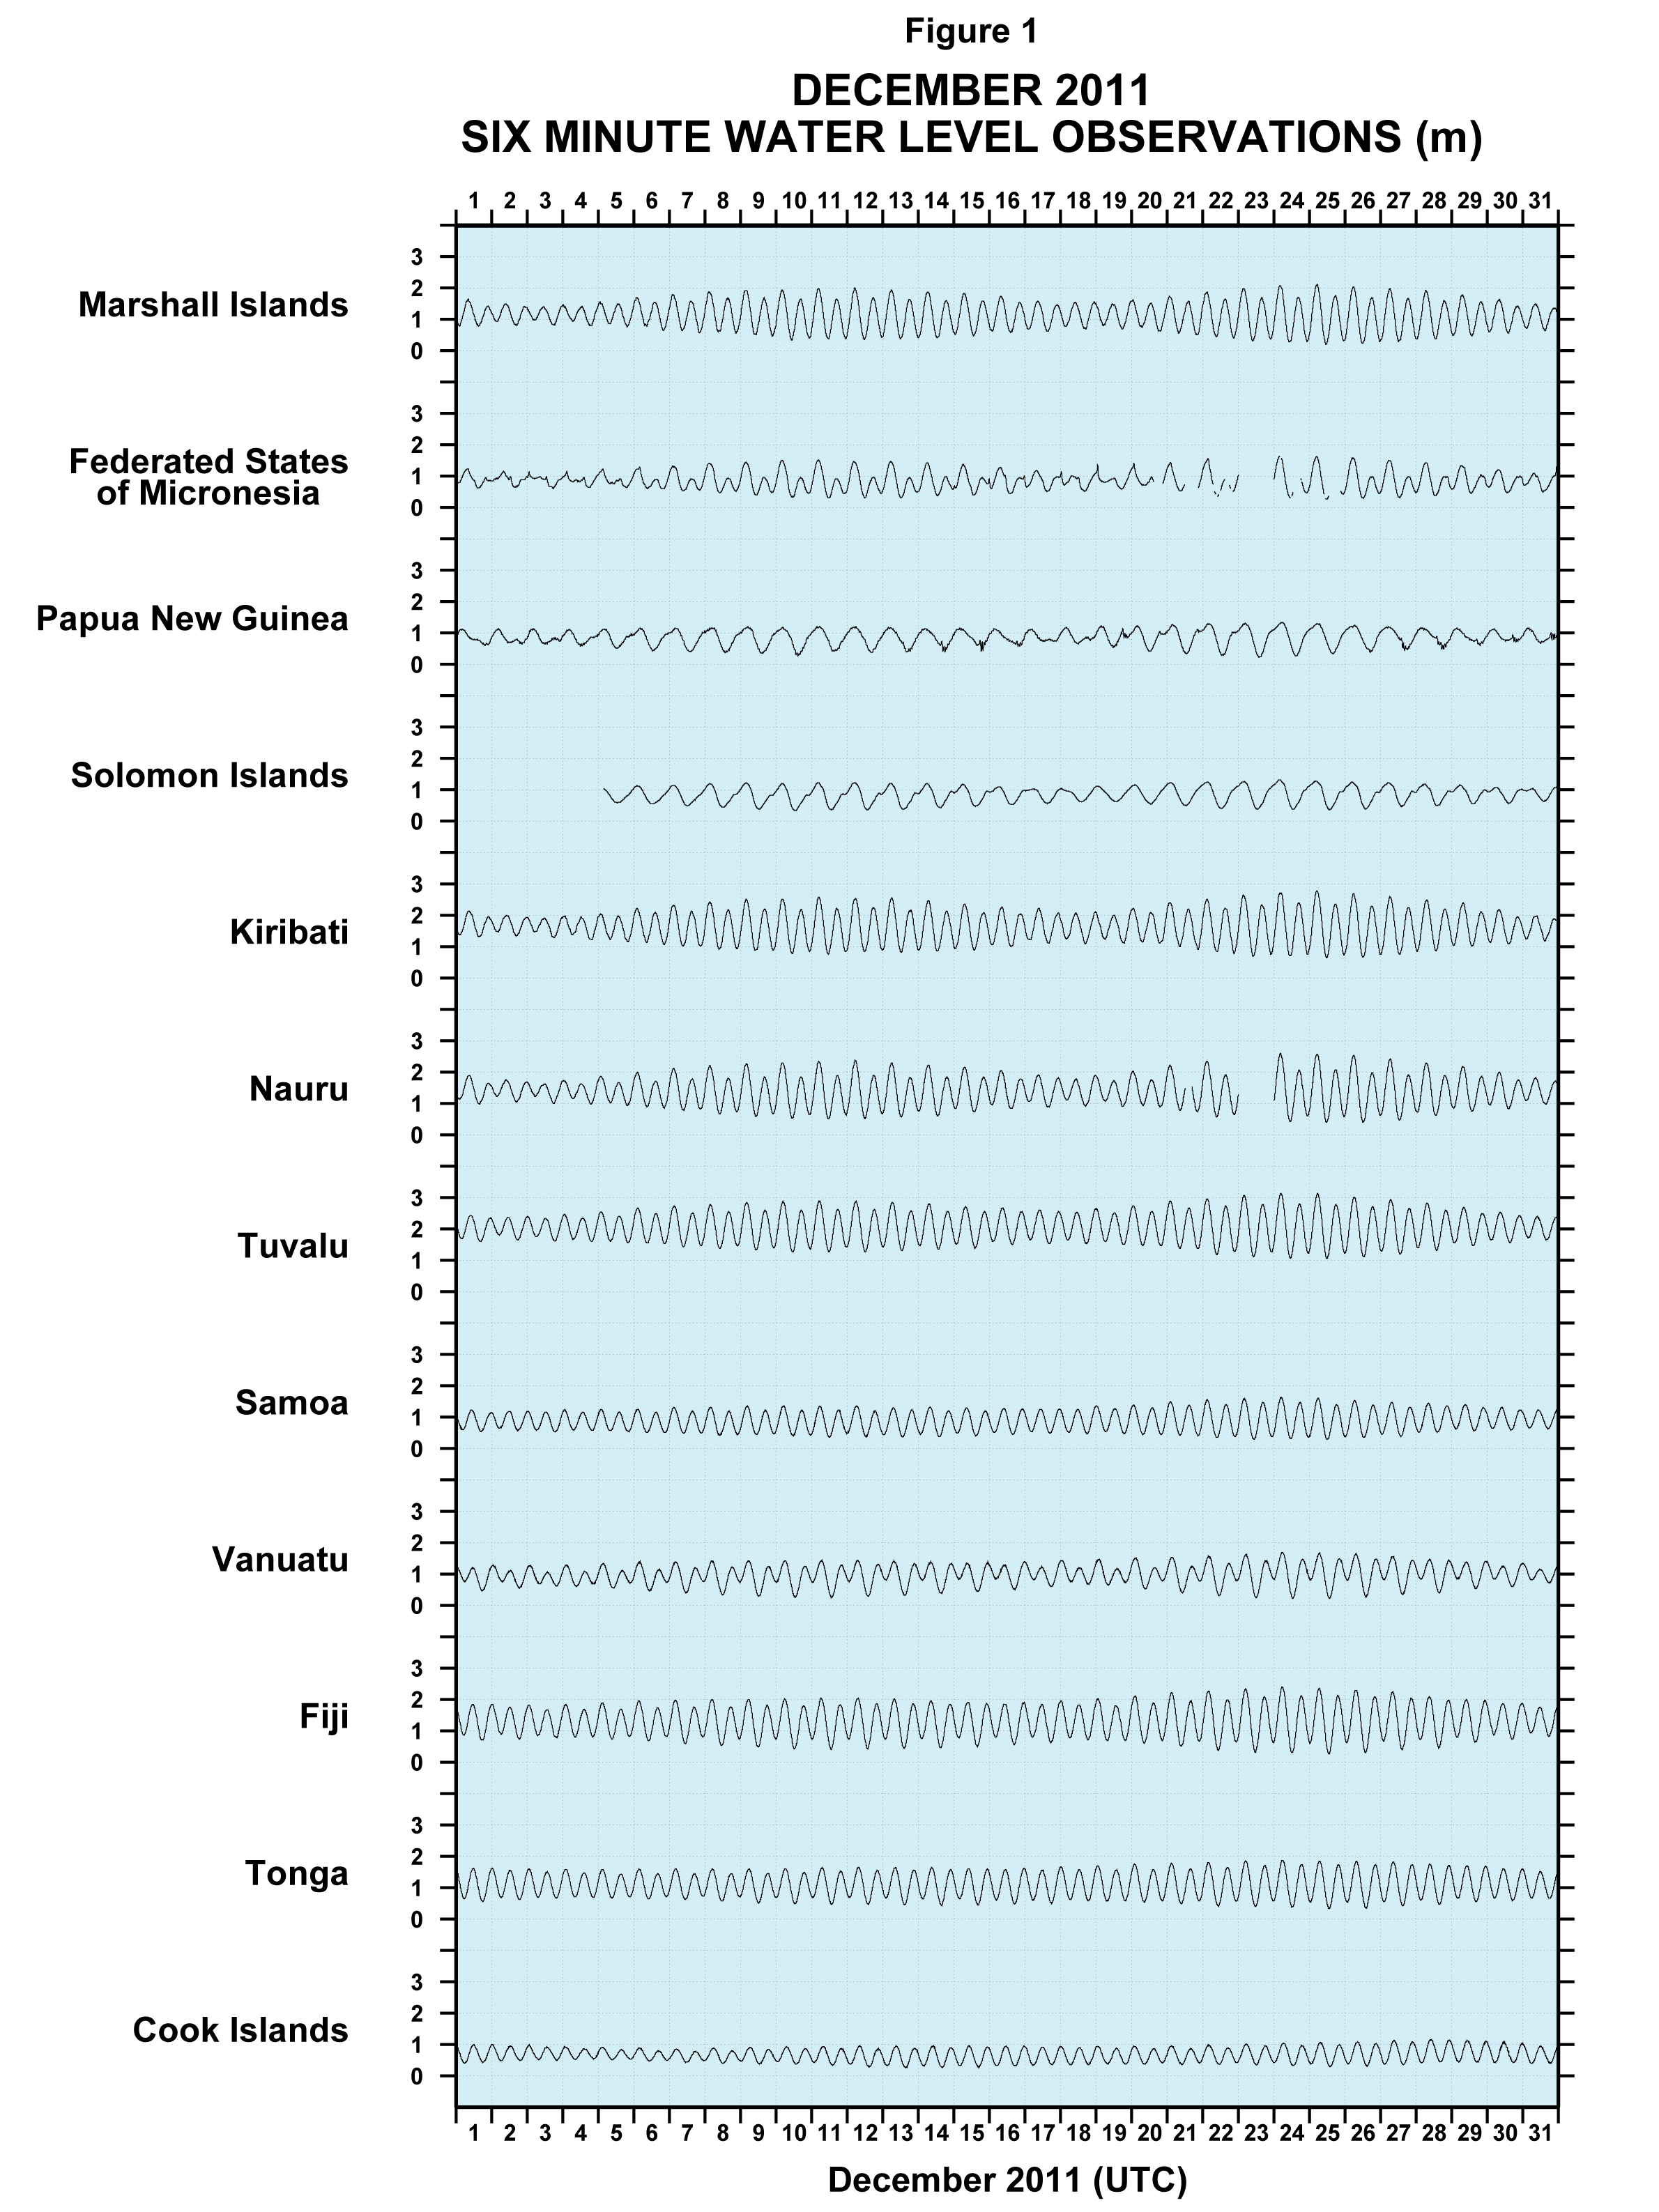
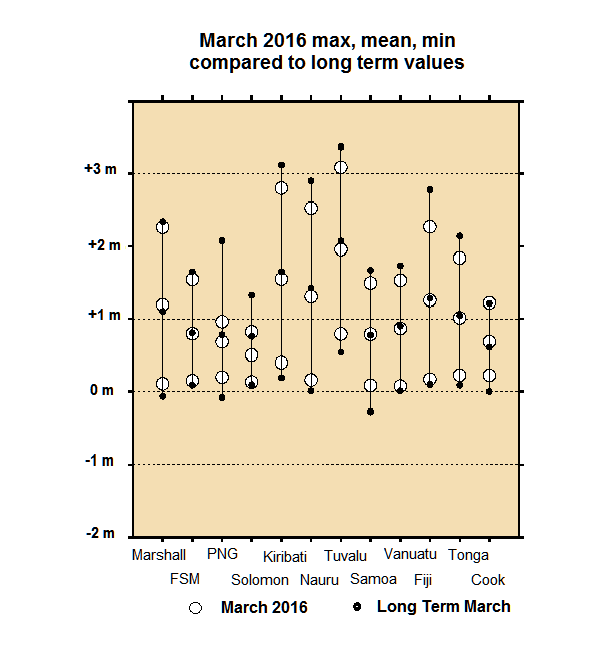
Monthly reports are detailed and informative. At each station water levels are measured every six minutes in order to calculate daily maxs, mins and means, as a basis for monthly averages. So the daily mean sea level value is averaged from 240 readings, and the daily min and max are single readings taken from the 240.
A typical monthly graph appears above. It shows how tides for these stations range between 1 to 3 meters daily, as well variations during the month.
According to the calibrations, measurement errors are in the range of +/- 1 mm. Vertical movement of the land is monitored relative to a GPS benchmark. So far, land movement at these stations has also been within the +/- 1 mm range (with one exception related to an earthquake).
The PSLM Record
In the Monthly reports are graphs showing results of six minute observations, indicating tidal movements daily over the course of a month.The chart above shows how sea level varied in each location during March 2016 compared to long term March results. Since many stations were installed in 1993, long term means about 22 years of history.
This dataset for Pacific Sea Level Monitoring provides a realistic context for interpreting studies claiming sea level trends and/or acceleration of such trends. Of course, one can draw a line through any scatter of datapoints and assert the existence of a trend. And the error ranges above allow for annual changes of a few mm to be meaningful. Here is a table produced in just that way.
Location
Installation date
Sea-level trend (mm/yr)
Cook Islands
Feb 2003
+5.5
Federated States of Micronesia
Dec 2001
+17.7
Fiji
Oct 1992
+2.9
Kiribati
Dec 1992
+2.9
Marshall Islands
May 1993
+5.2
Nauru
Jul 1993
+3.6
Papua New Guinea
Sept 1994
+8.0
Samoa
Feb 1993
+6.9
Solomon Islands
Jul 1994
+7.7
Tonga
Jan 1993
+8.6
Tuvalu
Mar 1993
+4.1
Vanuatu
Jan 1993
+5.3
The rising trends range from 2.9 to 8.6 mm/year (FSM is too short to be meaningful).
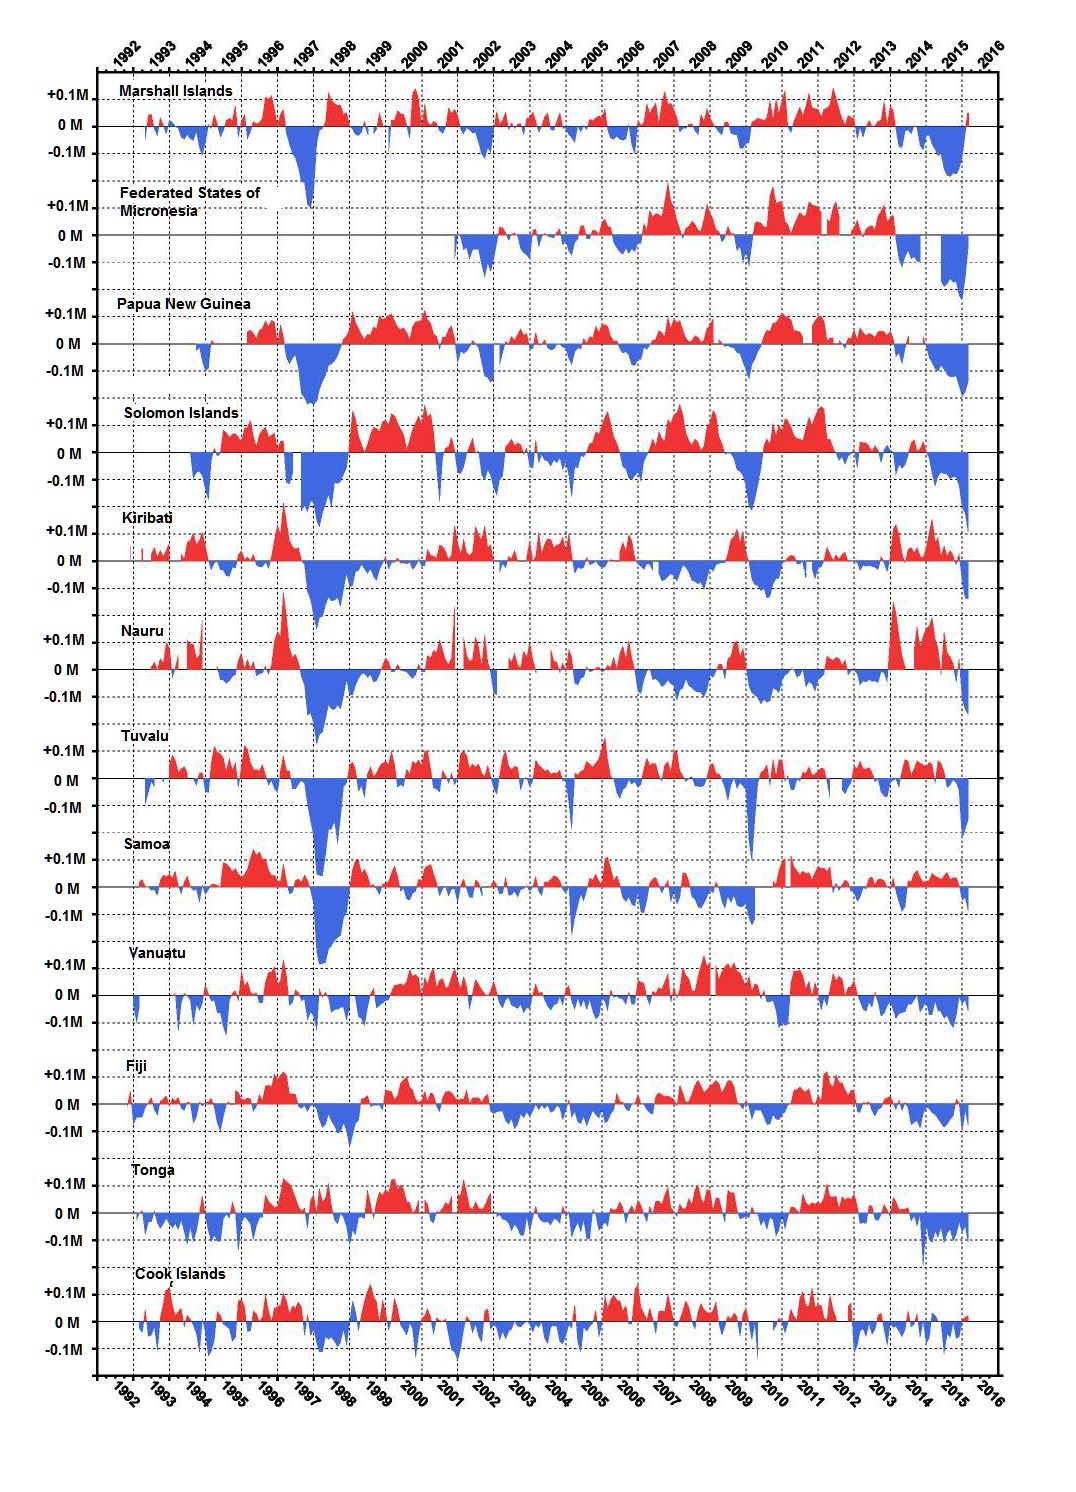
Looking into the details of the monthly anomalies, it is clear that sea level changes at the mm level are swamped by volatility of movements greater by orders of magnitude. And there are obvious effects from ENSO events. The 1997-98 El Nino shows up in a dramatic fall of sea levels almost everywhere, and that event alone creates most of the rising trends in the table above. The 2014-2016 El Nino is also causing sea levels to fall, but is too recent to affect the long term trend.
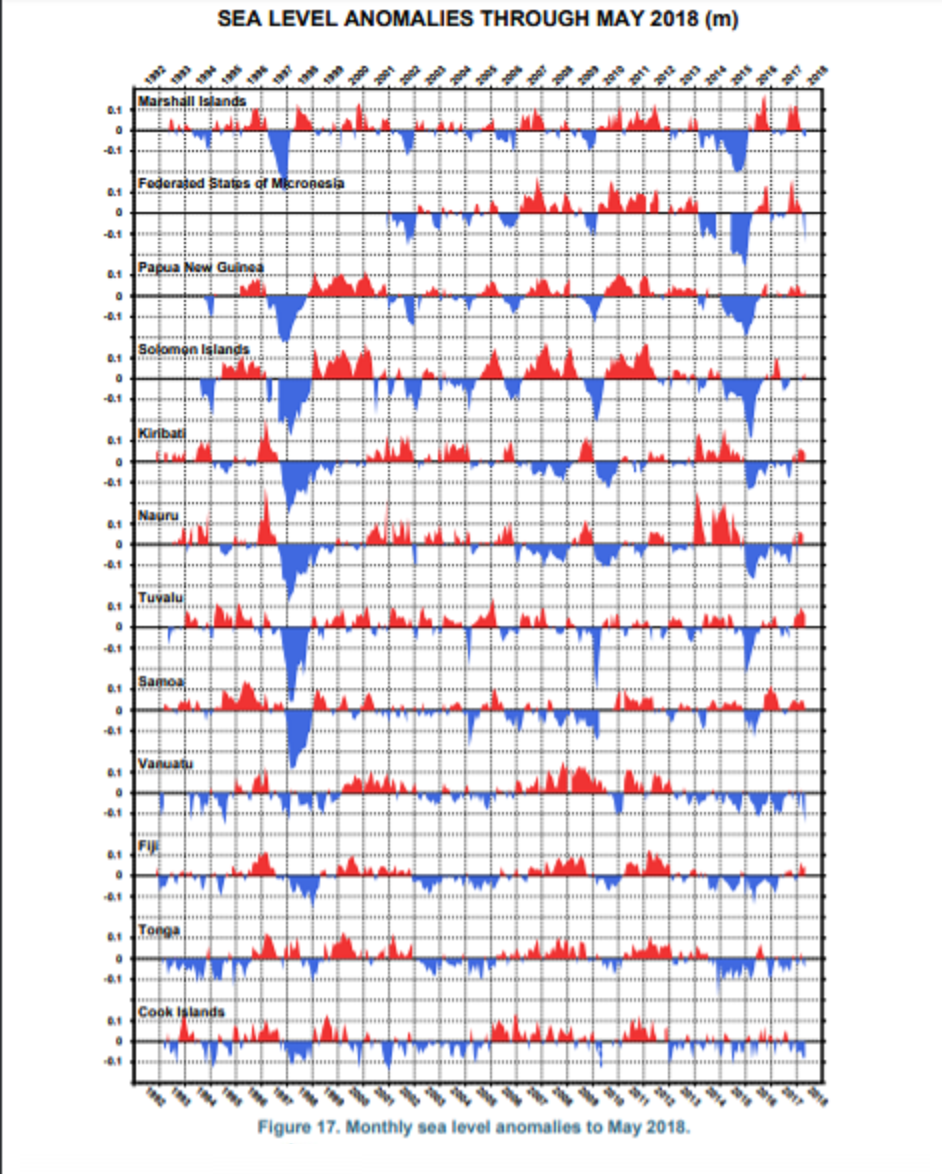
Update July 9, 2018
Here are the sea level records updated to May 2018.
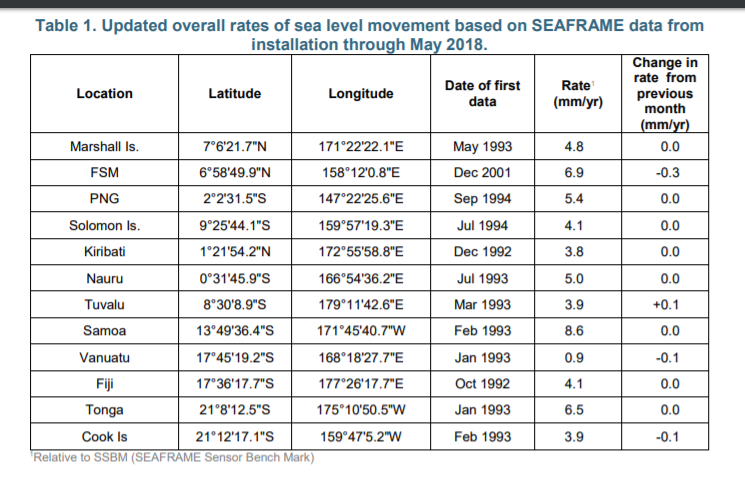
The records are dominated by two Major El Nino events in 1997-8 and 2015-6. When Westerly winds pick up, warm surface water is pushed from western (Asian) Pacific toward eastern (American) Pacific. Thus sea levels decline temporarily during those periods, as seen in the blue deficits in the charts above. Below the updated sea level trends. Summary
Sea Level Rise is another metric for climate change that demonstrates the difficulty discerning a small change of a few millimeters in a dataset where tides vary thousands of millimeters every day. And the record is also subject to irregular fluctuations from storms, currents and oceanic oscillations, such as the ENSO.
On page 8 of its monthly reports (here), PSLM project provides this caution regarding the measurements:
The overall rates of movement are updated every month by calculating the linear slope during the tidal analysis of all the data available at individual stations. The rates are relative to the SEAFRAME sensor benchmark, whose movement relative to inland benchmarks is monitored by Geosciences Australia. Please exercise caution in interpreting the overall rates of movement of sea level – the records are too short to be inferring long-term trends.
A longer record will bring more insight, but even then sea level trends are a very weak signal inside a noisy dataset. Even with state-of-the-art equipment, it is a fool’s errand to discern any acceleration in sea levels, in order to link it to CO2. Such changes are in fractions of millimeters when the measurement error is +/- 1 mm.
For more on the worldwide network of tidal gauges, as well as satellite systems attempting to measure sea level, sea Dave Burton’s excellent website.
May 10 update Regarding recent news about Solomon Islands.
As the charts above show, there is negligible sea level rise in the West Pacific, and receding a bit lately at Solomon Islands. So it was curious that the media was declaring those islands inundating because of climate change.
Now the real story is coming out (but don’t wait for the retractions)
A new study published in Environmental Research Letters shows that some low-lying reef islands in the Solomon Islands are being gobbled up by “extreme events, seawalls and inappropriate development, rather than sea level rise alone.” Despite headlines claiming that man-made climate change has caused five Islands (out of nearly a thousand) to disappear from rising sea levels, a closer inspection of the study reveals the true cause is natural, and the report’s lead author says many of the headlines have been ‘exaggerated’ to ill-effect.
Be not Confused. USCS is not the US Coastal Service, but rather stands for the Union of Super Concerned Scientists, or UCS for short. Using their considerable PR skills and budgets, they have plastered warnings in the media targeting major coastal cities, designed to strike terror in anyone holding real estate in those places. Example headlines include:
Sea level rise could put thousands of homes in this SC county at risk, study says The State, South Carolina
Taxpayers in the Hamptons among the most exposed to rising seas Crain’s New York Business
Adapting to Climate Change Will Take More Than Just Seawalls and Levees Scientific American
The Biggest Threat Facing the City of Miami Smithsonian Magazine
What Does Maryland’s Gubernatorial Race Mean For Flood Management?The Real News Network
Study: Thousands of Palm Beach County homes impacted by sea-level rise WPTV, Florida
Sinking Land and Climate Change Are Worsening Tidal Floods on the Texas Coast Texas Observer
Sea Level Rise Will Threaten Thousands of California HomesScientific American
300,000 coastal homes in US, worth $120 billion, at risk of chronic floods from rising seas USA Today
Sea levels are rising. Tides are inching higher. High-tide floods are becoming more frequent and reaching farther inland. And hundreds of US coastal communities will soon face chronic, disruptive flooding that directly affects people’s homes, lives, and properties.
Yet property values in most coastal real estate markets do not currently reflect this risk. And most homeowners, communities, and investors are not aware of the financial losses they may soon face.
This analysis looks at what’s at risk for US coastal real estate from sea level rise—and the challenges and choices we face now and in the decades to come.
The report and supporting documents give detailed dire warnings state by state, and even down to counties and townships. As example of the damage projections is this table estimating 2030 impacts:
State
Homes at Risk
Value at Risk
Property Tax at Risk
Population in at-risk homes
AL
3,542
$1,230,676,217
$5,918,124
4,367
CA
13,554
$10,312,366,952
$128,270,417
33,430
CT
2,540
$1,921,428,017
$29,273,072
5,690
DC
–
$0
$0
–
DE
2,539
$127,620,700
$2,180,222
3,328
FL
20,999
$7,861,230,791
$101,267,251
32,341
GA
4,028
$1,379,638,946
$13,736,791
7,563
LA
26,336
$2,528,283,022
$20,251,201
63,773
MA
3,303
$2,018,914,670
$17,887,931
6,500
MD
8,381
$1,965,882,200
$16,808,488
13,808
ME
788
$330,580,830
$3,933,806
1,047
MS
918
$100,859,844
$1,392,059
1,932
NC
6,376
$1,449,186,258
$9,531,481
10,234
NH
1,034
$376,087,216
$5,129,494
1,659
NJ
26,651
$10,440,814,375
$162,755,196
35,773
NY
6,175
$3,646,706,494
$74,353,809
16,881
OR
677
$110,461,140
$990,850
1,277
PA
138
$18,199,572
$204,111
310
RI
419
$299,462,350
$3,842,996
793
SC
5,779
$2,882,357,415
$22,921,550
8,715
TX
5,505
$1,172,865,533
$19,453,940
9,802
VA
3,849
$838,437,710
$8,296,637
6,086
WA
3,691
$1,392,047,121
$13,440,420
7,320
The methodology, of course is climate models all the way down. They explain:
Three sea level rise scenarios, developed by the National Oceanic and Atmospheric Administration (NOAA) and localized for this analysis, are included:
A high scenario that assumes a continued rise in global carbon emissions and an increasing loss of land ice; global average sea level is projected to rise about 2 feet by 2045 and about 6.5 feet by 2100.
An intermediate scenario that assumes global carbon emissions rise through the middle of the century then begin to decline, and ice sheets melt at rates in line with historical observations; global average sea level is projected to rise about 1 foot by 2035 and about 4 feet by 2100.
A low scenario that assumes nations successfully limit global warming to less than 2 degrees Celsius (the goal set by the Paris Climate Agreement) and ice loss is limited; global average sea level is projected to rise about 1.6 feet by 2100.
Oh, and they did not forget the disclaimer:
Disclaimer This research is intended to help individuals and communities appreciate when sea level rise may place existing coastal properties (aggregated by community) at risk of tidal flooding. It captures the current value and tax base contribution of those properties (also aggregated by community) and is not intended to project changes in those values, nor in the value of any specific property.
The projections herein are made to the best of our scientific knowledge and comport with our scientific and peer review standards. They are limited by a range of factors, including but not limited to the quality of property-level data, the resolution of coastal elevation models, the potential installment of defensive measures not captured by those models, and uncertainty around the future pace of sea level rise. More information on caveats and limitations can be found at http://www.ucsusa.org/underwater.
Neither the authors nor the Union of Concerned Scientists are responsible or liable for financial or reputational implications or damages to homeowners, insurers, investors, mortgage holders, municipalities, or other any entities. The content of this analysis should not be relied on to make business, real estate or other real world decisions without independent consultation with professional experts with relevant experience. The views expressed by individuals in the quoted text of this report do not represent an endorsement of the analysis or its results.
The need for a disclaimer becomes evident when looking into the details. The NOAA reference is GLOBAL AND REGIONAL SEA LEVEL RISE SCENARIOS FOR THE UNITED STATES NOAA Technical Report NOS CO-OPS 083
Since the text emphasizes four examples of their scenarios, let’s consider them here. First there is San Francisco, a city currently suing oil companies over sea level rise. From tidesandcurrents comes this tidal gauge record It’s a solid, long-term record providing a century of measurements from 1900 through 2017. The graph below compares the present observed trend with climate models projections out to 2100.
Since the record is set at zero in 2000, the difference in 21st century expectation is stark. Instead of the existing trend out to around 20 cm, models project 2.5 meters rise by 2100.
New York City is represented by the Battery tidal gauge: Again, a respectable record with a good 20th century coverage. And the models say: The red line projects 2500 mm rise vs. 284 mm, almost a factor of 10 more. The divergence is evident even in the first 17 years.
Florida comes in for a lot of attention, especially the keys, so here is Key West: A similar pattern to NYC Battery gauge, and here is the projection: The pattern is established: Instead of a rise of about 30 cm, the models project 250 cm.
Finally, probably the worst case, and well-known to all already is Galveston, Texas: The water has been rising there for a long time, so maybe the models got this one close. The gap is less than the others since the rising trend is much higher, but the projection is still four times the past. Galveston is at risk, all right, but we didn’t need this analysis to tell us that.
A previous post Unbelievable Climate Models goes into why they are running so hot and so extreme, and why they can not be trusted.
July 16, 2018 Footnote:
Recently there was a flap over future sea levels at Rhode Island, so I took a look at Newport RI, the best tidal gauge record there. Same Story:


 Previous Post Updated with 2020 Statistics
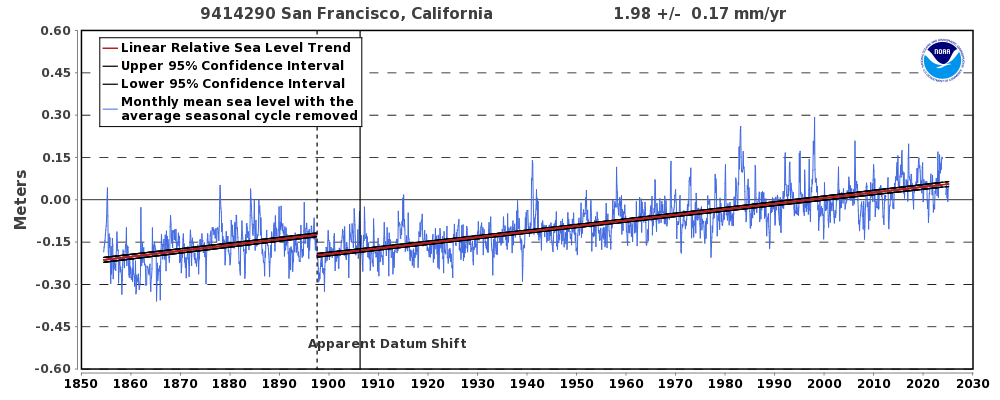 It’s a solid, long-term record providing more than a century of measurements from 1900 through 2020. The graph below compares the present observed trend with climate models projections out to 2100.


:format(webp)/cdn.vox-cdn.com/uploads/chorus_image/image/58274155/Screen_Shot_2018_01_10_at_10.17.06_AM.0.png)
 Context