The animation focuses on the two Pacific basins since most of the ice action is seen there. The seesaw refers to a frequent observation that Bering and Okhotsk Seas often alternate growing and receding ice extents during both melting and freezing seasons. This month Bering on the right is seen adding ice steadily from 387k km2 to 664k km2, now at 104% of its last March maximum. Meanwhile Okhotsk on the left starts at 466k km2, waffles back and forth, growing to 554k km2 before retreating to match the beginning.
The graph below shows daily ice extents for January 2022 compared to 16 year averages, and some years of note.
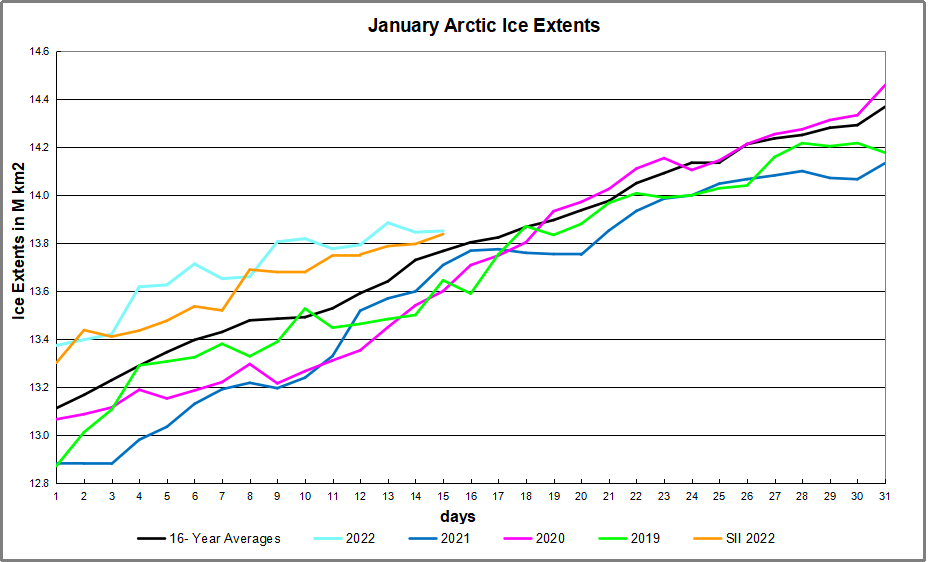
The black line shows during January on average (2006 to 2021 inc.) Arctic ice extents increased ~1.3M km2 from ~13.1M km2 up to ~13.4M km2. The 2022 cyan MASIE line started the year 261k km2 above average and on day 15 retained a surplus of 84k km2. The Sea Ice Index in orange (SII from NOAA) started with the same deficit, then lagged behind in the first two weeks, before ending yesterday the same as MASIE. 2021 and 2020 started below average but made up most of the difference by mid month.
Why is this important? All the claims of global climate emergency depend on dangerously higher temperatures, lower sea ice, and rising sea levels. The lack of additional warming is documented in a post UAH Confirms Global Warming Gone End of 2021.
The lack of acceleration in sea levels along coastlines has been discussed also. See Inside the Sea Level Scare Machine
Also, a longer term perspective is informative:
 The table below shows the distribution of Sea Ice on day 015 across the Arctic Regions, on average, this year and 2021.
| Region | 2022015 | Day 15 Average | 2022-Ave. | 2021015 | 2022-2021 |
| (0) Northern_Hemisphere | 13851226 | 13767662 | 83564 | 13709295 | 141931 |
| (1) Beaufort_Sea | 1070776 | 1070247 | 529 | 1070689 | 87 |
| (2) Chukchi_Sea | 966006 | 965889 | 117 | 966006 | 0 |
| (3) East_Siberian_Sea | 1087137 | 1087131 | 6 | 1087120 | 17 |
| (4) Laptev_Sea | 897827 | 897837 | -10 | 897827 | 0 |
| (5) Kara_Sea | 935023 | 908782 | 26242 | 860326 | 74697 |
| (6) Barents_Sea | 710507 | 509307 | 201200 | 479880 | 230628 |
| (7) Greenland_Sea | 584670 | 600334 | -15664 | 649983 | -65313 |
| (8) Baffin_Bay_Gulf_of_St._Lawrence | 1084523 | 1158194 | -73671 | 1060873 | 23650 |
| (9) Canadian_Archipelago | 854685 | 853209 | 1476 | 854597 | 88 |
| (10) Hudson_Bay | 1260903 | 1254880 | 6024 | 1260471 | 432 |
| (11) Central_Arctic | 3199791 | 3209964 | -10173 | 3183652 | 16140 |
| (12) Bering_Sea | 664148 | 535155 | 128993 | 503676 | 160473 |
| (13) Baltic_Sea | 44692 | 42101 | 2591 | 31534 | 13157 |
| (14) Sea_of_Okhotsk | 466605 | 629910 | -163305 | 765767 | -299162 |
The overall surplus to average is 84k km2, (0.6%). Note large surpluses of ice in Barents and Bering Seas. The main deficit to average is in Sea of Okhotsk, as noted at the top.


Illustration by Eleanor Lutz shows Earth’s seasonal climate changes. If played in full screen, the four corners present views from top, bottom and sides. It is a visual representation of scientific datasets measuring Arctic ice extents.

Reblogged this on Climate Collections.
LikeLike