
The annual competition between ice and water in the Arctic ocean has reached the maximum for water, which typically occurs mid September. After that, diminishing energy from the slowly setting sun allows oceanic cooling causing ice to regenerate. Those interested in the dynamics of Arctic sea ice can read numerous posts here. This post provides a look at mid September from 2007 to yesterday as a context for understanding this year’s annual minimum.
The image above shows Arctic ice extents on day 260 (lowest annual daily extent on average) from 2007 to 2022 yesterday. Obviously, the regions vary as locations for ice, discussed in more detail later on. The animation shows the ice deficits in years 2007, 2012, 2016 and 2020, as well as surplus years like 2010, 2014 and the last two years, 2021-2022.
Note that for climate purposes the annual minimum is measured by the September monthly average ice extent, since the daily extents vary and will go briefly lowest on or about day 260. In a typical year the overall ice extent will end September slightly higher than at the beginning. Remarkably 2022 September ice extent averaged 5.1M over the first 17 days, and is likely to end the month with at least that amount for the entire month. For comparison, the 15 year average for Sept. 1-17 is 4.7M.
The melting season mid August to mid September shows 2022 melted slower than average and ended the period above the average.
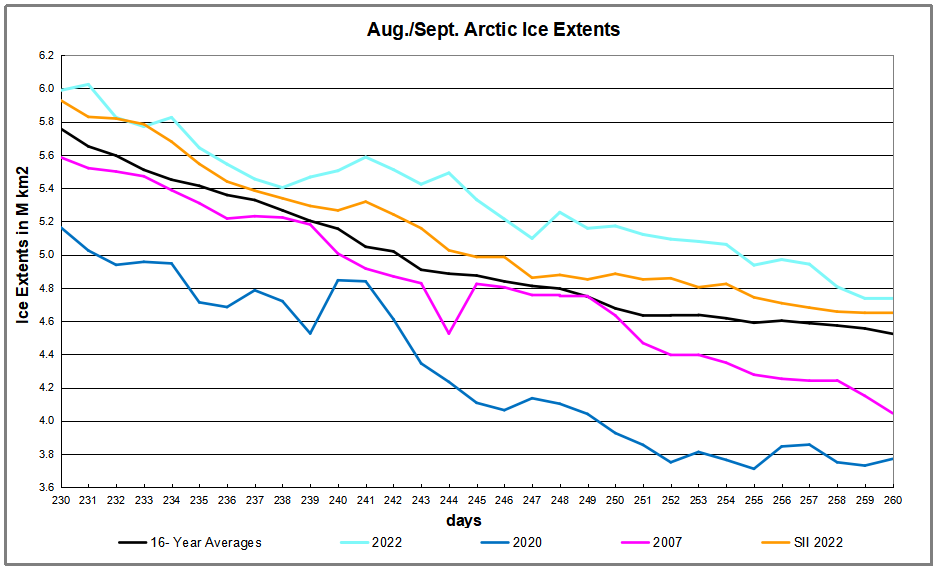
Firstly note that on average this period shows ice declining 1.24 M km2 down to 4.52M km2, the minimum average daily extent for the year. But 2022 started 230k km2 higher, and on day 244 was 606k km2 above average, before ending on day 260 with a surplus of 212k km2 The extents in Sea Ice Index in orange were mostly lower during the period. The table for day 260 shows how large are the 2022 surpluses and how the ice is distributed across the various seas comprising the Arctic Ocean. The surplus this year over 2007 is nearly 0.7 of a Wadham (1M km2 ice extent). The surplus is ~5% above average.
| Region | 2022260 | Day 260 Average | 2022-Ave. | 2007260 | 2022-2007 |
| (0) Northern_Hemisphere | 4735485 | 4523606 | 211878 | 4045776 | 689709 |
| (1) Beaufort_Sea | 551558 | 498415 | 53142 | 481384 | 70174 |
| (2) Chukchi_Sea | 135794 | 171467 | -35673 | 22527 | 113267 |
| (3) East_Siberian_Sea | 305100 | 263291 | 41809 | 311 | 304789 |
| (4) Laptev_Sea | 182035 | 119373 | 62662 | 235869 | -53834 |
| (5) Kara_Sea | 20413 | 31966 | -11553 | 44067 | -23654 |
| (6) Barents_Sea | 326 | 16326 | -15999 | 7420 | -7094 |
| (7) Greenland_Sea | 249159 | 184219 | 64940 | 333181 | -84022 |
| (8) Baffin_Bay_Gulf_of_St._Lawrence | 24537 | 29138 | -4601 | 26703 | -2165 |
| (9) Canadian_Archipelago | 185541 | 285070 | -99529 | 225526 | -39984 |
| (10) Hudson_Bay | 0 | 5149 | -5149 | 2270 | -2270 |
| (11) Central_Arctic | 3080350 | 2918177 | 162173 | 2665244 | 415107 |
The main deficit to average is in CAA with a smaller loss in Chukchi, overcome by surpluses almost everywhere, especially in Central Arctic along with Laptev and Greenland seas. And as discussed below, the marginal basins have little ice left to lose.
The Bigger Picture
We are close to the annual Arctic ice extent minimum, which typically occurs on or about day 260 (mid September). Some take any year’s slightly lower minimum as proof that Arctic ice is dying, but the image above shows the Arctic heart is beating clear and strong.
Over this decade, the Arctic ice minimum has not declined, but since 2007 looks like fluctuations around a plateau. By mid-September, all the peripheral seas have turned to water, and the residual ice shows up in a few places. The table below indicates where we can expect to find ice this September. Numbers are area units of Mkm2 (millions of square kilometers).
| Day 260 | 15 year | |||||||||
| Arctic Regions | 2007 | 2010 | 2012 | 2014 | 2017 | 2019 | 2020 | 2021 | Average | 2022 |
| Central Arctic Sea | 2.67 | 3.16 | 2.64 | 2.98 | 3.07 | 2.97 | 2.50 | 2.95 | 2.90 | 3.08 |
| BCE | 0.50 | 1.08 | 0.31 | 1.38 | 0.84 | 0.46 | 0.65 | 1.55 | 0.89 | 0.99 |
| LKB | 0.29 | 0.24 | 0.02 | 0.19 | 0.26 | 0.11 | 0.01 | 0.13 | 0.16 | 0.20 |
| Greenland & CAA | 0.56 | 0.41 | 0.41 | 0.55 | 0.52 | 0.36 | 0.59 | 0.50 | 0.46 | 0.43 |
| B&H Bays | 0.03 | 0.03 | 0.02 | 0.02 | 0.07 | 0.01 | 0.02 | 0.04 | 0.04 | 0.02 |
| NH Total | 4.05 | 4.91 | 3.40 | 5.13 | 4.76 | 3.91 | 3.77 | 5.17 | 4.48 | 4.73 |
The table includes some early years of note along with the last 4 years compared to the 15 year average for five contiguous arctic regions. BCE (Beaufort, Chukchi and East Siberian) on the Asian side are quite variable as the largest source of ice other than the Central Arctic itself. Greenland Sea and CAA (Canadian Arctic Archipelago) together hold almost 0.5M km2 of ice at annual minimum, fairly consistently. LKB are the European seas of Laptev, Kara and Barents, a smaller source of ice, but a difference maker some years, as Laptev was in 2016. Baffin and Hudson Bays are inconsequential as of day 260.
2022 extent of 4.73 is 5% over average, mainly due to surpluses in Central Arctic and BCE

For context, note that the average maximum has been 15M, so on average the extent shrinks to 30% of the March high (31% in 2022) before growing back the following winter. In this context, it is foolhardy to project any summer minimum forward to proclaim the end of Arctic ice.
Resources: Climate Compilation II Arctic Sea Ice


Reblogged this on Climate Collections.
LikeLike
Reblogged this on Climatism and commented:
“In this context, it is foolhardy to project any summer minimum forward to proclaim the end of Arctic ice.”
LikeLike
I’ve been a sailor, but never in Arctic latitudes. I am interested is the odd years when the NW Passage is navigable, by a small yacht, under diesel power. It doesn’t appear so for 2022? Anyone knows what the current state of the passage is?
LikeLike
William, the relevant ice charts are from Canada ice service. For example, this is the choke point

The lower mostly white part is the NW passage. Beaufort on the left is open, but the red and pink is ice in the vertical part of the crossing on the right side.
The latest text report is here:
https://ice-glaces.ec.gc.ca/prods/FECN14CWIS/20220915000000_FECN14CWIS_0012270859.txt
Actually, the old ice looks forbidding:
LikeLike
Reblogged this on Tallbloke's Talkshop and commented:
But alarmists still insist the poles are warming several times faster than the global average. Data says no.
LikeLike