Everywhere I go, people are mystified about President Joe Biden’s economic agenda. So few of the policies comport with basic common sense that I’m asked the same question over and over: Is Biden intentionally trying to take a wrecking ball to the economy?
Is this all part of some diabolical plan, the “great reset,” to end our system of free market capitalism and replace it with some form of big-government socialism?
Biden keeps saying that he wants to be an historic president who will “transition” the country into a new worker’s paradise where no one uses fossil fuels or electricity or cars and equality is paramount, ahead of growth and prosperity. Is he taking us there with no regard for the collateral damage to America?
My belief is that, no, I don’t think this is an intentional, nefarious Dr. Evil-type plot.
But if this were a scheme to burn down the village in order to rebuild it,
Biden and his administration are doing a great job of it.
Here are seven Biden administration steps to undermine an economy and a society from within. They will all sound familiar with the president’s policies since he took office 21 months ago.
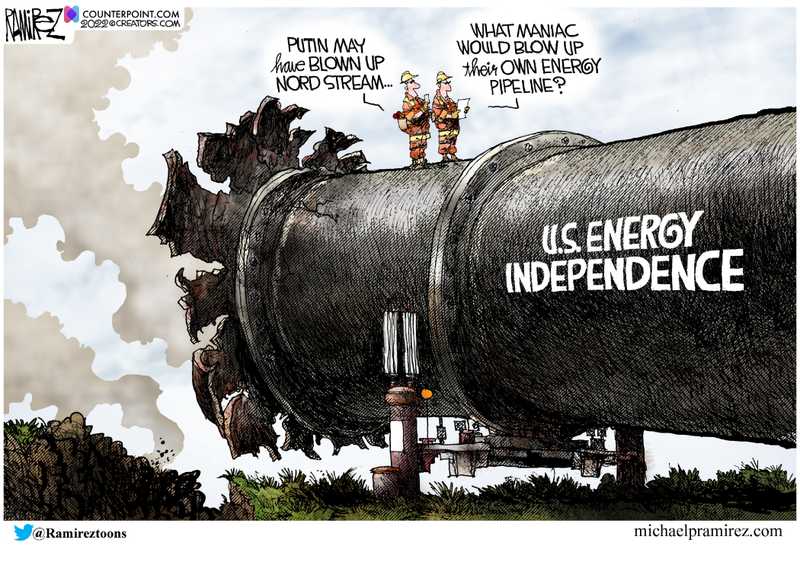
1. Dismantle the nation’s energy supply. We get 70% of our energy from fossil fuels. Biden has declared war on American oil and gas, making us more dependent on our enemies for our basic energy needs.
2. Don’t enforce the border. Biden is letting hundreds of thousands of potential criminals, terrorists, welfare recipients, and enemies of the United States into our country through a porous southern border with Mexico. Immigration is good, but it must be orderly and regulated.
3. Devalue the nation’s currency through inflation. Inflation is up nearly 15% since Biden came into office. Inflation is a means to erode the value of a currency.
4. Destroy the nation’s finances by running up the debt by multiple trillions of dollars of debt. No president in modern times has so recklessly pushed our nation into debt as rapidly as Biden through his $4 trillion in spending paid for with red ink.
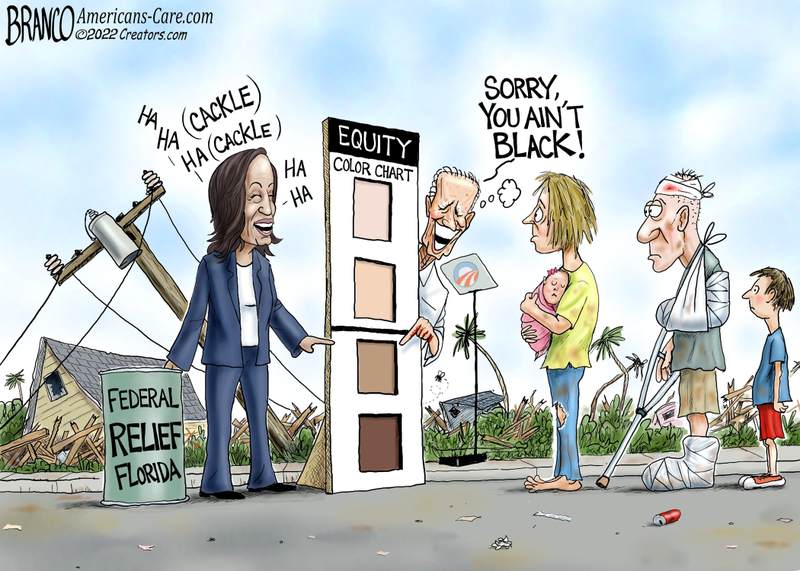
5. Divide rather than unite the nation. Rich versus poor, black versus white, gay versus straight, rural versus urban. Biden promised unity. Instead, he pits groups against each other. This is the identity politics of the Left that is the opposite of “e pluribus unum.”
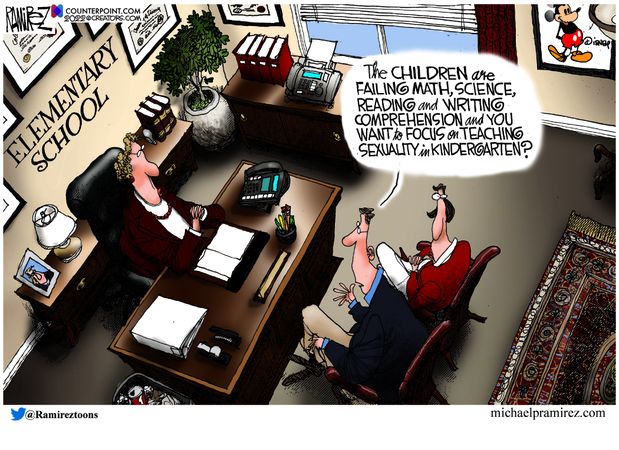
6. Dumb down and indoctrinate our children with anti-American propaganda in the schools and media. And allowing teacher unions and left-wing activists to take over the curriculum with anti-American propaganda. It is the opposite of nurturing patriotism and love of country.
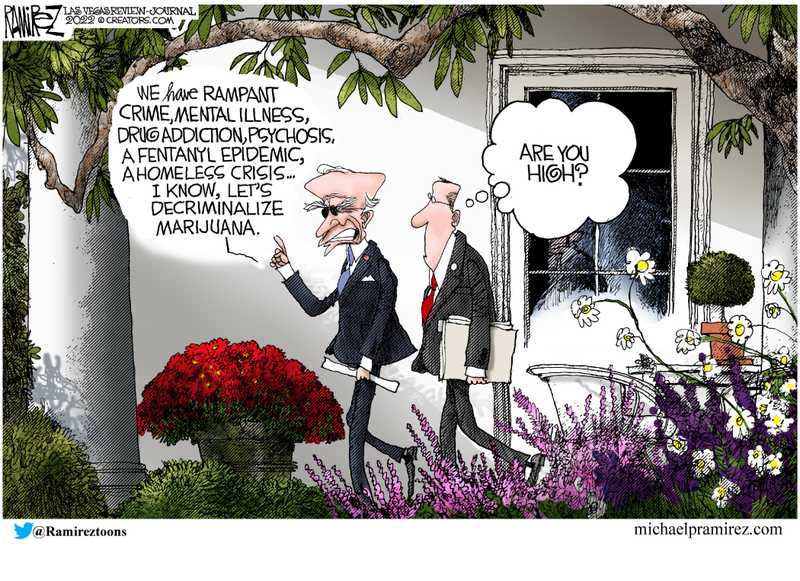
7. Decriminalize a lot. Let criminals onto the streets. End bail. Empty the prisons. Let minor crimes go unpunished. Biden’s policies favor criminals over victims. It’s a scene out of a Batman movie.
Are these policies intentional or simply completely misguided? I don’t know. But does it matter? Either way, our country is in grave peril.
Tom Nelson posted this interview with Ross McKitrick on Big problems with paleoclimate data and land temperature records. H/T Climate-Science.press.
Ross McKitrick is a Professor of Economics at the University of Guelph where he specializes in environment, energy and climate policy. He has published widely on the economics of pollution, climate change and public policy. His book Economic Analysis of Environmental Policy was published by the University of Toronto Press in 2010.
His background in applied statistics has also led him to collaborative work across a wide range of topics in the physical sciences including paleoclimate reconstruction, malaria transmission, surface temperature measurement and climate model evaluation.
Professor McKitrick has made many invited academic presentations around the world and has testified before the US Congress and committees of the Canadian House of Commons and Senate.
The discussion is wide-ranging, and I provide below a lightly edited transcript on the main theme, starting around minute 41. Text is in italics with my bolds and added images. TN refers to Tom Nelson’s comments and RM to Ross McKitrick.
Transcript
RM: People need to understand that for the 20th century as a whole there’s temperature data for less than 50 percent of the Earth’s surface. And a lot of stuff is just being filled in with with assumptions or or modeling work, so it’s really the output of models. And so as you go back in time back to the 1920s for instance, here in Southern Ontario we have great temperature records back to the 1920s. Here in Guelph we have temperature data that goes back to the late 1800s.
One of the first assignments I have my students do in my environmental economics courses is just to take a few locations in Ontario that have more than 100 Years of temperature data and plot the records for average daily highs back 100 years or more. That always surprises them because they just don’t see what they’re expecting to see in terms of an upward trend. There’s a visible trend up to the 1930s or so. And then after that it’s kind of up and down flat.
Summertime temperatures especially, have gone down, they’ve gone up,
but haven’t really changed much since the 1930s.
We happen to be in a part of the world where we’ve got those kinds of long temperature records. For the vast majority of the world there’s just no data at all, or there are short temperature records or fragments of temperature records over various intervals. Yet what we see are these temperature graphs going back to the 1860s that they call the observational record. There’s so many problems with those records, and unfortunately a lot of the problems are of the form that introduces an upward bias in the trend. And it’s very difficult to measure it and remove it, though I did some work on that I hope eventually to go and do some more.
TN I wish more people took an interest in that kind of topic. Have you followed the work of Tony Heller when he’s looking back at adjustments to cool the past. It seems pretty interesting.
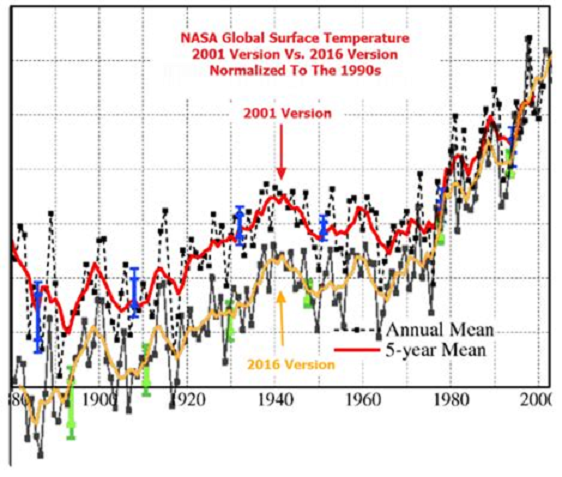
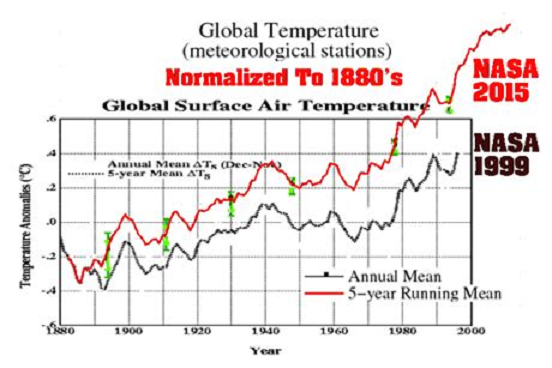
RM: Yes. I’ve seen many of his videos and now he’s focusing on the U.S record in a lot of his videos. There I think the point that he conveys is how frustrating it is for an observer. Just this notion that you’ve got the raw temperature observations and then the adjustments and they all seem to pivot around 1960.
So that anything prior to 1960, the Adjustment goes down,
and anything after 1960 the Adjustment goes up.
They create this picture that somehow in 1960 everyone in the US knew how to measure temperature perfectly. So that’s the year we’re going to leave as it is, and prior to that everybody made the same mistake. Everybody was always overestimating temperature so we’ve got to adjust those records downward. Then ever since 1960 people haven’t known how to measure temperature so we have to raise those those measurements. The pattern of adjustment is so consistent in so many places in the U.S records that at a certain point it’s just on its face implausible that these adjustments are based on some objective algorithm.
I know the people who make the adjustments will say: Well we’ve got to deal with time of observation bias you know. But if these were the sort of standard measurement errors, you would expect a mix of positive and negative mistakes. Instead, there’s such a pattern to it. The adjustments account for all the warming.
When you look at the post-1960 U.S record the adjustments are as large as the warming itself.
Remember that the warming trend is such an important input into thinking about the policy. We really need to have absolute confidence in these adjustment processes, but the people who make the adjustments do not respond in a constructive and forthright fashion to these kinds of criticisms. In my experience, they instead take such offense that anyone would question what they’re doing. And they respond with abuse and indignation when perfectly reasonable questions are put to them.
That’s another thing that makes it frustrating to an outside observer looking at these these adjusted data sets. So Tony does a very effective job in letting people see: Okay, this is a graph you’re shown. This is what the data looked like when they first collected it, and this is what the observers wrote down. And then this is what it looks like after the adjustment process. Obviously, this whole warming Trend in the U.S record is coming through the adjustments. So we have a right to a very detailed and skeptical review of these adjustments. The the lack of constructive engagement on a question like that ignores that at a certain point, the burden of proof here is on you guys, the record keepers. It’s not on the people who look at the data to go into every station record and prove it’s wrong.
The burden of proof here is on the people making the adjustments. For a long time they would refer back to a paper that was done in the 1980s for the Department of energy by Tom Wigley as the scientific basis of the adjustments. Eventually I got a hold of that document (because it’s hard to find). It turned out it was really just a lot of: Okay we think this record here moved around 1925, they moved the station from here to there, so we’re gonna make a little few changes here and we’ll bump this stretch of the data set up by this amount. And so it wasn’t like a a detailed scientific methodology that you could subject to some testing and validation.
It was really and for the time, it was all anyone really would have expected: Which is go through the data set and discuss the potential flaws and what the ad hock adjustments were. But for a long time that was that was it as far as documenting the adjustments. Now I think they’ve got more information out online to help people understand it. But that’s a long answer to your question. I go back to point out the adjustment really matters for the overall conclusion. And so if we’re going to accept the conclusion, we need to have absolute confidence in these adjustments.
And the people who could have over the years helped us gain that kind of confidence
haven’t done so.
They’ve done the opposite by being so resistant to any questioning of of their work, and made it so difficult for people to critique it. In my experiences, when you do get stuff into print and journals, then the IPCC misrepresents it and even makes up stuff that isn’t true. So I’m quite sympathetic if people just want to dismiss the the adjusted temperature record as being the product of a process where people put their thumb on the scale to get a certain result.
TN: What do you think, do you have any predictions on where climate science is going in the next 10 or 20 years? Just more of the same, or is it eventually going to crumble? It just seems like this can’t keep going on, that the lies are so big that it can’t keep going on but what do you think?
RM: My observations began 20 years ago. When I started, if you think of where people are in the spectrum, you’ve got someone like me (whatever the opposite of the word alarmist would be). I’m not particularly worried about climate change. I think the evidence is: It’s not a big deal. And there’ll be changes and things to adapt to, but they’re on a small scale compared to the normal course of events and things that we we adapt to in life.
And then you’ve got the alarmists who are you know, throwing cans of soup at paintings and gluing themselves to the sidewalk and and having a complete emotional meltdown. In the early days the the IPCC was sort of on the alarmist camp over against the Skeptics, in the sense that they were the ones trying to pull everybody away from a viewpoint like the one I hold. It was: No, you guys have to be worried about this. Look at these charts and see what we got to be worried about.
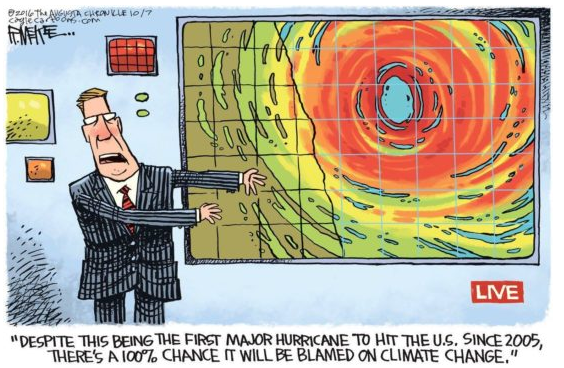
Now the alarm side has moved so far up the scale now that I think the IPCC is having to face the fact they have to begin to pull everybody back in you know my direction, our direction. So far, they’re not very good at that. Take for instance, discussions around hurricanes. You’ll get everybody from President Biden on down to some local weather caster on the the Channel 6 Nightly News confidently declaring that your tailpipe emissions caused hurricane Ian. And it’s your fault that all those homes are blown down. And you got the experts in places like NOAA and IPCC thinking: Oh we just put out a report that doesn’t say that that; in fact says the opposite. We don’t want to draw that connection and we can’t see a trend that would be consistent with that story.
But they say it in a very quiet heavily, coached language. For a long time they were happy to intervene early on when trying to fact check or, you know, counter messages from skeptics who were saying look this isn’t a big deal. They were happy to jump up and tell world leaders: No don’t listen to those guys, we tell you this is a big problem, blah blah blah.
Now they’ve got an even bigger problem with these crazy extremists saying all kinds of stuff that isn’t true and isn’t in their reports. What they should be doing is jumping up and saying to world leaders: Don’t listen to those guys, they’re nuts we we disavow that message. They’re not doing that and at this point they’re not yet capable of doing that.
Culturally within the IPCC, meaning the mainstream various branches such as the climate modeling groups, the atmospheric science groups and and oceanography groups. These are people that are all sort of comfortable with each other in terms of an overall set of assumptions. They may disagree on all kinds of other things, but culturally they’re comfortable with each other. And I think they’re all kind of looking at each other nowand saying; Well, somebody’s got to stand up here and and say that’s not actually what we are arguing.
But nobody wants to do that; nobody wants to be the one to actually speak out. Look what happened when someone like Roger Pielke Jr said, Okay I’ll do it. I’ll stand up and and debunk some of the nonsense around hurricanes and extreme weather. Then what happens: They discover they’ve got so many extremists and activists in their own ranks who then attack a guy like Roger Pielke Jr. And that sends a message to the whole rest of the climate Community:
Don’t be like Roger Pielke Jr. Or you won’t get to eat lunch with the cool kids either.
So they’ve got this police network now in the climate field who make it impossible for them to stand up and and distance the field from the kooky extremists. It’s gonna take a long time for that to get sorted out, but I think there’s a few Milestones that are coming up quickly.
One is that 2030 will be an interesting year because first of all there will not have been any major reductions in CO2 emissions between now and 2030.
Well there were some during the Covid recession but things quickly return to trend. This year’s winter in Europe their CO2 emissions will go way down. Because they’re all going to freeze to death due to their stupid policy decisions that have left them without a reliable energy supply.
But any emission reductions taking place in the West are small and sporadic, and are more than offset by emission increases in China and India and places like that. As industry just leaves the crazy places like Europe and well, Canada unfortunately, places where energy is being made prohibitively expensive. Heavy industry is just packing up and moving somewhere else so by 2030 we won’t have done the emission reductions that the extreme alarmists have been calling for but at the same time we won’t have experienced the climate changes that they’ve been warning about.
In all this language that came out a couple of years ago, we have until 2030 to prevent extreme climate damages in the apocalyptic vision that they created. We’re going to get to 2030 and people will have seen the price that they paid for climate policy, they will have experienced the harm, experienced these winters that we’re in for. Europeans especially are in for the next couple of winters where they don’t have enough fossil energy sources to get through.
And just the cost of living effects of climate policy and 2030 will come
and we won’t have experienced climate Armageddon.
And they won’t be able to turn around and say: Well yeah, but we avoided it because we cut emissions because we didn’t cut emissions either. And so that’s where I would hope there’ll be a certain Reckoning and maybe some of it will have happened up to that point.
But heading to that point we still have the problem that there are lots of people that see this narrative as unsustainable. This whole ESG movement, the climate alarmist movement, isn’t sustainable since it doesn’t make sense. But then someone like Stuart Kirk at HSBC stood up, even though he thought he had approval from his higher ups to make a speech at a finance conference that said none of us really believe in climate alarmism. And he had this great line about the previous speaker said something to the effect of that by 2030 you’re all going to die from climate extremes and none of you even looked up from your phones.
“And so you don’t believe it, I don’t believe it, our clients don’t believe it.”
And soon after he got sacked.
So we’re still at the point where the sensible people, and they’re fortunately still many of them, sensible people in positions of influence don’t yet know how to talk about this. They don’t yet know how to pull the discussion back onto sensible grounds. I’ll return to the point I was making in the beginning: The IPCC were supposed to be the objective scientific thinkers who just call it straight. I think they found it easy in the early days when they felt like their job was to up the level of alarm above what the general public felt. Well now the public has leapfrogged them and and they’re all falling for these crazy alarmist extremes. Well it’s IPCC’s job to fix that.
But culturally within the IPCC and the climate science movement, I don’t think they’re able to do it. And the few people who try seem to get their heads bitten off.
It will eventually come back on the IPCC when when it becomes clear that the alarmist message was way over the top. People will be entitled at that point to say: Well this is your job to put a the brakes on this and straighten people out. And you didn’t do it so how can we trust you now?
TN: Are there any other points you’d like to make?
RM: Sometimes people wonder why would an economist presume to talk about these things? It turns out climate science is a lot like economics in terms of the tools that people use. To a large extent it’s applied statistical analysis. And yes you have to know where your data comes from and you have to be able to interpret it. But the techniques are applied statistics and a lot of those techniques came out of econometrics or at least they came out of the same sources but a lot of the development of the technique has been in econometrics
It’s very hard for people in the climate field to follow those discussions because it’s a it’s econometrics it’s econometric Theory. I teach econometrics at the third year level and so I was just going through stuff I would expect my undergrads maybe the fourth year students to understand. But for a lot of people in the climate field you know this is the first time anyone’s really critiqued the theory behind that method.
It’s the kind of question Steve and I were asked with the Paleo climate stuff: Why are we doing this, why is why wasn’t it people in the field who noticed these flaws in the methods, who dug out the data figured out the method and pointed out the obvious flaws in it. So here I am 20 years after this technique was established I’m publishing a paper that says your fundamental results are invalid; you invoke the theorem incorrectly and your method does not generate unbiased and efficient results like you claimed. In fact it automatically fails the condition so you don’t know anything about what your results are.
TN: I was reading an article and a phrase in there mentioned 2100 expert climate economists. And I just thought that was mind-blowing; there’s such a thing as a climate Economist and there’s 2100 of them. Does that sound right to you? Like what would they do all day?
RM: When I started work in 1996 when I graduated from my PhD, there were only a couple of people who did anything to do with climate change. But like any field there’s a lot of money pumped into climate institutes and into universities to study climate change. So it’s not a standard field in the same sense as trade economics or labor economics or environmental economics would be. So a lot of people will call themselves climate economists now.
So a popular genre now would be impacts analysis. People will take climate model outputs at face value usually the RCP 8.5 scenario, which is garbage but they’ll use it anyway. And then they’ll look at some aspect of the economy, say that pineapple growers are going to experience a five percent reduction in output by 2100 because of climate change.
So there’s that group and among that group, kind of like the hockey stick crowd, where there was sort of an unstated prize for who can get the flattest handle the farthest back. In the climate economics group there’s an unstated prize for who can come up with a highest social cost of carbon. So you can tweak the models and get a social cost of carbon above two hundred dollars, and then above five hundred dollars. Can you get it above 800, and the higher you get, the the more likely your paper is to be into one of the nature journals.
The models that generate social cost of carbon: It’s pretty well known how they operate, and there’s a few knobs on them it’s pretty easy to adjust to get really high social cost of carbon numbers. And it’s also easy to get low social cost of carbon numbers. Then the question becomes, which of these assumptions are more defensible? That’s the part where the question typically doesn’t get asked.
I would guess that a lot of those 2100 climate economists don’t have a big picture approach to the field like they don’t necessarily see climate policy is embedded in the whole array of economic socioeconomic policies, where the ultimate question is what will make people better off on balance all things considered. Because you can get a lot of these young climate economists who will happily endorse Net Zero, even sign letters to the European Parliament encouraging them to pursue Net Zero.
And all they’ve ever studied is what would get us to Net Zero faster and more effectively. But they don’t step back and ask: Is NetZero a very good Target for us to pursue and is the cure worse than the disease? And what would be a climate policy that we could confidently say would be consistent with making people better off around the world over the next 80 years, all things considered?
There aren’t many economists that think about it in that framework. One one of them who does is William D. Nordhaus who won a Nobel Prize in 2018 for his work in climate economics. A lot of the activist crowd were jubilant, thinking finally the economists have noticed climate change. And look at William Nordhaus: He’s an advocate for carbon taxes he won the Nobel Prize. They don’t want to mention the fact that his modeling work showed that: We should do a bit of mitigation to eliminate some of the lowest value activities that generate greenhouse gas emissions, but otherwise the optimal policy is just to live with it and adapt to it. And that’s the upshot of his modeling work and it’s been a very robust result over the 20 or so years that he’s been doing this modeling work. And it convinced the profession enough that his papers are in the best journals and he won a Nobel Prize for it.
Yet as I say the implications are lost on people including a lot of people in this climate economics field that you refer to. Who somehow think the fact that William Nordhaus got the Nobel prize in economics means we should all rush to net zero, even though his own analysis would say absolutely not. That result is not defensible and would make us incomparably worse off and be worse than doing nothing; be worse than just ignoring the climate issue altogether and pursuing economic growth.
TN: I do wonder what percent of the climate economists think that it would be a great thing if we could get back to 280 PPM CO2 and whatever the temperature was in 1850 like end of the little Ice Age with shorter growing seasons etc. Because that seems completely insane to me as an outsider that we would want to spend trillions of dollars to do that, totally crazy yeah.
RM: I doubt even the most enthusiastic climate Economists, meaning the most worried about climate change and most wanting to push a net zero agenda; I think if you really pin them down, very few of them would say, yeah we should try to reverse engineer the 20th century and get back to 280 parts per million, if we could even do it.
Imagine if we could go back in time to 1800 or whatever and and present people with the choice: okay here’s here’s a future path, one where we don’t develop the use of fossil fuels, the economy stays roughly where it is now in terms of living standards, and the atmospheric concentration of CO2 stays at about 280 parts per million and it remains as cold as it is now. We could do that or here’s the other path: We develop fossil fuels, we grow our economies so by 2100 basically everyone around the world is living in a developed economy with a good standard of living and the atmospheric concentration of CO2 goes up to 500 parts per million, and we get a degree and a half or two degrees of warming.
If you presented that choice to people the answer would have been obvious. People would have chosen the path that we chose and halfway along it no one in their right mind would say, oh let’s go back to where we started and and not have all these changes. It’s literally the biggest no-brainer out there.
It was the development of industrial civilization, a net benefit to the world, and the proof is that the places where they didn’t experience that development are doing everything they can to experience it.
And all the supposed harms that people talk about, getting back to extreme weather which we talked about at the beginning: Where are people in the United States moving to? They’re all moving to the extreme weather areas, to the Florida coast and California coast and leaving behind the areas like the Midwest which have the four seasons but not exactly subject to tornadoes and hurricanes. As soon as they can retire they leave those places and go to where they they’ll either have heat waves in the desert or droughts in California or hurricanes on the Florida coast. And that’s where they want to retire to. And then when they get there they can become climate activists and protest greenhouse gases.
Iron Triangle of Public Crises
Postcript:
For more on McKitrick and McIntyre versus the Mann-made Climate hockey stick, see post:
The first graph appeared in the IPCC 1990 First Assessment Report (FAR) credited to H.H.Lamb, first director of CRU-UEA. The second graph was featured in 2001 IPCC Third Assessment Report (TAR) the famous hockey stick credited to M. Mann.
The best context for understanding decadal temperature changes comes from the world’s sea surface temperatures (SST), for several reasons:
The ocean covers 71% of the globe and drives average temperatures;
SSTs have a constant water content, (unlike air temperatures), so give a better reading of heat content variations;
A major El Nino was the dominant climate feature in recent years.
HadSST is generally regarded as the best of the global SST data sets, and so the temperature story here comes from that source. Previously I used HadSST3 for these reports, but Hadley Centre has made HadSST4 the priority, and v.3 will no longer be updated. HadSST4 is the same as v.3, except that the older data from ship water intake was re-estimated to be generally lower temperatures than shown in v.3. The effect is that v.4 has lower average anomalies for the baseline period 1961-1990, thereby showing higher current anomalies than v.3. This analysis concerns more recent time periods and depends on very similar differentials as those from v.3 despite higher absolute anomaly values in v.4. More on what distinguishes HadSST3 and 4 from other SST products at the end. The user guide for HadSST4 is here.
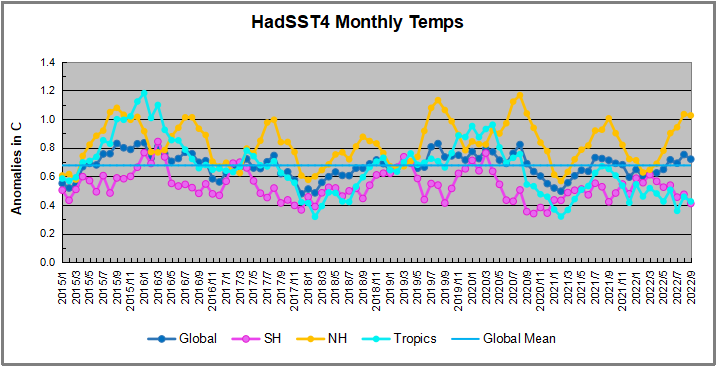
The Current Context
The chart below shows SST monthly anomalies as reported in HadSST4 starting in 2015 through September 2022. A global cooling pattern is seen clearly in the Tropics since its peak in 2016, joined by NH and SH cycling downward since 2016.
Note that in 2015-2016 the Tropics and SH peaked in between two summer NH spikes. That pattern repeated in 2019-2020 with a lesser Tropics peak and SH bump, but with higher NH spikes. By end of 2020, cooler SSTs in all regions took the Global anomaly well below the mean for this period. In 2021 the summer NH summer spike was joined by warming in the Tropics but offset by a drop in SH SSTs, which raised the Global anomaly slightly over the mean. Now in 2022, another strong NH summer spike has peaked in August, but this time both the Tropic and SH are countervailing, resulting in only slight Global warming, now receding to the mean.
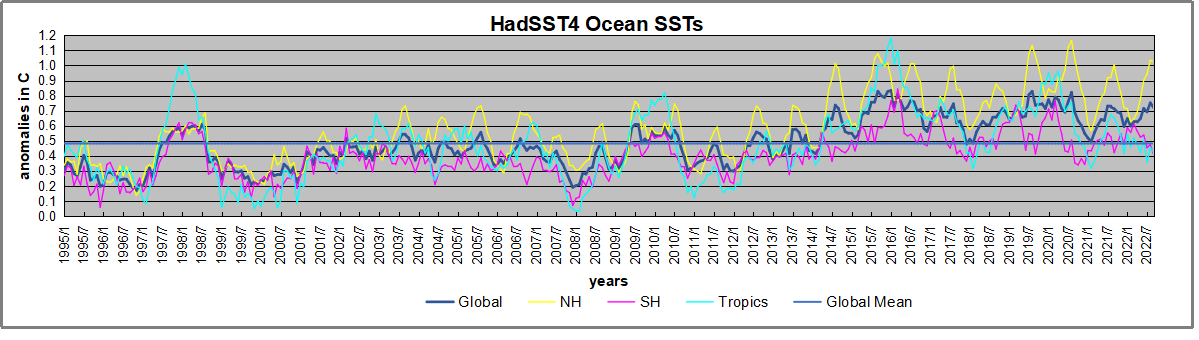
A longer view of SSTs
To enlarge image open in new tab.
The graph above is noisy, but the density is needed to see the seasonal patterns in the oceanic fluctuations. Previous posts focused on the rise and fall of the last El Nino starting in 2015. This post adds a longer view, encompassing the significant 1998 El Nino and since. The color schemes are retained for Global, Tropics, NH and SH anomalies. Despite the longer time frame, I have kept the monthly data (rather than yearly averages) because of interesting shifts between January and July.1995 is a reasonable (ENSO neutral) starting point prior to the first El Nino.
The sharp Tropical rise peaking in 1998 is dominant in the record, starting Jan. ’97 to pull up SSTs uniformly before returning to the same level Jan. ’99. There were strong cool periods before and after the 1998 El Nino event. Then SSTs in all regions returned to the mean in 2001-2.
SSTS fluctuate around the mean until 2007, when another, smaller ENSO event occurs. There is cooling 2007-8, a lower peak warming in 2009-10, following by cooling in 2011-12. Again SSTs are average 2013-14.
Now a different pattern appears. The Tropics cooled sharply to Jan 11, then rise steadily for 4 years to Jan 15, at which point the most recent major El Nino takes off. But this time in contrast to ’97-’99, the Northern Hemisphere produces peaks every summer pulling up the Global average. In fact, these NH peaks appear every July starting in 2003, growing stronger to produce 3 massive highs in 2014, 15 and 16. NH July 2017 was only slightly lower, and a fifth NH peak still lower in Sept. 2018.
The highest summer NH peaks came in 2019 and 2020, only this time the Tropics and SH were offsetting rather adding to the warming. (Note: these are high anomalies on top of the highest absolute temps in the NH.) Since 2014 SH has played a moderating role, offsetting the NH warming pulses. After September 2020 temps dropped off down until February 2021. Now in 2021-22 there are again summer NH spikes, but in 2022 moderated by cooling Tropics and SH SSTs.
What to make of all this? The patterns suggest that in addition to El Ninos in the Pacific driving the Tropic SSTs, something else is going on in the NH. The obvious culprit is the North Atlantic, since I have seen this sort of pulsing before. After reading some papers by David Dilley, I confirmed his observation of Atlantic pulses into the Arctic every 8 to 10 years.
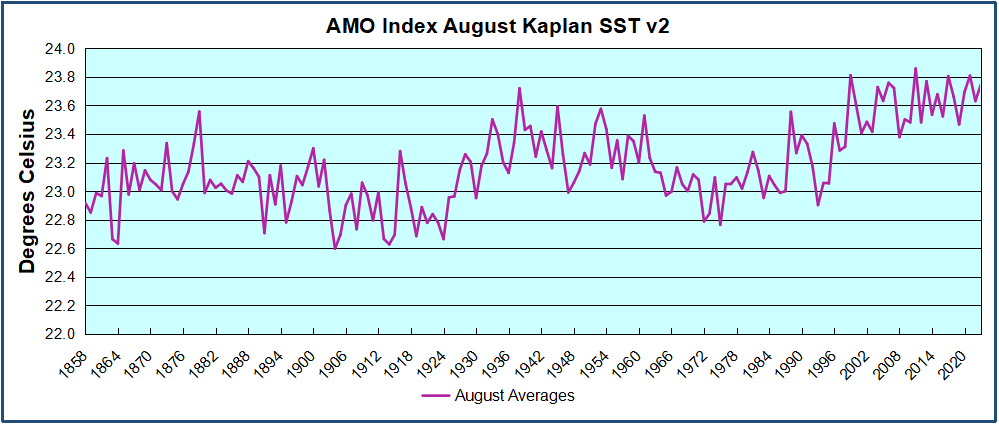
But the peaks coming nearly every summer in HadSST require a different picture. Let’s look at August, the hottest month in the North Atlantic from the Kaplan dataset.
The AMO Index is from from Kaplan SST v2, the unaltered and not detrended dataset. By definition, the data are monthly average SSTs interpolated to a 5×5 grid over the North Atlantic basically 0 to 70N. The graph shows August warming began after 1992 up to 1998, with a series of matching years since, including 2020, dropping down in 2021. Because the N. Atlantic has partnered with the Pacific ENSO recently, let’s take a closer look at some AMO years in the last 2 decades.
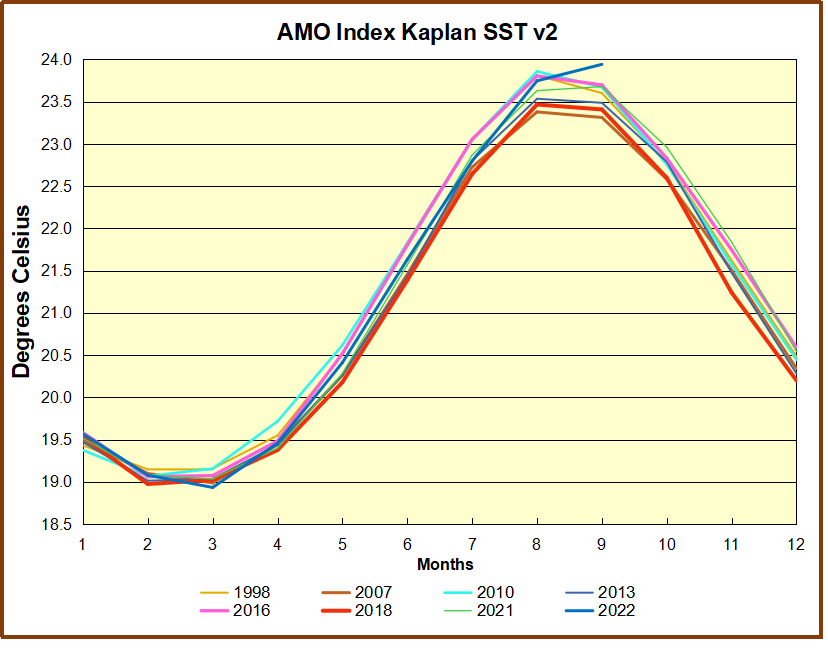
This graph shows monthly AMO temps for some important years. The Peak years were 1998, 2010 and 2016, with the latter emphasized as the most recent. The other years show lesser warming, with 2007 emphasized as the coolest in the last 20 years. Note the red 2018 line is at the bottom of all these tracks. The heavy blue line shows that 2022 started warm, dropped to the bottom and stayed near the lower tracks. Note the strength of this summer’s warming pulse, in September peaking to nearly 24 Celsius, a new record for this dataset.
Summary
The oceans are driving the warming this century. SSTs took a step up with the 1998 El Nino and have stayed there with help from the North Atlantic, and more recently the Pacific northern “Blob.” The ocean surfaces are releasing a lot of energy, warming the air, but eventually will have a cooling effect. The decline after 1937 was rapid by comparison, so one wonders: How long can the oceans keep this up? If the pattern of recent years continues, NH SST anomalies will likely decline in coming months, along with ENSO also weakening will probably determine a cooler outcome.
Footnote: Why Rely on HadSST4
HadSST is distinguished from other SST products because HadCRU (Hadley Climatic Research Unit) does not engage in SST interpolation, i.e. infilling estimated anomalies into grid cells lacking sufficient sampling in a given month. From reading the documentation and from queries to Met Office, this is their procedure.
HadSST4 imports data from gridcells containing ocean, excluding land cells. From past records, they have calculated daily and monthly average readings for each grid cell for the period 1961 to 1990. Those temperatures form the baseline from which anomalies are calculated.
In a given month, each gridcell with sufficient sampling is averaged for the month and then the baseline value for that cell and that month is subtracted, resulting in the monthly anomaly for that cell. All cells with monthly anomalies are averaged to produce global, hemispheric and tropical anomalies for the month, based on the cells in those locations. For example, Tropics averages include ocean grid cells lying between latitudes 20N and 20S.
Gridcells lacking sufficient sampling that month are left out of the averaging, and the uncertainty from such missing data is estimated. IMO that is more reasonable than inventing data to infill. And it seems that the Global Drifter Array displayed in the top image is providing more uniform coverage of the oceans than in the past.
USS Pearl Harbor deploys Global Drifter Buoys in Pacific Ocean
Footnote Rare Triple Dip La Nina Likely This Winter
The unusual weather phenomenon might result in the snowiest season in years for some parts of the country.
The long-range winter forecast could be good news for skiers living in the certain parts of the U.S. and Canada. The National Oceanic and Atmospheric Administration(NOAA) estimates that the chance of a La Niña occurring this fall and early winter is 86 percent, and the main beneficiary is expected to be mountains in the Northwest and Northern Rockies.
If NOAA’s predictions pan out, this will be the third La Niña in a row—a rare phenomenon called a “Triple Dip La Niña.” Between now and 1950, only two Triple Dips have occurred.
Smith also notes that winters on the East Coast are similarly tricky to predict during La Niña years. “In the West, you’re simply looking for above-average precipitation, which typically translates to above-average snowfall, but in the East, you have temperature to worry about as well … that adds another complication.” In other words, increased precip could lead to more rain if the temperatures aren’t cooperative.
The presence of a La Niña doesn’t always translate to higher snowfall in the North, either, as evidenced by last ski season, which saw few powder days.
However, in consecutive La Niña triplets, one winter usually involves above-average snowfall. While this historical pattern isn’t tied to any documented meteorological function, it could mean that the odds of a snowy 2022’-’23 season are higher, given the previous two La Niñas didn’t deliver the goods.
The great Austrian economist Ludwig von Mises was being generous by describing interventionism’s nasty side-effects as “unintended.” Some younger interventionists are naïve, and know not what they do, but the older, street-smart captains of progressive politics understand the harms their policies entail. For them, the adverse consequences are features, not bugs.
The only downside is the risk of political retribution at the polls.
That’s the predicament in which the Biden administration now finds itself. It is also the theme of “Energy Inflation Was by Design,” a new report by supply-chain consultant Joseph Toomey.
[Synopsis is in previous post Energy Inflation Playbook]
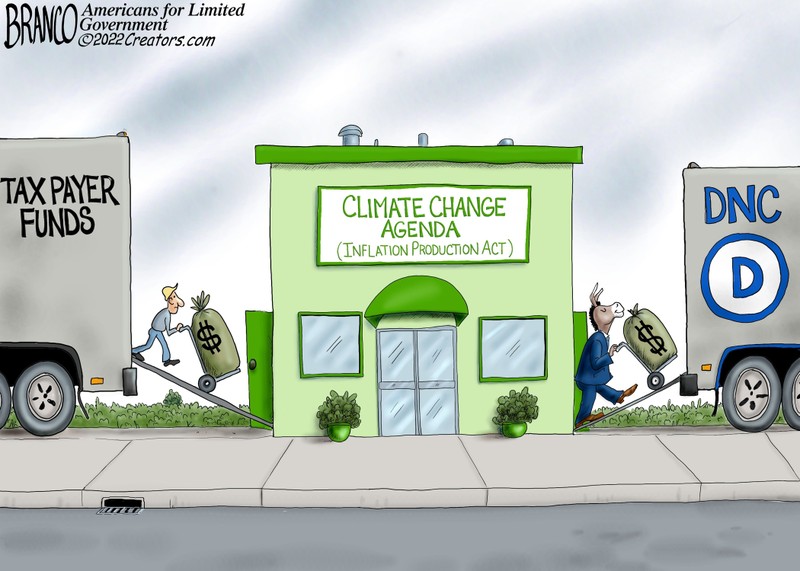
President Biden and congressional Democrats want to replace fossil fuels with a “zero-carbon” energy system. Their biggest win to date is the comically mistitled Inflation Reduction Act (IRA). A Penn-Wharton analysis estimated that the IRA would increase federal climate and energy spending by $369 billion over ten years. A recent article in The Atlantic touts a Credit Suisse estimate that actual climate-related federal support could reach $800 billion. That’s because the incentives for electric vehicles and renewable energy are “uncapped tax credits.” Moreover, since federal spending leverages private-sector investment, total economy-wide green-tech spending could increase by as much as $1.7 trillion.
Nor is that all. The Department of Energy (DOE) estimates that the IRA has increased its loan program authorities by up to $350 billion.
No wonder Democrats celebrated the IRA’s enactment. No bigger program to rig energy markets against fossil fuels was ever enacted.
The IRA aims to enrich thousands of enterprises, tens of thousands of employees, and millions of shareholders—all dependent on Democrats to keep the gravy train flowing. Hardly an “unintended” consequence.
But voters see and feel the downsides of Biden’s war on fossil fuels: the high costs of gasoline, electricity, and other utilities, which in turn increase the costs of food, rent, and consumer goods. Those effects, moreover, coincide with high general inflation, a cratering stock market, and negative GDP growth in two consecutive quarters. Biden tries to blame Vladimir Putin and Big Oil for America’s energy woes. That is nonsense, and the public isn’t buying it.
Toomey marshals overwhelming evidence that “energy inflation” is a core feature of the president’s climate agenda. And how could it be otherwise? A core progressive article of faith is that fossil fuels are too cheap because market prices do not reflect the “social costs” of carbon dioxide (CO2) and other greenhouse gases (GHGs). Accordingly, no matter how expensive or scarce fossil energy may become for other reasons, taxing or capping fossil-fuel consumption to make it even more costly is hailed as a “climate solution.” Of course, handicapping fossil fuels is also touted as a way to make renewables more “competitive.” As President Obama enthused, cap-and-trade will “finally make renewable energy the profitable kind of energy in America.”
The public, however, has repeatedly spurned proposals to tax or cap the carbon content of fuels or emissions. So, U.S. progressives now concentrate on rigging energy markets via targeted regulations, state-level renewable-energy quotas, and subsidies. As noted, the IRA sets a new standard for anti-fossil-fuel subsidies.
President Biden seeks to cut U.S. carbon emissions by 50-52 percent below 2005 levels by 2030 and achieve a zero-emission electricity sector by 2035. That means that about half of all U.S. fossil-fuel consumption must end in eight years. Few investors want to park their capital in rapidly contracting industries. So, thanks to Biden, the market forecasts that supplies of oil, gas, and coal will decline relative to demand—and prices will rise. The expectation of shrinking supplies and higher future prices puts upward pressure on energy prices today.
An irony noted by Toomey is that by endangering fossil-fuel energy supply, Biden has not only increased fossil-fuel energy prices but also boosted oil and gas company profits and stock values. The short-term enrichment of oil companies may well be an unintended consequence of a long-term agenda to put them out of business. On the other hand, Biden’s boost to oil industry profits is also the setup for further interventions popular with progressive activists and politicians—windfall profits taxes, export bans, and Federal Trade Commission investigations of “anti-consumer behavior.”
Toomey demolishes the Biden administration’s allegation that oil companies are deliberately reducing refinery utilization to constrict supplies and raise prices. In fact, refineries are running at higher utilization rates than ever (about 94 percent).
As a presidential candidate, Joe Biden promised to “get rid of fossil fuels,” assuring one activist, “I guarantee you. We’re going to end fossil fuel.”
Toomey reviews several Biden initiatives that back up such threats. The major ones, besides the government-wide, IRA-funded effort to channel “the flow of capital toward climate-aligned investments and away from high-carbon investments,” include:
Halting petroleum-development activity in Alaska’s National Arctic Wildlife Refuge;
Rejoining the Paris Climate Accords without asking for the Senate’s advice and consent;
Considering a non-attainment designation for ozone pollution that could curb drilling in the Permian Basin, which accounts for 43 percent of U.S. oil production; and
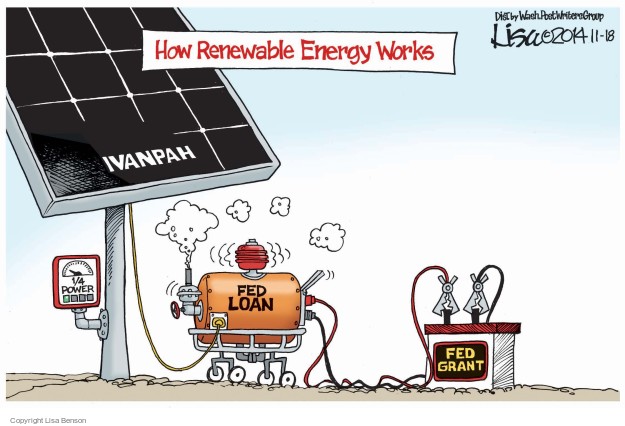
To provide historical context for the fiscal side of Biden’s climate agenda, Toomey discusses the Obama DOE loan program established by the American Recovery and Reinvestment (“Stimulus”) Act. The best-known program beneficiary was solar-panel manufacturer Solyndra, which filed for bankruptcy protection in 2011 despite receiving $535 million in DOE loan guarantees. Some readers may also recall a list of seven such “Stimulosers.”
In short, nearly seven out of ten Obama DOE loan recipients in a $32 billion loan program went bankrupt. The total federal financial support provided by the IRA for “climate-aligned” investments is potentially 36 times larger. The stage is set for scores of Solyndras. Toomey’s labor as a chronicler of the war on fossil fuels is nowhere near done.
Two fallacies ensure meaningless public discussion about climate “crisis” or “emergency.” H/T to Terry Oldberg for comments and writings prompting me to post on this topic.
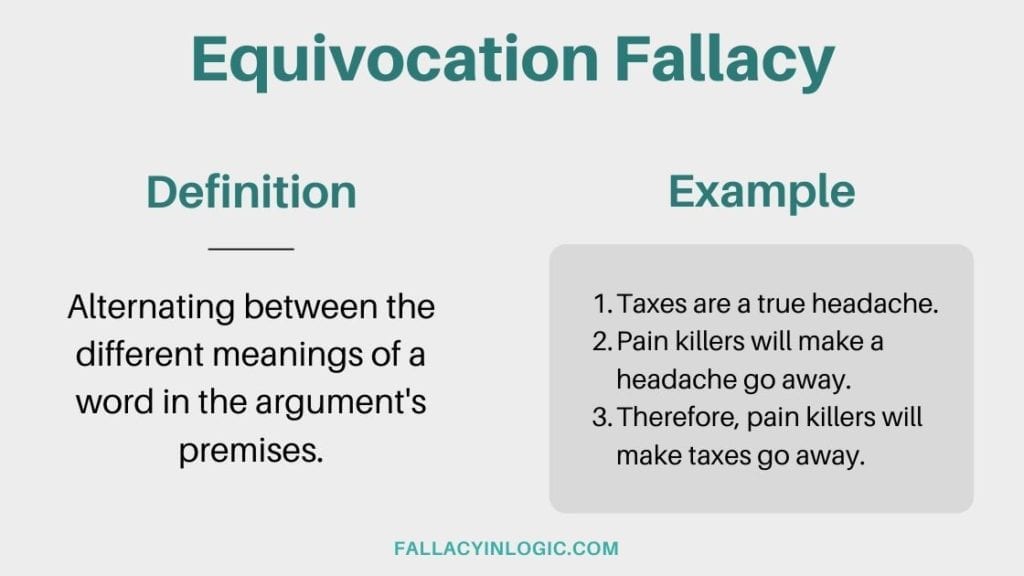
One corruption is the numerous times climate claims include fallacies of Equivocation. For instance, “climate change” can mean all observed events in nature, but as defined by IPCC all are 100% caused by human activities. Similarly, forecasts from climate models are proclaimed to be “predictions” of future disasters, but renamed “projections” in disclaimers against legal liability. And so on.
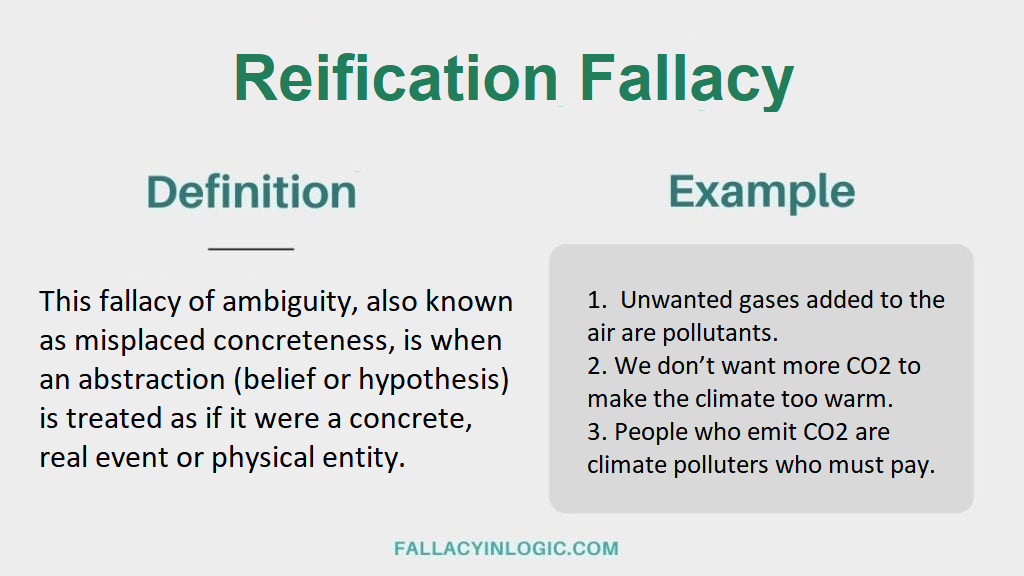
A second error in the argument is the Fallacy of Misplaced Concreteness, AKA Reification. This involves mistaking an abstraction for something tangible and real in time and space. We often see this in both spoken and written communications. It can take several forms:
♦ Confusing a word with the thing to which it refers
♦ Confusing an image with the reality it represents
♦ Confusing an idea with something observed to be happening
Examples of Equivocation and Reification from the World of Climate Alarm
“Seeing the wildfires, floods and storms, Mother Nature is not happy with us failing to recognize the challenges facing us.” – Nancy Pelosi
Mother Nature’ is a philosophical construct and has no feelings about people.
“This was the moment when the rise of the oceans began to slow and our planet began to heal …” – Barack Obama
The ocean and the planet do not respond to someone winning a political party nomination. Nor does a planet experience human sickness and healing.
“If something has never happened before, we are generally safe in assuming it is not going to happen in the future, but the exceptions can kill you, and climate change is one of those exceptions.” – Al Gore
The future is not knowable, and can only be a matter of speculation and opinion.
“The planet is warming because of the growing level of greenhouse gas emissions from human activity. If this trend continues, truly catastrophic consequences are likely to ensue. “– Malcolm Turnbull
Temperature is an intrinsic property of an object, so temperature of “the planet” cannot be measured. The likelihood of catastrophic consequences is unknowable. Humans are blamed as guilty by association.
“Anybody who doesn’t see the impact of climate change is really, and I would say, myopic. They don’t see the reality. It’s so evident that we are destroying Mother Earth. “– Juan Manuel Santos
“Climate change” is an abstraction anyone can fill with subjective content. Efforts to safeguard the environment are real, successful and ignored in the rush to alarm.
“Climate change, if unchecked, is an urgent threat to health, food supplies, biodiversity, and livelihoods across the globe.” – John F. Kerry
To the abstraction “Climate Change” is added abstract “threats” and abstract means of “checking Climate Change.”
“Climate change is the most severe problem that we are facing today, more serious even than the threat of terrorism.” -David King
Instances of people killed and injured by terrorists are reported daily and are a matter of record, while problems from Climate Change are hypothetical
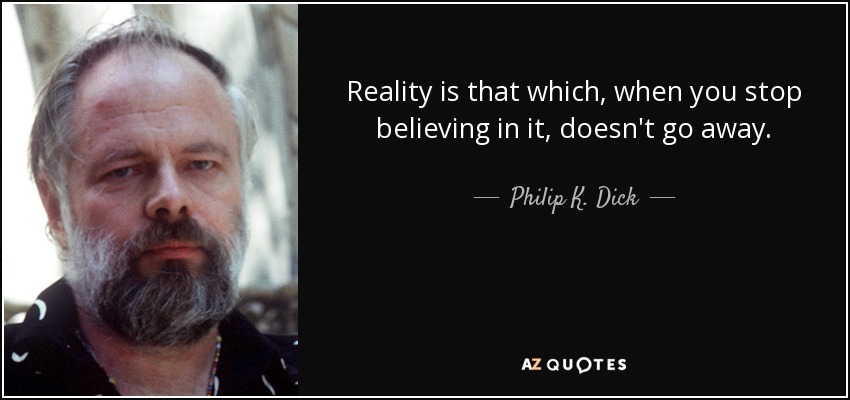
Corollary: Reality is also that which doesn’t happen, no matter how much we expect it to.
Climate Models Are Built on Fallacies
A previous post Chameleon Climate Modelsdescribed the general issue of whether a model belongs on the bookshelf (theoretically useful) or whether it passes real world filters of relevance, thus qualifying as useful for policy considerations.
Following an interesting discussion on her blog, Dr. Judith Curry has written an important essay on the usefulness and limitations of climate models.
The paper was developed to respond to a request from a group of lawyers wondering how to regard claims based upon climate model outputs. The document is entitled Climate Models and is a great informative read for anyone. Some excerpts that struck me in italics with my bolds and added images.
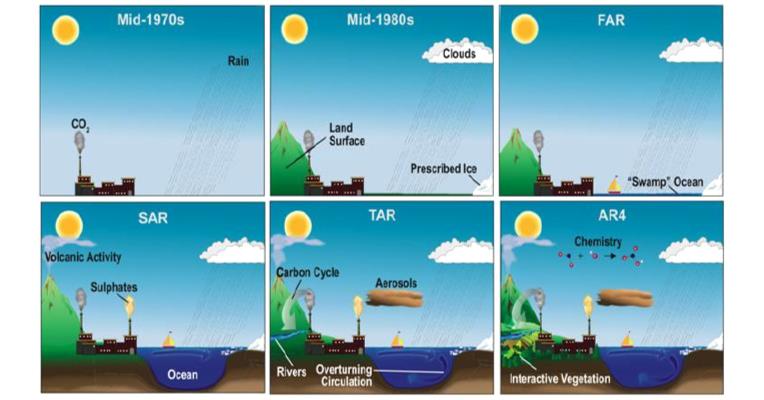
Climate model development has followed a pathway mostly driven by scientific curiosity and computational limitations. GCMs were originally designed as a tool to help understand how the climate system works. GCMs are used by researchers to represent aspects of climate that are extremely difficult to observe, experiment with theories in a new way by enabling hitherto infeasible calculations, understand a complex system of equations that would otherwise be impenetrable, and explore the climate system to identify unexpected outcomes. As such, GCMs are an important element of climate research.
Climate models are useful tools for conducting scientific research to understand the climate system. However, the above points support the conclusion that current GCM climate models are not fit for the purpose of attributing the causes of 20th century warming or for predicting global or regional climate change on timescales of decades to centuries, with any high level of confidence. By extension, GCMs are not fit for the purpose of justifying political policies to fundamentally alter world social, economic and energy systems.
It is this application of climate model results that fuels the vociferousness of the debate surrounding climate models.
Evolution of state-of-the-art Climate Models from the mid 70s to the mid 00s. From IPCC (2007)
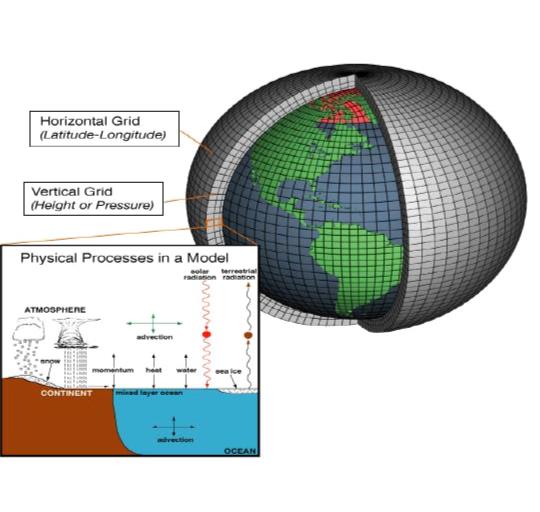
The actual equations used in the GCM computer codes are only approximations of the physical processes that occur in the climate system.
While some of these approximations are highly accurate, others are unavoidably crude. This is because the real processes they represent are either poorly understood or too complex to include in the model given the constraints of the computer system. Of the processes that are most important for climate change, parameterizations related to clouds and precipitation remain the most challenging, and are the greatest source of disagreement among different GCMs.
There are literally thousands of different choices made in the construction of a climate model (e.g. resolution, complexity of the submodels, parameterizations). Each different set of choices produces a different model having different sensitivities. Further, different modeling groups have different focal interests, e.g. long paleoclimate simulations, details of ocean circulations, nuances of the interactions between aerosol particles and clouds, the carbon cycle. These different interests focus their limited computational resources on a particular aspect of simulating the climate system, at the expense of others.
Overview of the structure of a state-of-the-art climate model. See Climate Models Explainedby R.G. Brown
Human-caused warming depends not only on how much CO2 is added to the atmosphere, but also on how ‘sensitive’ the climate is to the increased CO2. Climate sensitivity is defined as the global surface warming that occurs when the concentration of carbon dioxide in the atmosphere doubles. If climate sensitivity is high, then we can expect substantial warming in the coming century as emissions continue to increase. If climate sensitivity is low, then future warming will be substantially lower.
In GCMs, the equilibrium climate sensitivity is an ‘emergent property’ that is not directly calibrated or tuned.
While there has been some narrowing of the range of modeled climate sensitivities over time, models still can be made to yield a wide range of sensitivities by altering model parameterizations. Model versions can be rejected or not, subject to the modelers’ own preconceptions, expectations and biases of the outcome of equilibrium climate sensitivity calculation.
Further, the discrepancy between observational and climate model-based estimates of climate sensitivity is substantial and of significant importance to policymakers. Equilibrium climate sensitivity, and the level of uncertainty in its value, is a key input into the economic models that drive cost-benefit analyses and estimates of the social cost of carbon.
Variations in climate can be caused by external forcing, such as solar variations, volcanic eruptions or changes in atmospheric composition such as an increase in CO2. Climate can also change owing to internal processes within the climate system (internal variability). The best known example of internal climate variability is El Nino/La Nina. Modes of decadal to centennial to millennial internal variability arise from the slow circulations in the oceans. As such, the ocean serves as a ‘fly wheel’ on the climate system, storing and releasing heat on long timescales and acting to stabilize the climate. As a result of the time lags and storage of heat in the ocean, the climate system is never in equilibrium.
The combination of uncertainty in the transient climate response (sensitivity) and the uncertainties in the magnitude and phasing of the major modes in natural internal variability preclude an unambiguous separation of externally forced climate variations from natural internal climate variability. If the climate sensitivity is on the low end of the range of estimates, and natural internal variability is on the strong side of the distribution of climate models, different conclusions are drawn about the relative importance of human causes to the 20th century warming.
Figure 5.1. Comparative dynamics of the World Fuel Consumption (WFC) and Global Surface Air Temperature Anomaly (ΔT), 1861-2000. The thin dashed line represents annual ΔT, the bold line—its 13-year smoothing, and the line constructed from rectangles—WFC (in millions of tons of nominal fuel) (Klyashtorin and Lyubushin, 2003). Source: Frolov et al. 2009
Anthropogenic (human-caused) climate change is a theory in which the basic mechanism is well understood, but whose potential magnitude is highly uncertain.
What does the preceding analysis imply for IPCC’s ‘extremely likely’ attribution of anthropogenically caused warming since 1950? Climate models infer that all of the warming since 1950 can be attributed to humans. However, there have been large magnitude variations in global/hemispheric climate on timescales of 30 years, which are the same duration as the late 20th century warming. The IPCC does not have convincing explanations for previous 30 year periods in the 20th century, notably the warming 1910-1945 and the grand hiatus 1945-1975. Further, there is a secular warming trend at least since 1800 (and possibly as long as 400 years) that cannot be explained by CO2, and is only partly explained by volcanic eruptions.
CO2 relation to Temperature is Inconsistent.
Summary
There is growing evidence that climate models are running too hot and that climate sensitivity to CO2 is on the lower end of the range provided by the IPCC. Nevertheless, these lower values of climate sensitivity are not accounted for in IPCC climate model projections of temperature at the end of the 21st century or in estimates of the impact on temperatures of reducing CO2 emissions.
The climate modeling community has been focused on the response of the climate to increased human caused emissions, and the policy community accepts (either explicitly or implicitly) the results of the 21st century GCM simulations as actual predictions. Hence we don’t have a good understanding of the relative climate impacts of the above (natural factors) or their potential impacts on the evolution of the 21st century climate.
Footnote:
There are a series of posts here which apply reality filters to attest climate models. The first was Temperatures According to Climate Modelswhere both hindcasting and forecasting were seen to be flawed.
Tom Slater reports on this social cancer and the need to excise it in his Spectator article Just stop Just Stop Oil. Excerpts in italics with my bolds and added images.
The chasm between the protestors and the public grows wider with each demonstration
Why block roads? Why make people’s lives miserable? Who do you think this is going to convince? So go the interminable TV-news debates after each disruptive piece of direct action by eco-troupe Extinction Rebellion and the various single-issue offshoots, such as Just Stop Oil, that it has inspired.
These past two weeks, Just Stop Oil has been back in the spotlight. It is now into its 12th consecutive day of action in London, demanding the government stop all oil and gas production. Yesterday, its activists blocked roads in Knightsbridge, delaying an ambulance, a fire engine and cars carrying babies to hospital. Today, they’re sitting in the road outside parliament.
Once again, all these hi-vis-clad protestors have managed to achieve, beyond disrupting the days of ordinary people and the work of the emergency services, is to infuriate members of the public up and down the country.
But the tactics of Just Stop Oil, Insulate Britain and other groups make a lot more sense when you realise that the point of these protests is to disrupt the lives of working-class people. Indeed, the future these bourgeois irritants envisage would sacrifice ordinary people’s living standards on the altar of eco-austerity.
It’s perhaps too easy to portray Extinction Rebellion as dominated by the posh and over-educated. But only because this is a factually accurate characterisation. Academic research has shown that XR activists are overwhelmingly middle class and a whopping 85 per cent of them have degrees.
There’s a reason for this class skew. The eco agenda is essentially about making life harder for anyone who doesn’t work primarily on a laptop, who can’t cycle to work, who drives for a living, or who just isn’t convinced that soaring energy costs are the price we must pay for progress.
No wonder so few working-class people are fully paid-up members of these groups. No wonder working-class people clash with these protestors on the streets whenever these supple-handed sons of privilege decide to glue themselves to the road and bring traffic to a standstill.
In groups like Just Stop Oil we see a perfect fusion of political goals and political tactics.
Their ultimate aim is to make working-class people’s lives more difficult, insisting essentially that everyone must pay more to consume less. Their campaign to bring this about takes the form of making working-class people’s lives more difficult. It’s genius, really.
The class tensions of it all have become crystal clear in the repeated scenes of builders, delivery men and otherwise irked members of the public having to drag these activists off the road so they can go about their business – as we saw in Knightsbridge again yesterday.
‘I will start moving these people myself, I ain’t f****** about’, said one man, who told the protestors he didn’t give a ‘flying s***’ about what they had to say.
The chasm between the protestors and the public grows wider with each protest. In another clip from this week, a man says to the road-blocking activists: ‘Somebody’s sick, get off the road!’ To which a protester replies, remarkably: ‘If somebody’s sick, they shouldn’t be driving.’ The man is then forced to spell out that ‘they’ve got a passenger who is sick’. ‘Are you silly?’, he adds.
Direct action is supposed to be disruptive, of course. But the protestors’ callous indifference to the disruption they are causing speaks to something deeper about their movement. It has become so cultish and myopically obsessed with saving ‘the planet’ that it has become entirely alienated from the needs of human beings.
We glimpsed this in Just Stop Oil’s media appearances yesterday. During an interview on GB News, a young man, apparently convinced that we are on the brink of ‘societal collapse’, suggested his cause was ‘more serious actually’ than the plight of a sick person in an ambulance, stuck behind his friends’ human roadblock.
This indifference makes ordinary people all the more infuriated when the police seem incapable of dealing with these protests in a timely fashion. In some cases, officers have even appeared to indulge protestors. At an Insulate Britain roadblock last year, one officer was filmed telling the activists to let them know if they ‘need anything’.
Everyone supports the right to protest, of course. There is just no right to glue yourself to a road for hours on end. Now more and more members of the public are willing to do what the police are apparently so incapable of doing. And who could blame them?
These aren’t protests for the climate, they’re protests against ordinary people.
Having failed at the ballot box, millennial climate activists will pursue any means to impose their will on society
A handout picture from the Just Stop Oil climate campaign group shows activists with their hands glued to the wall under Vincent van Gogh’s “Sunflowers” after throwing tomato soup on the painting at the National Gallery in central London on October 14, 2022.
Environmentalists have captured the Democratic party and, in their push towards Net Zero, are aiding Russia and China, a senior fellow at RealClearFoundation, Rupert Darwall, says.
Furthermore, the push towards Net Zero has monopolized “the money,” as the group includes many Silicon Valley billionaires, intellectuals, and the mainstream media, Darwall told The Epoch Times and NTD’s Paul Greaney in an interview.
In the interview, which aired on NTD’s Fresh Look America on Oct. 12, Darwall said a prime example of environmentalists taking over the Democratic party, and monopolizing the money, is California.
There, billionaire environmentalists have instituted “an aggressive green agenda” that doesn’t negatively impact them but directly opposes the average California voters’ interests, he said.
“Voters, and particularly in the Central Valley, who endure stifling temperatures in summer, had to pay ruthlessly high prices to condition their homes. They don’t have beachfront properties that are cooled from the Pacific.”
Darwall added that because California is “essentially a one-party state,” voters can’t correct the “extreme environmental policies.” Plus, environmentalists use a version of McCarthyism to stifle opposition.
In the 1950s, U.S. Senator Joseph McCarthy accused thousands of innocent people and parties of disloyalty and allowing Communism to influence their lives and policies.
Darwall said environmentalists today use a similar tactic when they label anyone who disagrees with them as a “climate denier.”
“They know ‘denier’ is a very powerful term to be called. You may have seen a New York Times journalist interviewing the president of World Bank, and [the journalist asks] “are you a climate denier?’ It’s designed to chill debate. Not just chill it but prevent people questioning.”
[ Tip: Q: Aren’t you a climate denier? A: I am a climate thinker. ]
Green Imperialism
If this progression towards Net Zero continues, Darwall said he knew who will win.
“China and Russia. I mean, basically, the opponents of the West, geopolitically from stepping back, but they’re the big winners from the West deciding to bring itself to its knees. I mean, no modern economy can function without cheap, abundant energy and fossil fuel derived energy.”
“We’re basically cutting off our legs. The pain will increase. People are blaming Putin for the terrible winter the Europeans are going to experience this this year. But the way I would put it is Net Zero is Vladimir Putin’s best ally.”
Darwall further added that not only is the West hurting itself and helping Putin, but it’s also engaging in a sort of “green imperialism.”
As mentioned above, the president of the World Bank had been attacked, specifically by Al Gore, Darwall said, because the World Bank was one of the “big providers of finance to Africa.”
“There are over a billion Africans, and they are energy starved. Africa is an energy-starved continent. And the effect of Western green policies is to freeze, as it were, African Development at a very low level.”
Darwall continued, “Grid-delivered electricity is the doorway to the modern world. If you compare the 19th century to the 20th century, the big change is electricity.
“For Africa to flourish and develop, it needs reliable, cheap, grid-delivered electricity. And that is what people like Al Gore and John Kerry are denying Africans.”
Darwall specified that people like Kerry and Gore are pursuing an agenda that geologically damages the West, its strategic interest, and the economic and social interests of less developed nations.
Political Reckoning
As a result, Darwall believed a political reckoning is coming to the West. He says that as gas prices and inflation continue to climb, voters will show their displeasure for extreme environmental policies and “vote for the other party.”
That benefits Republicans, as under Donald Trump, the United States was an energy superpower.
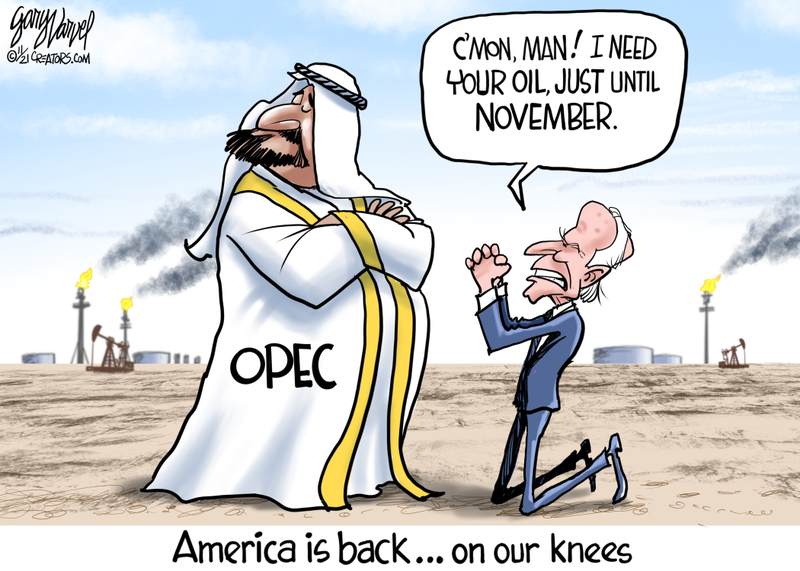
“In those four years he was president, America was an energy superpower. And now this energy superpower is going around to the Gulf, begging OPEC plus to increase oil production. It’s absolutely extraordinary.”
As for Europe, Darwall believes significant political changes will likely occur in Britain and other countries, but Germany is fully committed to Net Zero.
When asked what would happen if the West reversed its Net Zero policy and returned to producing oil and gas, Darwall replied, “That’s a catastrophic outcome for Russia. Because Russia is a natural gas oil exporting country and economy, and it really, it needs those foreign currency earnings.
“Its economy depends on it. So, it would be terribly bad. It would be awful for Russia. That’s why I say that Net Zero is Vladimir Putin’s best ally.”
Dennis Prager explains in his American Greatness article Explaining Conservatism. Excerpts in italics with my bolds and added images.
The next time a liberal or left-wing friend or relative asks you
what conservatives stand for, say “liberty”—especially free speech.
There are a number of reasons many young people shy away from conservatism.
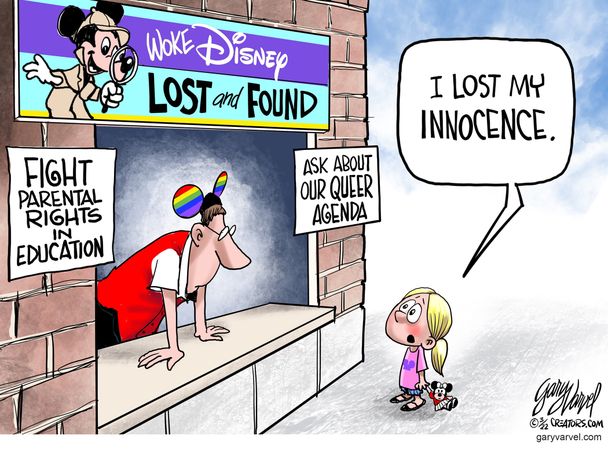
The most obvious is that they have been exposed only to left-wing values—from elementary school through graduate school, in the movies, on television, on social media and now even at Disneyland.
Less obvious but equally significant is that they have never been properly exposed to conservative values. Since at least the World War II generation, most parents who held conservative values either did not think they had to teach their children those values or simply did not know how to do so. Most still don’t. If asked to define conservative values, most conservatives will be tongue-tied.
In light of this, I present here, and in subsequent columns, a list of conservatism’s defining characteristics.
We will begin with the most important conservative value—liberty.
Conservatives believe in individual liberty (there is no liberty other than individual liberty). It has been the primary value of the American experiment. While many countries include the word “liberty” in their national mottoes and national anthems, no country has so emphasized liberty as has America.
That is why:
The French designers of the Statue of Liberty gave the statue to America.
The iconic symbol of America is the Liberty Bell.
The one inscription on the Liberty Bell is a verse about liberty from the Book of Leviticus: “And you shall proclaim liberty throughout the land to all its inhabitants.”
Americans sing of their country as “the land of the free” and “sweet land of liberty.”
Until recently, every America schoolchild knew by heart Patrick Henry’s cry, “Give me liberty, or give me death!”
Chinese young people who protested the Communist takeover of Hong Kong waved the American flag.
And that is why America’s founders were adamant that the state—the national government—be as small, as limited, as possible. The bigger the government, the smaller the liberty. Big government and big liberty are mutually exclusive.
Moreover, liberty is not the only victim of big government. Human life is also a victim. Every genocide of the 20th century, the century of genocide, was committed by big government. Without big government, one hundred million people would not and could not have been slaughtered, and a billion more would not and could not have been enslaved. (There was one exception: the Hutu genocide of Tutsis in Rwanda, which was tribal in nature. Tribal culture, like left-wing culture, emphasizes the group over the individual.)
In order to limit the size and power of the national government, the founders delegated most governmental powers to the states.
They did so in the Constitution by specifying what powers the national government had and by asserting that all other powers be delegated to the states. In addition, they increased the power of the states by having presidential elections decided by the states—the Electoral College—rather than by the popular national vote, and by how they structured the Senate, one of the two branches of Congress. They gave every state equal representation in the Senate, no matter how small the population of the state.
The Left’s opposition to the Electoral College and to the Senate makes perfect sense. It is the power inherent in big government, not liberty, that animates the Left. The defining characteristic of every left-wing party and movement in the world has always been an ever bigger and therefore more powerful government.
Liberty is a liberal value as well as a conservative value, but it has never been a left-wing value. Liberty cannot be a left-wing value because the more liberty individuals have, the less power the government has. Conversely, the weaker the state, the weaker the Left.
This especially holds true for the greatest of all liberties—free speech.
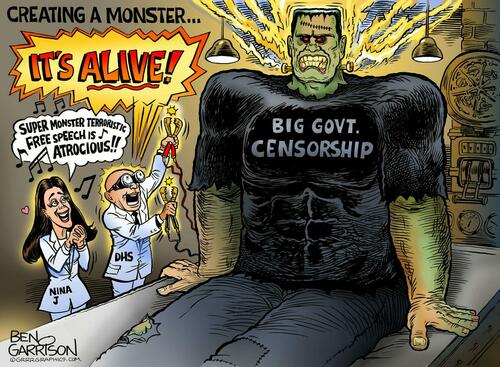
Free speech is a fundamental conservative value, and it has been a fundamental liberal value. But it has never been a left-wing value. For that reason, everywhere the Left is dominant—government, media, universities—it stifles dissent. The reason is simple: No left-wing movement can survive an open exchange of ideas. Leftist ideologies are emotion- and power-based, not reason- or morality-based. So, leftists cannot allow honest debate.
They do not argue with opponents; they suppress them.
For the first time in American history, freedom of speech is seriously threatened—indeed it has already been seriously curtailed. With the ascent of the Left, the inevitable suppression of free speech is taking place.
That liberals—who have always valued liberty and free speech—vote for the great suppressor of liberty, the Left, is the tragedy of our time. The reason they do so is that liberals forgot what they stand for; they only remember what they believe they stand against: conservatives.
So, the next time a liberal or left-wing friend or relative asks you what conservatives stand for, say “liberty”—especially free speech. And explain that is why you fear and oppose big government—because big government and individual liberty cannot coexist.
Hot, Hot, Hot. You will have noticed that the term “climate change” is now synonymous with “summer”. Since the northern hemisphere is where most of the world’s land, people and media are located, two typical summer months and a hot European August have been depicted as the fires of hell awaiting any and all who benefit from fossil fuels. If you were wondering what the media would do, apart from obsessing over the many small storms this year, you are getting the answer.
Fortunately, Autumn is on the way and already bringing cooler evenings in Montreal where I live. Once again open windows provide fresh air for sleeping, while mornings are showing condensation, and frost sometimes. This year’s period of “climate change” is winding down. Unless of course, we get some hurricanes the next two months. Below is a repost of seasonal changes in temperature and climate for those who may have been misled by the media reports of a forever hotter future.
[Note: The text below refers to human migratory behavior now resuming after being prohibited because, well, Coronavirus.]
Autumnal Climate Change
Seeing a lot more of this lately, along with hearing the geese honking. And in the next month or so, we expect that trees around here will lose their leaves. It definitely is climate change of the seasonal variety.
Interestingly, the science on this is settled: It is all due to reduction of solar energy because of the shorter length of days (LOD). The trees drop their leaves and go dormant because of less sunlight, not because of lower temperatures. The latter is an effect, not the cause.
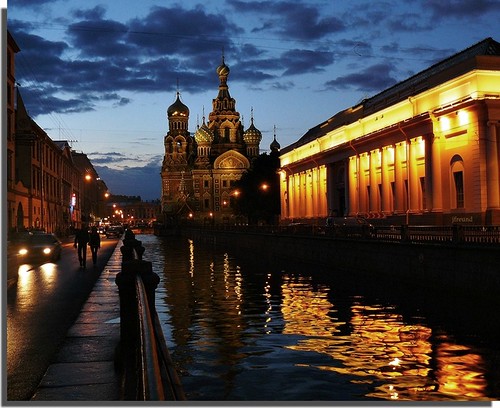
Of course, the farther north you go, the more remarkable the seasonal climate change. St. Petersburg, Russia has their balmy “White Nights” in June when twilight is as dark as it gets, followed by the cold, dark winter and a chance to see the Northern Lights.
And as we have been monitoring, the Arctic ice has been melting from sunlight in recent months, but is already building again in the twilight, to reach its maximum in March under the cover of darkness.
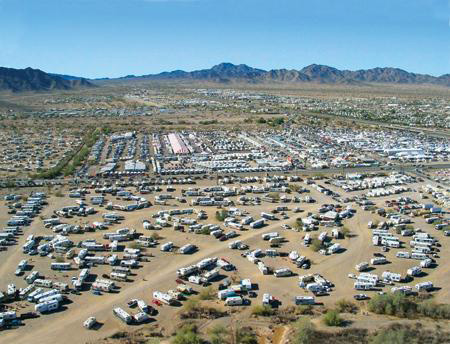
We can also expect in January and February for another migration of millions of Canadians (nicknamed “snowbirds”) to fly south in search of a summer-like climate to renew their memories and hopes. As was said to me by one man in Saskatchewan (part of the Canadian wheat breadbasket region): “Around here we have Triple-A farmers: April to August, and then Arizona.” Here’s what he was talking about: Quartzsite Arizona annually hosts 1.5M visitors, mostly between November and March.
Of course, this is just North America. Similar migrations occur in Europe, and in the Southern Hemisphere, the climates are changing in the opposite direction, Springtime currently. Since it is so obviously the sun causing this seasonal change, the question arises: Does the sunlight vary on longer than annual timescales?
The Solar-Climate Debate
And therein lies a great, enduring controversy between those (like the IPCC) who dismiss the sun as a driver of multi-Decadal climate change, and those who see a connection between solar cycles and Earth’s climate history. One side can be accused of ignoring the sun because of a prior commitment to CO2 as the climate “control knob”.
The other side is repeatedly denounced as “cyclomaniacs” in search of curve-fitting patterns to prove one or another thesis. It is also argued that a claim of 60-year cycles can not be validated with only 150 years or so of reliable data. That point has weight, but it is usually made by those on the CO2 bandwagon despite temperature and CO2 trends correlating for only 2 decades during the last century.
One scientist in this field is Nicola Scafetta, who presents the basic concept this way:
“The theory is very simple in words. The solar system is characterized by a set of specific gravitational oscillations due to the fact that the planets are moving around the sun. Everything in the solar system tends to synchronize to these frequencies beginning with the sun itself. The oscillating sun then causes equivalent cycles in the climate system. Also the moon acts on the climate system with its own harmonics. In conclusion we have a climate system that is mostly made of a set of complex cycles that mirror astronomical cycles. Consequently it is possible to use these harmonics to both approximately hindcast and forecast the harmonic component of the climate, at least on a global scale. This theory is supported by strong empirical evidences using the available solar and climatic data.”
He goes on to say:
“The global surface temperature record appears to be made of natural specific oscillations with a likely solar/astronomical origin plus a noncyclical anthropogenic contribution during the last decades. Indeed, because the boundary condition of the climate system is regulated also by astronomical harmonic forcings, the astronomical frequencies need to be part of the climate signal in the same way the tidal oscillations are regulated by soli-lunar harmonics.”
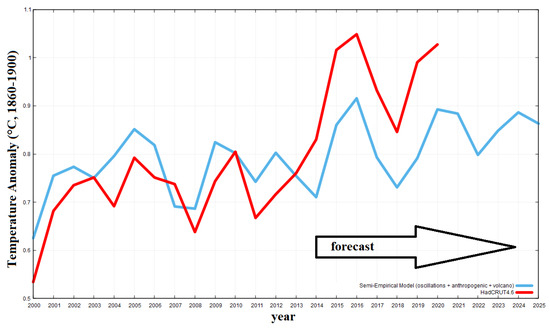
He has concluded that “at least 60% of the warming of the Earth observed since 1970 appears to be induced by natural cycles which are present in the solar system.” For the near future he predicts a stabilization of global temperature and cooling until 2030-2040.
A Deeper, but Accessible Presentation of Solar-Climate Theory
I have found this presentation by Ian Wilson to be persuasive while honestly considering all of the complexities involved.
The author raises the question: What if there is a third factor that not only drives the variations in solar activity that we see on the Sun but also drives the changes that we see in climate here on the Earth?
The linked article is quite readable by a general audience, and comes to a similar conclusion as Scafetta above: There is a connection, but it is not simple cause and effect. And yes, length of day (LOD) is a factor beyond the annual cycle.
It is fair to say that we are still at the theorizing stage of understanding a solar connection to earth’s climate. And at this stage, investigators look for correlations in the data and propose theories (explanations) for what mechanisms are at work. Interestingly, despite the lack of interest from the IPCC, solar and climate variability is a very active research field these days.
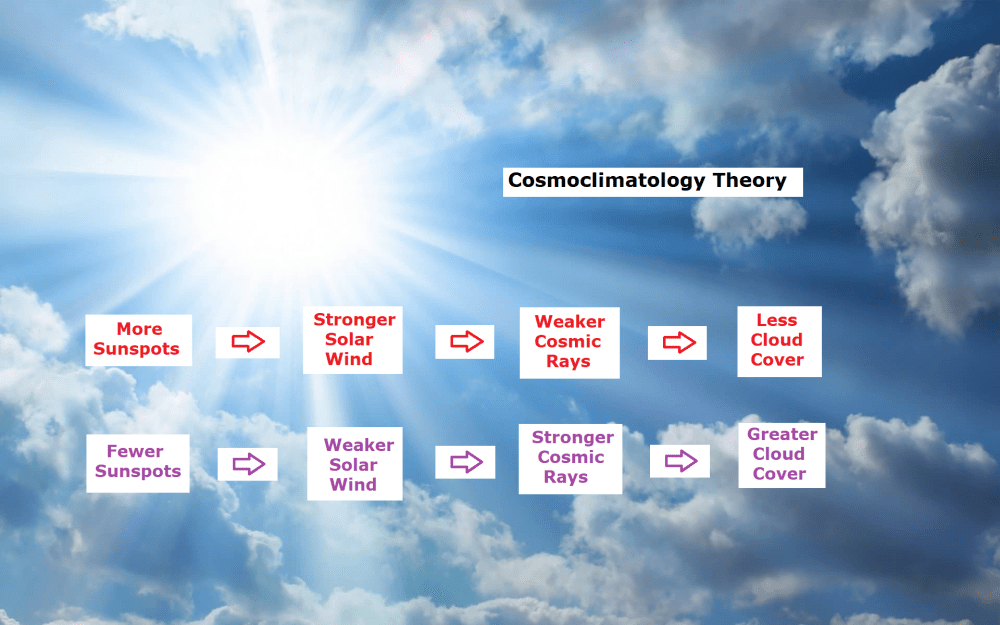
For example Svensmark has now a Cosmosclimatology theory supported by empirical studies described in more detail in the red link.
Once again, it appears that the world is more complicated than a simple cause and effect model suggests.
Fluctuations in observed global temperatures can be explained by a combination of oceanic and solar cycles. See engineering analysis from first principles Quantifying Natural Climate Change.
For everything there is a season, a time for every purpose under heaven.
What has been will be again, what has been done will be done again;
there is nothing new under the sun. (Ecclesiastes 3:1 and 1:9)
Black and white group photograph of immigrants posing for a photograph aboard the passenger ship Italia. Donato Sforza emigrated from Italy with his family in 1959 and are part of the group in this photograph. According to the archives at Pier 21 in Halifax, Nova Scotia the Italia stopped at the following ports: New York, Montreal, Quebec, Halifax-Plymouth, Havre, Southampton, Zeebrugge, Cuxhaven and Hamburg.
Like America, Canada is a nation comprised of people from around the world. And like America—perhaps even more than America—Canada is wearing racial blindfolds that make the government incapable of seeing that, just as “people of color” represent many different races, lands, and cultures, the same is true for “pale faced” people. This blindness erases Canada’s rich ethnic history.
As an anthropologist who spent 17 years living and working in Sub-Saharan Africa, where Black lives really matter and where everyone belongs to a tribe with which they identify, it pains me that I must explain to fellow Canadians (and Americans) that pale-faced people are not all the same. Are they just one thing — that is, one ethnic group in contrast to the myriad of “others”? No.
Canada’s government allows residents to choose from the following menu as a form of self-definition: White, South Asian, Chinese, Black, Filipino, Arab, Latin American, Southeast Asian, West Asian, Korean, Japanese, and First Nation. I found the most interesting category, “White.” No, there is no such thing as just “White.” Let us consider for a moment all those founding Canadian citizens—the “pale faces”—who were either born here or moved here from abroad.
The flag of the city of Montreal honors the founding races. It includes the French fleur de lis, the English rose, Irish shamrock and Scottish thistle. The Iroquois tree represents aboriginal people.
The first group of Canadian pale faces is the French-speaking citizens of Quebec and other parts of Canada whose ancestors came from France and settled here. They have a strong provincial government that protects and encourages their language, literature, music, poetry, film, scholarship, historical monuments, and all those other things that make a culture distinct.
The Quebecois, as they call themselves, are an ethnic group with a clear sense of who belongs and who does not belong. This week they elected a government that wants to limit immigration and protect the descendants of the founding population.
Then there are the descendants of the Protestant English and the Protestants of Northern Ireland, who founded the area of Upper Canada and conquered the Quebecois, allowing them to retain their culture and religion but insisting that England and things English be the beau ideal of the state.
They knew who was in and who was out. In Ontario, until WWII, there was little chance of a government job if you were not Protestant. British subjects hired British subjects and their children. They intermarried and kept apart from others. In slang, they are called WASPS, and their elites ran the country politically, economically, culturally, and religiously until the 1960s, with some elite Quebecois input.
Canada has many Celts: Irish Catholics, the fourth largest ethnic group in the country, who came from Catholic Ireland (the Republic), and the Catholic communities from Ulster. They are family-oriented, have a deep historic identity, and a culture of song, dance, and literature that they often justly feel may be better than the English speakers who call themselves English. Some of them still speak kinds of Gaelic.
Next come the Scots, lowland Protestants, highland Catholics, and later splinter groups like Presbyterians—but all of them feel Scottish and, similarly, there are the Welsh.
Image: People who look diverse – including those “White people,” by rawpixel.
Other pale faces have arrived since these founders. There are Central European pale faces, such as the Dutch, Belgians, Germans (who were once a majority in Kitchener, Ontario), Scandinavians and, of course, the non-conformist Protestant German-speaking Amish and Mennonite religious communities that have flourished here. The same region sent Czechs, Poles, Slovenians, Slovaks, Bulgarians, Serbs and Croats, Ukrainians, Russians, and other Slavs who have been here as Orthodox, Catholic, and Evangelicals for more than one hundred years.
Every one of these groups is ethnically distinct and has its own culture.
There are also the “second class” pale faces, such as Catholic Spaniards, Portuguese, Italians, and Orthodox Greeks, all Mediterranean peoples. Although Canada’s Anglo-Canadian-Celtic founders recognized them as some sort of second-order European, these same founders often felt that they just had too many swarthy members and, therefore, were second class. That’s why places used to have restrictive signs about Jews, Catholics, and Blacks.
And what about those Jews? Who are they? Sometimes they look German, Ukrainian, or Sicilian. Still, the constant is that other pale-faced Canadians have always treated them as second-class citizens who must “prove their loyalty.” Like the Jews, the Roma are treated as White, too, despite their Indian subcontinent origins.
Until long after WWII, most of these “pale face” groups were endogamous, and many still are, statistically speaking, meaning that they married, lived and, often, worked among each other and not members of other ethnic groups.
So why are all the pale faces, and almost pale faces,
these days lumped together as Whites on a government census?
This is very bad anthropology. It is not science-based. It is not empirical, and—God forbid! —it’s not evidence-based either. Also, remember that some pale-faced groups hate and persecute other pale-faced groups, a key aspect of many “ethnic boundaries.” Consider the war in Ukraine! This is just one example.
The madness of this census and its broken categories comes down to one thing: political correctness and Critical Race Theory, which, when taken together, must invent a category of “White” so proponents can blame everyone else’s suffering on this social construct. This ignores the fact that pale-faced ethnic groups are as diverse as people of color. If we were to take the CRT acronym of DIE (“diversity, inclusion and equity”) seriously, then these groups and the individuals who comprise them should be allowed to self-define.
Since we now live in a society that allows us to choose our pronouns, why can’t we choose our ethnicity as our fundamental defining feature, for it realistically includes things like neighborhoods, religious affiliation, and a way of looking at the world (not to mention good food)?
Should not, according to this twisted logic, the next government census reflect this multicultural truth? Can I again quote singer-songwriter Leonard Cohen (deceased member of one of Canada’s transnational minorities) because the truth is, “Everybody knows.”
These Canadian census categories are very bad anthropology. They are unbalanced, and they are used to reduce hiring in the private sector and the government by those who are naïve enough to check off their category as “White.” The newspapers here are full of examples, and the policies are not hidden. Affirmative action based upon these bogus anthropological categories is totally out of control in this once fine country.
Canada and Canadians are at their best when they reject the politicization of personal identity; when they abide by the shared traditions of Anglo-American law and the Judeo-Christian tradition; and above all, when they are judged by the quality of their character, not by the color of their skin or ethnic identity.
Canadians, like Americans, must reject the politicization of ethnic labels. Give the study of ethnicity back to the anthropologists, for that is where it came from. Let us once again become individuals, equal under the law.
Lyrics:
Everybody knows that the dice are loaded
Everybody rolls with their fingers crossed
Everybody knows that the war is over
Everybody knows the good guys lost
Everybody knows the fight was fixed
The poor stay poor, the rich get rich
That’s how it goes
Everybody knows
Everybody knows that the boat is leaking
Everybody knows that the captain lied
Everybody got this broken feeling
Like their father or their dog just died
Everybody talking to their pockets
Everybody wants a box of chocolates
And a long stem rose
Everybody knows
Everybody knows that you love me baby
Everybody knows that you really do
Everybody knows that you’ve been faithful
Ah give or take a night or two
Everybody knows you’ve been discreet
But there were so many people you just had to meet
Without your clothes
And everybody knows
Everybody knows, everybody knows
That’s how it goes
Everybody knows
And everybody knows that its now or never
Everybody knows that its me or you
And everybody knows that you live forever
Ah when you’ve done a line or two
Everybody knows the deal is rotten
Old black joe’s still pickin’ cotton
For your ribbons and bows
And everybody knows
And everybody knows that the plague is coming
Everybody knows that its moving fast
Everybody knows that the naked man and woman
Are just a shining artifact of the past
Everybody knows the scene is dead
But there’s gonna be a meter on your bed
That will disclose
What everybody knows
And everybody knows that you’re in trouble
Everybody knows what you’ve been through
From the bloody cross on top of calvary
To the beach of Malibu
Everybody knows its coming apart
Take one last look at this sacred heart
Before it blows
And everybody knows
Everybody knows, everybody knows
That’s how it goes
Everybody knows
Footnote:
I doubt Leonard Cohen had climate or social justice in mind when he wrote this masterpiece. But he did have a pertinent poetic insight; namely, that social proof is an unreliable guide to the truth.
 Stephen Moore writes at Washington Examiner Biden’s destroying the economy. Is it intentional? Excerpts in italics with my bolds and added images.