After a sub-par March maximum, 2026 Arctic ice in ensuing months closed the gap with the 20-year average. In August MASIE showed Arctic ice extent surplus to average. September Arctic ice added to the surplus and now during the annual minimum month of September 2026 there is Arctic ice aplenty at the day 260 average daily minimum.

During the annual dip in Arctic ice extent, the average year since 2006 is lowest on day 260 at 4.54M km2. It then rises to 4.8M km2 ten days later. The cyan line shows 2026 well above average throughout, its lowest extent at 4.74M km2 on day 257 and now up to 4.85M km2. SII v.4 was lower than MASIE throughout, but drew closer in recent days before ending 219k km2 in deficit. So far MASIE September average is 4.97M and SII is 4.64M, with 13 more days remaining in the month. Note 2007 was ~600k km2 in deficit to average at day 270, while last year was matching this one.
The regional distribution of ice extents is shown in the table below. (Bering and Okhotsk seas are excluded since both are now virtually open water.)
| Region | 2026260 | Day 260 ave. | 2026-Ave. | 2007260 | 2026-2007 |
| (0) Northern_Hemisphere | 4852660 | 4544944 | 307716 | 4045776 | 806884 |
| (1) Beaufort_Sea | 550955 | 480711 | 70244 | 481384 | 69571 |
| (2) Chukchi_Sea | 320625 | 183714 | 136911 | 22527 | 298099 |
| (3) East_Siberian_Sea | 268872 | 267297 | 1575 | 311 | 268561 |
| (4) Laptev_Sea | 208038 | 141784 | 66254 | 235869 | -27831 |
| (5) Kara_Sea | 18 | 28526 | -28508 | 44067 | -44049 |
| (6) Barents_Sea | 0 | 13149 | -13149 | 7420 | -7420 |
| (7) Greenland_Sea | 217002 | 185684 | 31318 | 333181 | -116179 |
| (8) Baffin_Bay_Gulf_of_St._Lawrence | 51076 | 32165 | 18910 | 26703 | 24373 |
| (9) Canadian_Archipelago | 321919 | 273658 | 48261 | 225526 | 96393 |
| (10) Hudson_Bay | 16 | 4458 | -4442 | 2270 | -2254 |
| (11) Central_Arctic | 2912997 | 2932816 | -19819 | 2665244 | 247753 |
The table shows large surpluses in Eurasian basins Laptev, Chukchi and Beaufort, more than offsetting smaller deficits in Central Arctic, Kara and Barents seas. Hudson Bay is mostly open water at this time of year. 2026 exceeds the average ice extents by 308k km2, or 7%, and is nearly a wadham greater than 2007 with a surplus of 0.808M km2 of ice extent.
September monthly average ice extent is considered the annual minimum for climate purposes. Note also that typically the lowest daily value occurs mid September, with a small positive gain between the end of August and end of September.

Why is this important? All the claims of global climate emergency depend on dangerously higher temperatures, lower sea ice, and rising sea levels. The lack of additional warming prior to 2023 El Nino is documented in a post SH Drives UAH Temps Cooler July 2025.

The lack of acceleration in sea levels along coastlines has been discussed also. See Observed vs. Imagined Sea Levels 2023 Update
Also, a longer term perspective is informative:

Footnote Regarding SII v.4
NSDIC acknowledged my query regarding the SII (Sea Ice Index) dataset. While awaiting an explanation I investigated further. My last download of the SII Daily Arctic Ice Extents was on July 30, meaning that the most recent data in that file was day 210, July 29. The header on that file was Sea_Ice_Index_Daily_Extent_G02135_v3.
Then on August 1, the downloaded file had the heading Sea_Ice_Index_Daily_Extent_G02135_v4. So it appears that these are now the values from a new version of SII. As I wrote in my query, since March 14 all of the values for Arctic Ice Extents are lower in this new record. The graph above shows the implications for August as an example of estimates from SIIv.4.
In the past, SIIv.3 tracked MASIE with slightly lower values. But with v.4, larger monthly average deficits to MASIE were reported in July 2025 ( -282k km2) and in August (-440k km2).
The change started in January 2025 and will be the basis for future reporting. The logic for this is presented in this document: Sea Ice Index Version 4 Analysis
In June 2025, NSIDC was informed that access to data from the Special Sensor Microwave
Imager/Sounder (SSMIS) onboard the Defense Meteorological Satellite Program (DMSP)
satellites would end on July 31 (NSIDC, 2025). To prepare for this, we rapidly developed version
4 of the Sea Ice Index. This new version transitions from using sea ice concentration fields
derived from SSMIS data as input to using fields derived from the Advanced Microwave
Scanning Radiometer 2 (AMSR2) sensor onboard the Global Change Observation Mission – W1
(GCOM-W1) satellite. On 29 July 2025, we learned that the Defense Department decision to terminate access to DMSP data had been reversed and that data will continue to be available until September 2026.
We are publishing Version 4, however, for these reasons:
• The SSMIS instruments are well past their designed lifespan and a transition to
AMSR2 is inevitable. Unless the sensors fail earlier, the DoD will formally end the
program in September 2026.
• Although access of SSMIS will continue through September 2026, the Fleet
Numerical Meteorology and Oceanography Center (FNMOC), where SSMIS data
from the DMSP satellite are downloaded, made an announcement that “Support
will be on a best effort basis and should be considered data of opportunity.” This
means that SSMIS data will likely contain data gaps.
• We have developer time to make this transition now and may not in the future.
• We are confident that Version 4 data are commensurate in accuracy to those
provided by Version 3.

If you started a graph at 2007 ( decent cherry pick when laid out against the doom predictions) would the general trend be up for the past 19 years?
David, thanks for the question. I do such graphs but not for a single day, like the daily minimum, which is quite variable from year to year despite the average being day 260. September monthly average ice extent is regarded as a climate metric for annual minimums. Here is that result:
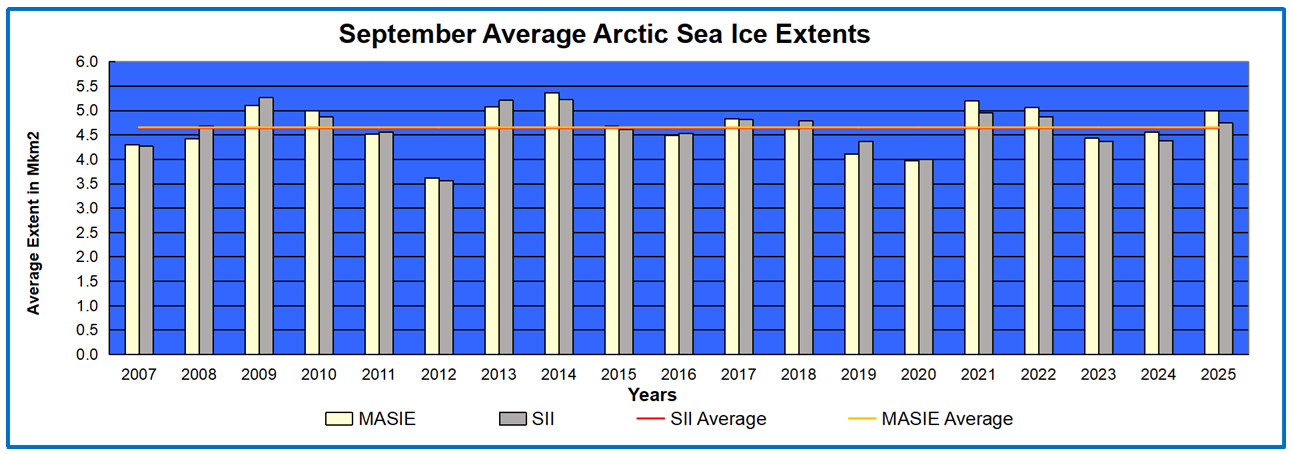
A trendline would be slightly upward, but really it is more like a plateau.
Thank you, very cool. So despite all the gloom and doom, no real trend for almost 20 years.