Raman Effect Not a Climate Factor

When the Raman effect came up last year in relation to GHGs (Greenhouse Gases), I was firstly confused thinking it was talk of asian noodles.  So I have had to learn more, and while the effect is real and useful, I doubt it is a factor concerning global warming/climate change.  This post provides information principally from two sources consistent with many others I read.

One article is Raman Spectroscopy from University of Pennsylvania.  Excerpts in italics with my bolds.

Raman Effect

Raman spectroscopy is often considered to be complementary to IR spectroscopy. For symmetrical molecules with a center of inversion, Raman and IR are mutually exclusive. In other words, bonds that are IR-active will not be Raman-active and vice versa. Other molecules may have bonds that are either Raman-active, IR-active, neither or both.

Raman spectroscopy measures the scattering of light by matter. The light source used in Raman spectroscopy is a laser.

The laser light is used because it is a very intense beam of nearly monochromatic light that can interact with sample molecules. When matter absorbs light, the internal energy of the matter is changed in some way. Since this site is focused on the complementary nature of IR and Raman, the infrared region will be discussed. Infrared radiation causes molecules to undergo changes in their vibrational and rotational motion. When the radiation is absorbed, a molecule jumps to a higher vibrational or rotational energy level. When the molecule relaxes back to a lower energy level, radiation is emitted. Most often the emitted radiation is of the same frequency as the incident light. Since the radiation was absorbed and then emitted, it will likely travel in a different direction from which it came. This is called Rayleigh scattering. Sometimes, however, the scattered (emitted) light is of a slightly different frequency than the incident light. This effect was first noted by Chandrasekhara Venkata Raman who won the Nobel Prize for this discovery. (6) The effect, named for its discoverer, is called the Raman effect, or Raman scattering.

Raman scattering occurs in two ways. If the emitted radiation is of lower frequency than the incident radiation, then it is called Stokes scattering. If it is of higher frequency, then it is called anti-Stokes scattering.

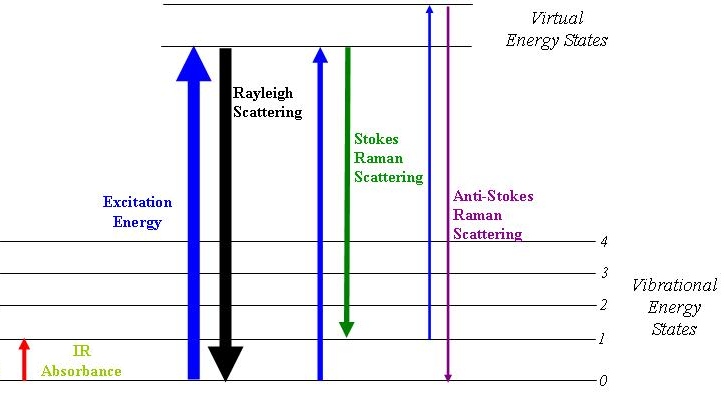
Energy Diagram Scattering (Source: Wikipedia)

The Blue arrow in the picture to the left represents the incident radiation. The Stokes scattered light has a frequency lower than that of the original light because the molecule did not relax all the way back to the original ground state. The anti-Stokes scattered light has a higher frequency than the original because it started in an excited energy level but relaxed back to the ground state.

Though any Raman scattering is very low in intensity, the Stokes scattered radiation is more intense than the anti-Stokes scattered radiation.

The reason for this is that very few molecules would exist in the excited level as compared to the ground state before the absorption of radiation. The diagram shown represents electronic energy levels as shown by the labels “n=”. The same phenomenon, however, applies to radiation in any of the regions.

Another article is Raman Techniques: Fundamentals and Frontiers by Robin R. Jones et al. at 2019 at US National Library of Medicine.

Abstract

Driven by applications in chemical sensing, biological imaging and material characterisation, Raman spectroscopies are attracting growing interest from a variety of scientific disciplines. The Raman effect originates from the inelastic scattering of light, and it can directly probe vibration/rotational-vibration states in molecules and materials.

Despite numerous advantages over infrared spectroscopy, spontaneous Raman scattering is very weak, and consequently, a variety of enhanced Raman spectroscopic techniques have emerged.

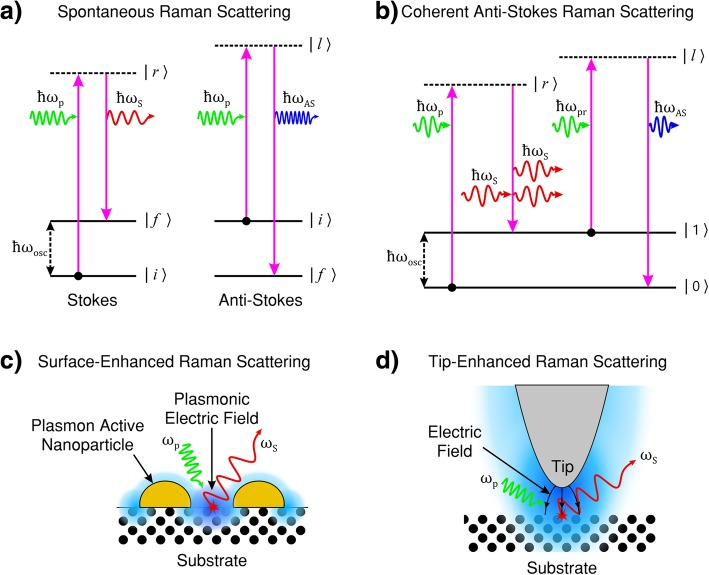
These techniques include stimulated Raman scattering and coherent anti-Stokes Raman scattering, as well as surface- and tip-enhanced Raman scattering spectroscopies. The present review provides the reader with an understanding of the fundamental physics that govern the Raman effect and its advantages, limitations and applications. The review also highlights the key experimental considerations for implementing the main experimental Raman spectroscopic techniques. The relevant data analysis methods and some of the most recent advances related to the Raman effect are finally presented. This review constitutes a practical introduction to the science of Raman spectroscopy; it also highlights recent and promising directions of future research developments.

Fundamental Principles

When light interacts with matter, the oscillatory electro-magnetic (EM) field of the light perturbs the charge distribution in the matter which can lead to the exchange of energy and momentum leaving the matter in a modified state. Examples include electronic excitations and molecular vibrations or rotational-vibrations (ro-vibrations) in liquids and gases, electronic excitations and optical phonons in solids, and electron-plasma oscillations in plasmas [108].

Spontaneous Raman

When an incident photon interacts with a crystal lattice or molecule, it can be scattered either elastically or inelastically. Predominantly, light is elastically scattered (i.e. the energy of the scattered photon is equal to that of the incident photon). This type of scattering is often referred to as Rayleigh scattering. The inelastic scattering of light by matter (i.e. the energy of the scattered photon is not equal to that of the incident photon) is known as the Raman effect [1, 4, 6]. This inelastic process leaves the molecule in a modified (ro-)vibrational state

In the case of spontaneous Raman scattering, the Raman effect is very weak; typically, 1 in 10^8 of the incident radiation undergoes spontaneous Raman scattering [6].

The transition from the virtual excited state to the final state can occur at any point in time and to any possible final state based on probability. Hence, spontaneous Raman scattering is an incoherent process. The output signal power is proportional to the input power, scattered in random directions and is dependent on the orientation of the polarisation. For example, in a system of gaseous molecules, the molecular orientation relative to the incident light is random and hence their polarisation wave vector will also be random. Furthermore, as the excited state has a finite lifetime, there is an associated uncertainty in the transition energy which leads to natural line broadening of the wavelength as per the Heisenberg uncertainty principle (∆E∆t ≥ ℏ/2) [1]. The scattered light, in general, has polarisation properties that differ from that of the incident radiation. Furthermore, the intensity and polarisation are dependent on the direction from which the light is measured [1]. The scattered spectrum exhibits peaks at all Raman active modes; the relative strength of the spectral peaks are determined by the scattering cross-section of each Raman mode [108]. Photons can undergo successive Rayleigh scattering events before Raman scattering occurs as Raman scattering is far less probable than Rayleigh scattering.

Laser Empowered Raman Scattering

Coherent light-scattering events involving multiple incident photons simultaneously interacting with the scattering material was not observed until laser sources became available in the 1960s, despite predictions being made as early as the 1930s [37, 38]. The first laser-based Raman scattering experiment was demonstrated in 1961 [39]. Stimulated Raman scattering (SRS) and CARS have become prominent four-wave mixing techniques and are of interest in this review.

SRS is a coherent process providing much stronger signals relative to spontaneous Raman spectroscopy as well as the ability to time-resolve the vibrational motions.

Raman is generally a very weak process; it is estimated that approximately one in every 10^8 photons undergo Raman scattering spontaneously [6]. This inherent weakness poses a limitation on the intensity of the obtainable Raman signal. Various methods can be used to increase the Raman throughput of an experiment, such as increasing the incident laser power and using microscope objectives to tightly focus the laser beam into small areas. However, this can have negative consequences such as sample photobleaching [139]. Placing the analyte on a rough metal surface can provide orders of magnitude enhancement of the measured Raman signal, i.e. SERS.

Summary

It seems to me that spontaneous scattering is the only possible way that the Raman effect could influence the radiative profile of the atmosphere.  Sources like those above convince me that lacking laser intensity, natural light does not produce a Raman effect in the air of any significance for it to be considered a climate factor.

Media Playbook: Matching Trump and Climate Hysteria

Erielle Davidson writing about latest media Trump hysteria reveals the parallels with climate reporting. Her article at the Federalist is The Media Is Always, Always Wrong About Trump And National Security. Excerpts in italics with my bolds.

The level of breathless misinformation and disinformation spread after Iranian Gen. Qassem Soleimani’s killing by the individuals we rely on supposedly to report facts and offer analysis in a responsible and undramatized manner was stunning. But this isn’t their first rodeo.

No, such grossly hyperbolic reporting for the sake of convincing people that Trump may have created an epically destructive policy quagmire has become the new calling card of the media. The media has shown that they cannot eviscerate Trump with factual, state-of-affairs reporting because those affairs are never quite dire enough for the media.

Similarly, for the sake of avoiding flat-out lying entirely (although it is entertaining to watch the “mistakes” go in one direction), the media is forced to cabin their criticism in fantastic projections.

Trump almost started World War III. Trump almost catalyzed the entire destruction of the Kurds. Trump almost started war with North Korea. Trump almost started a full-blown war between the Palestinian-Arabs and the Israelis. Trump almost devastated the economy by slapping tariffs on Chinese goods. See how much heavy-lifting the word “almost” is doing? It’s utterly bizarre, because these predictions never happen.

The word’s subjunctive quality has become a shield for the media as they predict wild policy outcomes that have no grounding in the facts. When President Trump moved the U.S. embassy to Jerusalem, we were essentially promised insurmountable bloodshed and the irrevocable destruction of any hope at peace in the region. Thankfully, we got neither. But that didn’t stop reporters from sheepishly convincing themselves that, although their prediction never achieved fruition, it still could have happened.

That is the same dance being rehearsed now on Iran. Our firefighting media know the steps so well. The beauty of almost – and its ugly step-child could have – is that these reporters never have to be right for something to be almost true.

By all accounts, President Trump’s performance vis-à-vis Iran was stunningly effective at reestablishing the policy of deterrence (rather than appeasement) in the region. However, media reporting as of late has made it abundantly clear that wild projections of what could have been will continue to far eclipse what actually was. And the only people who suffer from such bombastic “analysis” are those who are forced to rely on it, given most people’s understandably limited knowledge of Middle Eastern geopolitics.

There’s a gross irresponsibility in such “reporting” and signals the ever-growing credibility crisis of the American media. Contrary to what Time magazine published (and delivered as a push notification), there is absolutely no reason you need to “discuss” Iran with your children. The hysteria is based on lies those in the media continue to recite to themselves and are dangerously projecting upon the greater population.

No, perhaps it’s time to “discuss” Iran with our media betters instead of children, if only not to be dragged along through their hysterical meltdowns. Indeed, we would be spared the ahistorical and insufferable nonsense. At least until the next manufactured apocalypse.

Light Bulbs Disprove Global Warming

Dr. Peter Ward explains at The Hill Greenhouse gases simply do not absorb enough heat to warm Earth Excerpts in italics with my bolds.

Science is not done by consensus, by popular vote, or by group think. As Michael Crichton put it: “In science consensus is irrelevant. What is relevant is reproducible results. The greatest scientists in history are great precisely because they broke with the consensus.”

The drive to demonstrate scientific consensus over greenhouse-warming theory has had the unintended consequence of inhibiting genuine scientific debate about the ultimate cause of global warming.

Believers of “the consensus” argue that anyone not agreeing with them is uninformed, an idiot or being paid by nefarious companies. The last thing most climate scientists want to consider at this point, when they think they are finally winning the climate wars, is the possibility of some problem with the science of greenhouse-warming theory. Believe me, I have tried for several years to communicate the problem to numerous leading climate scientists.

New data and improved understanding now show that there is a fatal flaw in greenhouse-warming theory. Simply put: greenhouse gases do not absorb enough of the heat radiated by Earth to cause global warming.

Understanding this very surprising and rather blunt statement is much easier than you might think. It gets down to understanding why a traditional light bulb gives off a great deal of heat whereas a new LED light bulb producing the same amount of light remains quite cool.

Heat is what makes us feel warm. More formally, heat is thermal energy flowing spontaneously from a warmer body to a cooler body. Thermal energy is well observed at the molecular level to be the oscillation of all the bonds that hold matter together. The hotter the body of matter, the higher the frequencies of oscillation and the higher the amplitudes of oscillation at each frequency of oscillation. In this way, heat and the temperature that results from absorbing heat both consist of a very broad spectrum of all of these frequencies of oscillation.

A traditional light bulb uses a large amount of electricity to heat the tungsten filament to temperatures around 5500 degrees, causing the filament to glow white hot. This high temperature is required to produce visible white light. The glowing filament gives off a very broad spectrum of frequencies of radiation, however, that we perceive as heat. Only a very small number of the highest of these frequencies are useful as visible light.

A new LED light bulb, on the other hand, uses a very small amount of electricity to cause a diode to emit a very narrow range of frequencies within the spectrum of visible light. The LED radiates only visible light — it does not radiate heat.

If you look at the LED with an infrared camera, you can see just where it gets hot. The hottest part is the base of the bulb where there is an AC to DC converter which is the primary source of heat for this bulb. For the incandescent bulbs, the hottest part is the top of the bulb.

The primary purpose of a light bulb is to provide visible light. To repeat, a traditional light bulb radiates heat, a small portion of which is visible light. An LED on the other hand, only radiates visible light, requiring much less electricity. This is why you can substantially reduce your electric bills by replacing traditional incandescent light bulbs with LED light bulbs.

How does this apply to greenhouse gases?

Detailed laboratory studies of absorption of radiation show that carbon dioxide absorbs less than 16 percent of all the frequencies making up the heat radiated by Earth. Just like LEDs, this limited number of frequencies absorbed by carbon dioxide does not constitute heat. This limited number of frequencies cannot cause an absorbing body of matter to get much hotter because it contains only a very small part of the heat required to do so.

Current radiation theory and current climate models assume that all radiation is created equal—that all radiation is the same no matter the temperature of the radiating body. Current theory simply assumes that what changes is the amount of such generic radiation measured in watts per square meter.

Extensive observations of radiation emitted by matter at different temperatures, however, show us clearly that the physical properties of radiation, the frequencies and amplitudes of oscillation making up radiation, increase in value rapidly with increasing temperature of the radiating body.

Climate scientists argue that the thermal energy absorbed by greenhouse gases is re-radiated, causing warming of air, slowing cooling of Earth and even directly warming Earth.

There simply is not enough heat involved in any of these proposed processes to have any significant effect on global warming. Greenhouse-warming theory “just ain’t so.”

Peter L. Ward worked 27 years with the United States Geological Survey. He was the chairman of the White House Working Group on Natural Disaster Information Systems during the Clinton administration. He’s published more than 50 scientific papers. He retired in 1998 but continues working to resolve several enigmatic observations related to climate change. His work is described in detail at WhyClimateChanges.com and in his book What Really Causes Global Warming? Greenhouse gases or ozone depletion? Follow him on Twitter at @yclimatechanges.

Comment:

The above article is an opinion piece that does not go deeply into the scientific case underlying the conclusions.  That analysis can be read at Ward’s paper Why greenhouse-warming theory is physically impossible

Overview

Thus greenhouse-warming theory is based on the assumption that (1) radiative energy can be quantified by a single number of watts per square meter, (2) the assumption that these radiative forcings can be added together, and (3) the assumption that Earth’s surface temperature is proportional to the sum of all of these radiative forcings. A fundamentally new understanding of the physics of thermal energy and the physics of heat, described below, shows that all three assumptions are mistaken. There are other serious problems: (4) greenhouse gases absorb only a small part of the radiation emitted by Earth, (5) they can only reradiate what they absorb, (6) they do not reradiate in every direction as assumed, (7) they make up only a tiny part of the gases in the atmosphere, and (8) they have been shown by experiment not to cause significant warming. (9) The thermal effects of radiation are not about amount of radiation absorbed, as currently assumed, they are about the temperature of the emitting body and the difference in temperature between the emitting and the absorbing bodies as described below.

plancks-law-freq-linearplus-1024x576-1

Thermal radiation from Earth, at a temperature of 15 °C, consists of the narrow continuum of frequencies of oscillation shown in green in this plot of Planck’s empirical law. Thermal radiation from the tungsten filament of an incandescent light bulb at 3000 °C consists of a broader continuum of frequencies shown in yellow and green. Thermal radiation from Sun at 5500 °C consists of a much broader continuum of frequencies shown in red, yellow and green.

Note in this plot of Planck’s empirical law that the higher the temperature, 1) the broader the continuum of frequencies, 2) the higher the amplitude of oscillation at each and every frequency, and 3) the higher the frequencies of oscillation that are oscillating with the largest amplitudes of oscillation. Radiation from Sun shown in red, yellow, and green clearly contains much higher frequencies and amplitudes of oscillation than radiation from Earth shown in green. Planck’s empirical law shows unequivocally that the physical properties of radiation are a function of the temperature of the body emitting the radiation.

Ångström (1900) showed that “no more than about 16 percent of earth’s radiation can be absorbed by atmospheric carbon dioxide, and secondly, that the total absorption is very little dependent on the changes in the atmospheric carbon dioxide content, as long as it is not smaller than 0.2 of the existing value.” Extensive modern data agree that carbon dioxide absorbs less than 16% of the frequencies emitted by Earth shown by the vertical black lines of this plot of Planck’s empirical law where frequencies are plotted on a logarithmic x-axis. These vertical black lines show frequencies and relative amplitudes only. Their absolute amplitudes on this plot are arbitrary.

Temperature at Earth’s surface is the result of the broad continuum of oscillations shown in green. Absorbing less than 16% of the frequencies emitted by Earth cannot have much effect on the temperature of anything.

Update January 17, 2020

Dr. Ward’s journey of discovery is provided here: CO2, SO2, O3: A journey of Discovery

EPA Overhaul Long Overdue

Prudent public officials should anticipate that some future periods will be warmer and other periods cooler than today. They should also affirm that cold is the greater threat to human health and prosperity. Thus investments should place priority on building robust infrastructure and ensuring reliable affordable energy. These things can not be achieved if the planning and approval process is so long and costly that needed developments are discouraged or abandoned.

The worst kept secret in US politics is how effectively environmental activists and lawyers have used EPA regulations to block, impair and frequently kill off projects for energy infrastructure. Some regions like the Northeast are lacking natural gas supply pipelines from US sources and are forced to import from Russia, among other foreign producers. Former EPA administrator made the point that some people believe that if you are for the environment you are against development, and if you are for development you are against the environment. Instead the law and the agency have the mission of ensuring environmentally responsible development, recognizing that natural resources are essential to human flourishing.

Thus I welcome this announcement reported in the Wall Street Journal Trump Seeks Overhaul of Federal Environmental Rules  Of course the subtitle say: Environmentalists criticize proposal, saying it will hamper efforts to slow climate change.  Excerpts in italics with my bolds.

WASHINGTON—President Trump proposed a major overhaul of federal environmental permitting, responding to business complaints of bureaucratic delays to infrastructure projects such as roads and energy pipelines.

“We want to build new roads, bridges and highways bigger and faster,” Mr. Trump said from the White House, adding that the proposal would help create new jobs.

But environmentalists assailed the changes to rules tied to the National Environmental Policy Act, or NEPA, saying they would weaken standards at a time when climate change is making federal review even more critical.

“Forcing federal agencies to ignore environmental threats is a disgraceful abdication of our responsibility to protect the planet for future generations,” Brett Hartl, government affairs director at the Center for Biological Diversity, said this week anticipating the overhaul. He called it a “gift to the fossil-fuel industry.”  The administration sees the move as a broad-based effort to modernize rules that have gone largely untouched for more than 40 years.

The primary aim is to shorten the review process to two years—a drastic change given that assessments can now take a decade or more.

“The step we’re taking today…will hit a home run in delivering better results to the American people by cutting red tape that has paralyzed common-sense decision-making for a generation,” Interior Secretary David Bernhardt said on a call with reporters. “The consequences of the government being stuck in place are far-ranging.”

Some projects that don’t have significant federal government funding or involvement might now become more likely to skirt the process altogether, a change likely aimed at helping pipelines in particular. For projects that do have to go through the NEPA review process, the changes would clarify what environmental effects agencies have to plan for and what future changes to the environment permit reviews will have to consider in advance. The stated goal is to limit reviews to environmental risks more directly associated with a project.

Critics fear that is a major setback for planning around climate change. Administration officials say agencies would still have the option to include climate-change risks in their permitting processes. But infrastructure experts and environmentalists say any weakening in that connection would be a step in the wrong direction as the effects of climate change are becoming more pronounced and society needs stronger rules to adapt to those emerging risks.

Issuing this proposal is an early step in what could be a lengthy process. There will be at least two months of public comment starting when the proposal is published on Friday, administration officials said. Many more months of review will likely follow that before any changes are finalized.

Many expect the administration won’t have enough time to finish an overhaul if Mr. Trump isn’t re-elected in November. Rep. Raúl Grijalva (D., Ariz.), chairman of the House Natural Resources Committee, on Thursday called the rewrite illegal, potentially foreshadowing several lawsuits that could further delay an overhaul.

The president on several occasions has criticized the environmental permitting process as a bureaucratic barrier to economic development. Many lawmakers and economists say that America needs to fix a backlog of infrastructure needs, which the administration has pegged at roughly $1 trillion.

In recent months, the administration has turned its attention to addressing several bedrock environmental laws and changes aimed at jump-start development. A plan to overhaul NEPA would be the latest in a series of moves that have also tried to limit the reach of the Endangered Species Act and Clean Water Act, especially in how much those laws require consideration of risks associated with climate change. The NEPA review process can serve as the ultimate fail-safe on environmentally unsound projects.

But energy companies and manufacturers in particular have argued that NEPA, in recent decades, has become a tool for environmentalists to block progress. Since its last update, major roads and pipeline projects have become harder to complete and a drilling boom has led to an expansion of oil-and-gas production nationwide. Industrial interests have asked for a modernization to improve efficiency and consistency in permitting across federal agencies.

“The administration’s modernization of NEPA removes bureaucratic barriers that were stifling construction of key infrastructure projects needed for U.S. producers to deliver energy in a safe and environmentally protective way,” said Anne Bradbury, chief executive of the American Exploration & Production Council, a trade group for some of the country’s largest independent oil-and-gas companies.

Environmental groups have been concerned that an attempt to streamline NEPA permitting would degrade its ability to protect the environment. They have criticized the Environmental Protection Agency’s 2018 decision to eliminate letter grades that often came as guidance in the process. Such changes can make NEPA reviews less helpful to the public and weaken a process designed to prevent oil spills and other environmental accidents, environmentalists said.

Footnote:  

Convoluted and CO2 obsessive regulations are a large factor leading to the Australian bushfires.  Also, Canada is unable to build a badly needed pipeline expansion that the federal government wants and owns because of the same kind of onerous environmental permitting processes.

Turtles Vs. Trump

Apologies for the image; I couldn’t find one with turtles wearing lawyers suits.  Again it is ambulance chasers with legal training targeting deep pockets, as explained in USA Today article Trump administration sued for failing to protect green sea turtles from climate change.  Excerpts on this latest example of climate derangement syndrome are in italics with my bolds.

Several environmental groups filed a lawsuit Wednesday claiming several agencies in the Trump administration have failed to protect green sea turtle habitat as required by the Endangered Species Act.

The lawsuit, filed in U.S. District Court for the District of Columbia, says the turtles’ nesting beaches in Florida, Georgia, North Carolina and South Carolina, as well as their ocean habitat, face threats from sea level rise brought on by climate change and plastic pollution, according to a news release from the Center for Biological Diversity, one of the plaintiffs.

Other plaintiffs are the Sea Turtle Oversight Protection and the Turtle Island Restoration Network. The lawsuit asks the court to rule that several federal agencies are in violation of the Endangered Species Act and order them to designate sites – unspecified as yet –as critical habitat for the turtles.

Defendants include:

Interior Department Secretary David Bernhardt
Commerce Secretary Wilbur Ross
Margaret Everson, principal deputy director of the U.S. Fish & Wildlife Service
Chris Oliver, assistant administrator for fisheries at the National Oceanic Atmospheric Administration
National Marine Fisheries Service
A UPS driver started posting dog pictures in 2013:It’s now a viral sensation with 1.6M likes

Climate change, sea level rise
The lawsuit acknowledges that green sea turtle populations have been on a general increase over the last few years, but notes the National Marine Fisheries Service and Fish & Wildlife Service found in 2016 that threats from climate change and sea level rise mean the turtles still need protection under the Endangered Species Act.

The act prohibits federal agencies from authorizing activities that will destroy or harm a listed species’ critical habitat.

Floridians should be proud of how far we’ve come with green sea turtle recovery, but the fight’s not over yet,” said Jaclyn Lopez, Florida director at the Center for Biological Diversity. “Now the feds have to step up and ensure that sea turtles have safe passage to nest on our beaches. These imperiled animals can’t afford any more delays.”

Green turtle populations around the world are listed as either endangered or threatened under the Endangered Species Act.


A 144-pound sea turtle was rescued by Indian River County police after being struck by a boat.

Here’s Looking at You, CO2

Raymond of RiC-Communications studio collaborated with me and content experts in order to produce high quality infographics on CO2 for improving public awareness.  This post presents the thirteen charts he has produced on this topic. I find them straightforward and useful, and appreciate his excellent work on this. Project title is link to RiC-Communications.  Thanks again to Raymond for recovering access to his work after reorganizing his website.

This project is: The world of CO2

Infographics can be helpful, in making things simple to understand. CO2 is a complex topic with a lot of information and statistics. These simple step by step charts should help to give you an idea of CO2’s importance. Without CO2, plants wouldn’t be able to live on this planet. Just remember, that if CO2 falls below 150 ppm, all plant life would cease to exist.

– N° 1 Earth‘s atmospheric composition
– N° 2 Natural sources of CO2 emissions
– N° 3 Global anthropogenic CO2 emissions
– N° 4 CO2 – Carbon dioxide molecule
– N° 5 The global carbon cycle
– N° 6 Carbon and plant respiration
– N° 7 Plant categories and abundance (C3, C4 & CAM Plants)
– N° 8 Photosynthesis, the C3 vs C4 gap
– N° 9 Plant respiration and CO2
– N° 10 The logarithmic temperature rise of higher CO2 levels.
N° 11 Earths atmospheric composition in relationship to CO2
– N° 12 Human respiration and CO2 concentrations.
– N° 13 600 million years of temperature change and atmospheric CO2

WCO2 fig1

WCO2 fig2

WCO2 fig3

WCO2 fig4

WCO2 fig5

WCO2 fig6

WCO2 fig7

WCO2 fig8

WCO2 fig9

WCO2 fig10

WCO2 fig11

WCO2 fig12

WCO2 fig13

CO2 plays an important roll for the survival of our planet. Carbon Dioxide is essential for plant photosynthesis and rise of CO2 can be directly linked to the greening of the plant. At the moment climate change and global warming are being presented as a global threat to our species.

According to environmentalists, sea levels and temperatures will rise, resulting in a global breakdown for human civilization. This is based on climate models and numerous environmental studies around the world. According to the IPCC our carbon footprint needs to be reduced. The use of natural gas, oil, coal and any other fossil fuels need to be reduced to zero. The anthropogenic (man-made) influence has to be eliminated to save the planet.

According to some climate models, the planets temperature will increase to a level that will cause drought and famine for a large portion of the population in the very near future. In the future our energy needs will have to be cut so much so that all travel will need to be cut back completely.

In the future only environment friendly approved energy resources will be permitted such as, wind energy, solar energy, geothermal, biomass and hydroelectric as clean alternatives. This would deprive developing nations the possibility of building an economy and developed nations of keeping their economies.

And in Addition

Note that the illustration #10 assumes (as is the “consensus”) that doubling atmospheric CO2 produces a 1C rise in GMT (Global Mean Temperature).  Even if true, the warming would be gentle and not cataclysmic.  Greta and XR are foolishly thinking the world goes over a cliff if CO2 hits 430ppm.  I start to wonder if Greta really can see CO2 as she claims.

It is also important to know that natural CO2 sources and sinks are estimated with large error ranges.  For example this table from earlier IPCC reports:


Since the Statue of Liberty features in the sea level graphic, here are observations from there

NYC past & projected 2020

Below are some other images I find meaningful, though they lack Raymond’s high production values.

Dipole Down Under

Vijay Jayaraj explains how weather is created around the Indian Ocean in this article Record Heat and Cold Expose Climate Alarmists’ Bias. Excerpts in italics with my bolds and images.

Australia was literally on fire in December. Record heat made headlines in global media. So did the extreme rainfall in east Africa.

You and everybody else on earth can guess what climate alarmists blamed for both: man-made global warming, a.k.a. climate change.

But record cold in northern India at the same time didn’t make headlines in any major media in the United States or the United Kingdom.

Why? Because it didn’t fit expectations.

It’s a perfect example of climate alarmists’ obvious bias that’s seldom brought to light.

In December, east Africa received extremely heavy rainfall, causing widespread floods in Kenya and Djibouti. The floods impacted more than one million people and killed scores already challenged by extreme poverty.

During the same month, Australia recorded all-time highs. Widespread, devastating wildfires made the situation worse.

Climate alarmists predictably claimed these weather events for their propaganda.  Almost all news article about the Australian heat and wildfires ultimately blamed man-made climate change. But more than four-fifths of Australia’s wildfires were caused by arson, not climate change.

And what caused the extreme hot weather was not global warming but a phenomenon called Positive Indian Ocean Dipole (PIOD).

PIOD is a seasonal weather phenomenon that can affect climate in east Africa, south Asia, and Australia all at once.

The same PIOD that caused Australia’s heat (but not its wildfires) caused the year-end floods in east Africa. It also caused extreme cold in northern India in the same month. Largely underreported in global media, the cold continued right through to the end of December.

Delhi, India’s capital, recorded its second-coldest December in 118 years. Intermittent cold waves gripped Punjab, Jammu and Kashmir, Ladakh, Himachal Pradesh, Uttarakhand, and Delhi.

On December 28, the heart of Delhi recorded a minimum of 1.7˚C (35˚F). The temperature likely reached freezing outside the city’s urban heat island effect. The cold wave impacted everyday life for 29 million people in Delhi.

But neither CNN nor BBC headlines ever mentioned it. It runs contrary to their narrative. Winters are supposed to become warmer. Though the mainstream media do link the PIOD to the Australian heat and the east African floods, they never shy away from blaming man-made climate change and find ways to link both.

Now their new theory is that the PIOD itself has become more intense because of climate change. In other words, weather events are non-existent in their dictionary. Each and every extreme weather event is blamed on man-made climate change.

This is what happens when people read every weather event through the preconceived lenses of climate alarmism.

Closer inspection reveals no change in very hot days in Australia since World War I. So hot weather (short term) and hot climate (long term) have nothing to do with the wildfire outbreak.

December’s extremes — heat in Australia, flooding in east Africa, cold in India — all were caused by a strong PIOD, not climate change.

These weather events neither prove nor disprove man-made climate change. But they do expose the bias of climate alarmists who blame them on man-made global warming.

Vijay Jayaraj (M.Sc., Environmental Science, University of East Anglia, England) is a research contributor for the Cornwall Alliance for the Stewardship of Creation.

Footnote:

The real tragedy is that Australian officials keep obsessing over their bogus climate models instead taking seriously real world weather warnings. It is not like they had no advance notice; this was published May 16, 2019, which should have triggered major efforts to reduce the fuel load long before summer.

ABC Online: A positive Indian Ocean Dipole this winter is bad news for drought-hit parts of Australia

Cool seas off WA’s north-west could kick off a climatic phenomenon that may exacerbate a winter drought across central and southern Australia.

See Also Aussies’ Choice:  Burn Cool or Burn Hot

Worse Today Because Climate Change

This from the Onion confirms our suspicions.  Excerpt in italics with my bolds.

Report: Everything Slightly Worse Than Yesterday

NEW YORK—Emphasizing that the phenomenon is barely perceptible on a daily basis yet significant when observed on the whole, the nation’s top qualitative experts released a report Monday confirming that everything in every significant area of life is, in fact, slightly worse than it was yesterday. “While there are by no means any drastic changes for the worse in any given 24-hour period, we have observed a measurable and steady decline in each passing day,” the report read in part, specifically noting gradual but perceptible declines in personal wealth, food quality, the overall love shared by humanity, and the warmth of sunlight. “The outlook certainly looks bleak for the things that bring you joy, be it conversation with friends or the sound of children’s laughter, as they slowly become less and less fulfilling. Your favorite song will eventually become grating, the touch of your lover harsh and abrasive, and your own thoughts bitter and abhorrent as your mind itself sours.”

The report also noted that you should have noticed by now but your very awareness of things has diminished and grown hazy.

OK, but they forgot to mention that it is worst for children, women and minorities, and that cutting fossil fuels would solve this.


N. Atlantic Temps Cool to End 2019

RAPID Array measuring North Atlantic SSTs.

For the last few years, observers have been speculating about when the North Atlantic will start the next phase shift from warm to cold. Given the way 2018 went and 2019 followed, this may be the onset.  First some background.

. Source: Energy and Education Canada

An example is this report in May 2015 The Atlantic is entering a cool phase that will change the world’s weather by Gerald McCarthy and Evan Haigh of the RAPID Atlantic monitoring project. Excerpts in italics with my bolds.

This is known as the Atlantic Multidecadal Oscillation (AMO), and the transition between its positive and negative phases can be very rapid. For example, Atlantic temperatures declined by 0.1ºC per decade from the 1940s to the 1970s. By comparison, global surface warming is estimated at 0.5ºC per century – a rate twice as slow.

In many parts of the world, the AMO has been linked with decade-long temperature and rainfall trends. Certainly – and perhaps obviously – the mean temperature of islands downwind of the Atlantic such as Britain and Ireland show almost exactly the same temperature fluctuations as the AMO.

Atlantic oscillations are associated with the frequency of hurricanes and droughts. When the AMO is in the warm phase, there are more hurricanes in the Atlantic and droughts in the US Midwest tend to be more frequent and prolonged. In the Pacific Northwest, a positive AMO leads to more rainfall.

A negative AMO (cooler ocean) is associated with reduced rainfall in the vulnerable Sahel region of Africa. The prolonged negative AMO was associated with the infamous Ethiopian famine in the mid-1980s. In the UK it tends to mean reduced summer rainfall – the mythical “barbeque summer”.Our results show that ocean circulation responds to the first mode of Atlantic atmospheric forcing, the North Atlantic Oscillation, through circulation changes between the subtropical and subpolar gyres – the intergyre region. This a major influence on the wind patterns and the heat transferred between the atmosphere and ocean.

The observations that we do have of the Atlantic overturning circulation over the past ten years show that it is declining. As a result, we expect the AMO is moving to a negative (colder surface waters) phase. This is consistent with observations of temperature in the North Atlantic.

Cold “blobs” in North Atlantic have been reported, but they are usually winter phenomena. For example in April 2016, the sst anomalies looked like this

But by September, the picture changed to this

And we know from Kaplan AMO dataset, that 2016 summer SSTs were right up there with 1998 and 2010 as the highest recorded.

As the graph above suggests, this body of water is also important for tropical cyclones, since warmer water provides more energy.  But those are annual averages, and I am interested in the summer pulses of warm water into the Arctic. As I have noted in my monthly HadSST3 reports, most summers since 2003 there have been warm pulses in the north atlantic.

The AMO Index is from from Kaplan SST v2, the unaltered and not detrended dataset. By definition, the data are monthly average SSTs interpolated to a 5×5 grid over the North Atlantic basically 0 to 70N.  The graph shows the warmest month August beginning to rise after 1993 up to 1998, with a series of matching years since.  December 2017 set a record at 20.6C, but note the plunge down to 20.2C for December 2018, matching 2011 as the coldest years since 2000. December 2019 shows an uptick but still lower than 2016-2017.

December 2019 confirms the summer pulse weakening, along with 2018 well below other recent peak years since 1998.  Because McCarthy refers to hints of cooling to come in the N. Atlantic, let’s take a closer look at some AMO years in the last 2 decades.

This graph shows monthly AMO temps for some important years. The Peak years were 1998, 2010 and 2016, with the latter emphasized as the most recent. The other years show lesser warming, with 2007 emphasized as the coolest in the last 20 years. Note the red 2018 line was at the bottom of all these tracks.  The black line shows that 2019 began slightly cooler than January 2018, then tracked closely before rising in the summer months, though still lower than the peak years. Through December 2019 is again tracking warmer than 2018 but cooler than other recent years in the North Atlantic. For the 12 month annual average, 2019 is 0.1C higher than 2018, but cooler by more than 0.1C lower than the El Nino years of 2016 and 2017.

Ocean Air Temps Cool, Land Waffles in December

banner-blog

With apologies to Paul Revere, this post is on the lookout for cooler weather with an eye on both the Land and the Sea.  UAH has updated their tlt (temperatures in lower troposphere) dataset for December.  Previously I have done posts on their reading of ocean air temps as a prelude to updated records from HADSST3. This month also has a separate graph of land air temps because the comparisons and contrasts are interesting as we contemplate possible cooling in coming months and years.

Presently sea surface temperatures (SST) are the best available indicator of heat content gained or lost from earth’s climate system.  Enthalpy is the thermodynamic term for total heat content in a system, and humidity differences in air parcels affect enthalpy.  Measuring water temperature directly avoids distorted impressions from air measurements.  In addition, ocean covers 71% of the planet surface and thus dominates surface temperature estimates.  Eventually we will likely have reliable means of recording water temperatures at depth.

Recently, Dr. Ole Humlum reported from his research that air temperatures lag 2-3 months behind changes in SST.  He also observed that changes in CO2 atmospheric concentrations lag behind SST by 11-12 months.  This latter point is addressed in a previous post Who to Blame for Rising CO2?

After a technical enhancement to HadSST3 delayed March and April updates, May resumed a pattern of HadSST updates mid month.  For comparison we can look at lower troposphere temperatures (TLT) from UAHv6 which are now posted for December. The temperature record is derived from microwave sounding units (MSU) on board satellites like the one pictured above. Recently there was a change in UAH processing of satellite drift corrections, including dropping one platform which can no longer be corrected. The graphs below are taken from the new and current dataset.

The UAH dataset includes temperature results for air above the oceans, and thus should be most comparable to the SSTs. There is the additional feature that ocean air temps avoid Urban Heat Islands (UHI).  The graph below shows monthly anomalies for ocean temps since January 2015.

After a June rise in ocean air temps, all regions dropped back down to May levels in July and August.  A spike occured in September, followed by plummenting October ocean air temps in the Tropics and SH. In November that drop partly warmed back, now leveling slightly downword with continued cooling in NH.

Land Air Temperatures Tracking in Seesaw Pattern

We sometimes overlook that in climate temperature records, while the oceans are measured directly with SSTs, land temps are measured only indirectly.  The land temperature records at surface stations sample air temps at 2 meters above ground.  UAH gives tlt anomalies for air over land separately from ocean air temps.  The graph updated for October is below.
Here we have freash evidence of the greater volatility of the Land temperatures, along with an extraordinary departure by SH land.  Despite the small amount of SH land, it spiked in July, then dropped in August so sharply along with the Tropics that it pulled the global average downward against slight warming in NH.  In November SH jumped up beyond any month in this period.  Despite this spike along with a rise in the Tropics, NH land temps dropped sharply.  The larger NH land area pulled the Global average downward.  December reversed the situation with the SH dropping as sharply as it rose, while NH rose to the same anomaly, pulling the Global up slightly. The behavior of SH land temps is puzzling, to say the least.  it is also a reminder that global averages can conceal important underlying volatility.

The longer term picture from UAH is a return to the mean for the period starting with 1995.  2019 average rose but currently lacks any El Nino to sustain it.

TLTs include mixing above the oceans and probably some influence from nearby more volatile land temps.  Clearly NH and Global land temps have been dropping in a seesaw pattern, more than 1C lower than the 2016 peak, prior to these last several months. TLT measures started the recent cooling later than SSTs from HadSST3, but are now showing the same pattern.  It seems obvious that despite the three El Ninos, their warming has not persisted, and without them it would probably have cooled since 1995.  Of course, the future has not yet been written.