New Zealand Warming Disputed

New Zealand Cook National Park.

A dust up over the temperature trend in New Zealand is discussed at the the climate conversation New Zealand Response to NIWA comment on de Freitas reanalysis of the NZ temperature record  by Barry Brill, Chairman of the New Zealand Climate Science Coalition.  Excerpts with my bolds.

Conclusions

de Freitas finds that New Zealand has experienced an insignificant warming trend of 0.28°C/century during 1909-2008. Using the same data, the Mullan Report calculates that trend at 0.91°C/century. Both studies claim to apply the statistical technique described in RS93, and each alleges that the other has departed from that methodology. This core issue has been described in the graph above but has not been addressed in this note.

A second core issue relates to reliance upon inhomogeneous Auckland and Wellington data despite the extensive contamination of both sites by sheltering and UHI. That matter has not been addressed here either.

Instead, this limited reply deals with the raft of peripheral allegations contained in the NIWA Comment. In particular, it sets out to show that all plausible published records, as well as the scientific literature, support the view that New Zealand’s temperature record has remained remarkably stable over the past century or so.

Some of the Issues Rebutted

Other temperature records:

The de Freitas warming trend of 0.28°C/century is wholly consistent with the synchronous Southern Hemisphere trend reported in IPPC’s AR5. Both the IPCC and NIWA have long reported that anthropogenic warming trends in ocean-dominated New Zealand would be materially lower than global averages. The S81/Mullan Report trend of 0.91°C/century is clearly anomalous.

Official New Zealand temperature records for eight years in the 1860s, which are both reliable and area-representative, show the absolute mean temperature was then 13.1°C. A 30-year government record for the period ending 1919 shows the mean temperature to be 12.8°C. The current normal (30-year) mean 7SS temperature is 12.9°C. Clearly, New Zealand mean temperatures have remained almost perfectly stable during the past 150 years.

Use of RS93 Statistical Method:

The Mullan Report (along with other NIWA articles that are not publicly available) does purport to use RS93 comparison techniques, so this assertion is naturally accepted whenever these ‘grey’ papers are mentioned in the peer-reviewed literature. However, the Mullan Report sits outside the literature and clearly fails to execute its stated intention to apply RS93 methods. The de Freitas paper rectifies those omissions.

NZ Glaciers

In this area, the most recent authority is Mackintosh et al. (2017), entitled “Regional cooling caused recent New Zealand glacier advances in a period of global warming.” After observing that at least 58 Southern Alps glaciers advanced during the period 1983-2008, the abstract notes:

“Here we show that the glacier advance phase resulted predominantly from discrete periods of reduced air temperature, rather than increased precipitation. The lower temperatures were associated with anomalous southerly winds and low sea surface temperature in the Tasman Sea region. These conditions result from variability in the structure of the extratropical atmospheric circulation over the South Pacific.”

This Nature paper, of which James Renwick was an author, notes that the World Glacier Monitoring Service database shows that in 2005 “15 of the 26 advancing glaciers observed worldwide were in New Zealand.”

BEST Data

Using up to 52 auto-adjusted datasets1, the Berkeley Earth group derives an absolute New Zealand temperature range of 9.5°C to 11°C over the 160-year period from 1853 to 2013.

The mid-point of this range is very far from the mid-point of the 12.3°C to 13.2°C range recorded in the 7SS (whether raw or adjusted) and is clearly wrong. Nonetheless, for the 100-year period 1909-2008, the BEST adjusted anomalies are said to show a 100% perfect correlation with those of the Mullan Report (to three decimal points). The claimed independence of such an immaculate outcome is entirely implausible.

Anthropogenic Warming

The Mullan Report’s 1960-90 upwards spike could not have occurred whilst the south-west Pacific region was in a cooling phase – which is confirmed by Mackintosh et al. (2017). Further, the final 30-year period of the Mullan Report shows an insignificant trend of only 0.12°C/century, demonstrating that New Zealand has not yet been affected by global warming trends.

Summary

Good to see that de Fritas et al are again speaking climate truth to entrenched alarmists.  Go Kiwis!

Confronting Suzuki’s Climate Hysteria

Thanks to Friends of Science in Calgary for hosting Award-winning Dutch filmmaker Marijn Poels and Canadian climate change scientist Dr. Madhav Khandekar.  They dismantled the dogma of Global Editors Network and Dr. Suzuki-style climate hysteria in one evening at Friends of Science Society’s 15th Annual Event entitled: “Extreme Climate Uncertainty.”

Full story is Inquiry not Dogma, which includes links and background information.  Excerpts with my bolds.

Poels challenged the audience with evidence that food security is at risk due to ‘green’ energy policies while Dr. Khandekar deconstructed climate alarmism with convincing evidence that extreme weather is mostly media hype.

Left-wing, progressive Poels recounted to the Friends of Science event audience how he had worked in conflict and poverty countries for nine years, making 50 films in that time. When he returned home to Europe for some recovery time in the pastoral countryside, he was surprised, then alarmed to find that EU climate and energy policies were trading food security for unreliable, expensive ‘energy’ security. Curious to find the root of this strange set of policies, Poels followed the money and policy to talk with climate scientists and agricultural experts.

Poels noted that he had a broad-reaching, very supportive media network for his human rights and justice films; this dried up the moment he broached the topic of climate change.His 2017  documentary film exposed how climate change policies are threatening modern civilization. Trailer can be viewed below. My recent post on this subject was Climate Policies Failure, the Movie.

Dr. Madhav Khandekar, former Environment Canada researcher, gave a lively, humorous presentation that debunked the claims of extreme weather being more frequent or caused by human influence on climate or human industrial carbon dioxide emissions. Khandekar explained some of the intricacies of the global effects of the natural, cyclical El Nino Southern Oscillation and its mirror image, La Nina. Overall, Khandekar says the only noticeable trends are toward longer cold snaps, a possible harbinger of long periods of cold and erratic weather as experienced in the Little Ice Age, during a solar minimum.

Khandekar was an instructor at the University of Alberta early on in his career, an institution now embroiled in a vigorous public debate about the propriety of conferring an honorary degree on Dr. David Suzuki at this spring’s convocation.

Friends of Science Society posted an open letter on their blog on May 9, 2018, addressed to the president of the University of Alberta, expressing their views on the matter. After describing the details of Suzuki’s destructive behavior, the letter concludes with the following summary:

Friends of Science Society University of Alberta grad members are not upset that Dr. Suzuki holds controversial views because they value freedom of speech. More so, they value scientific integrity. They are upset that he spouts false and misleading diatribes on scientific topics – contrary to all the careful and accurate scientific methods that they learned as students at the University of Alberta.

And they are very upset that you choose to honor that.

Our members have not only seen job loss for themselves or their employees, they have experienced the tragic consequences of lives lost through suicide as careers, finances, families and business enterprises fall apart.

For no good reason.

Under your leadership, Dr. Turpin, the University of Alberta embarked on a program entitled “For the Public Good.” Now you want to honor a high-profile public figure, someone whose uninformed and misleading activism, has aided the destruction of the economy in Alberta, whose unsupported activist rhetoric has done untold damage to the Canadian economy and whose statements have damaged our international reputation as a reliable and fair place to do business. The outcomes include personal catastrophe for hundreds of thousands of people, many of them University of Alberta alumni. How is that for the public good?

In our opinion, based on the foregoing evidence, Dr. Suzuki’s actions and words are not congruent with the skills learned in the physical sciences, environmental or business management at the University of Alberta. They are not in keeping with the expectations of its graduates or faculty members, nor with its own Code of Ethics, nor with the values you express in your statement meant to validate your decision to honor Dr. Suzuki.

We ask that you rescind the offer of the honorary degree to Dr. David Suzuki.


Climate Proxy Fighting Season and First Result

Shell Shareholders Vote 94% Against Climate Target-Setting Resolution

On May 22, 2018 one of the first skirmishes went badly for climatists, though journals like the Guardian gave no such impression:
Shell investors revolt over pay and maintain pressure over climate change; Oil firm grilled over carbon emissions, but defeats motion calling for tougher targets.

The resolution (“2DS”) represents a new front in attempts to constrain oil majors since it seeks authority to set operational goals in reference to the Paris accord, normally the discretion of management. BTW this type of resolution requires 75% approval, and only got 6%.

Proxy advisors exercise great influence in these fights and are coming under increasing scrutiny and criticism for promoting causes against the financial interests of shareholders. In this case some may be taking notice that virtue signaling is not free of consequences. Independent European proxy advisory group ECGS recommended investors back the climate resolution, but major advisers Glass Lewis and ISS opposed it. The results show no major institutional investor (including Norwegian wealth fund) gave support.

Climate Activists storm the bastion of Exxon Mobil, here seen without their shareholder disguises.

The background and context for shareholder climate activism comes from Harvard Law School forum on Corporate Governance 2018 Proxy Season Preview  Excerpts with my bolds.

2017 was breakout year for climate change campaigns with three landmark majority votes asking Exxon Mobil, Occidental Petroleum, and PPL to report on how they plan to adjust their business models in line with the Paris Accord’s goal of limiting global warming to 2° Celsius (“2° scenario” or “2DS”).

The results reflect a sea change in the attitude and voting practices of several major asset managers—BlackRock, Vanguard Group and Fidelity Management & Research—which for the first time supported some of the climate change resolutions last year. Of the three, Fidelity made the greatest shift in its voting, backing every one of the 2DS resolutions it voted on, while BlackRock and Vanguard only endorsed the two at Exxon and Occidental.

Other institutional investors could follow suit, particularly as a result of pressure from their own shareholders and clients. Last year, Walden Asset Management withdrew proposals at BlackRock, Vanguard, and JPMorgan Chase after the firms agreed to review inconsistencies between their proxy voting records and their public stance on climate change. Walden and other filers have similar resolutions pending this year at Bank of New York Mellon and Cohen & Steers and withdrew a third at T. Rowe Price Group. Franklin Resources, which has received proxy voting review resolutions every year since 2014, wasn’t retargeted in 2018 because it improved its approach by voting for 24% of climate risk proposals in 2017, compared to 10% in 2016.

The proxy advisors have also amended their voting policies for 2018 to reflect their general support of resolutions to disclose climate-related risks. ISS’s policy now extends to proposals on how the company identifies, measures and manages such risks, in keeping with the recommendations of the TFCD, while Glass Lewis will largely back requests for climate change scenario analyses at companies in extractive or energy-intensive industries.

All of this has galvanized shareholder activists, who have filed a new round of 2DS proposals for 2018 with the expectation of generating a higher number of favorable votes or encouraging pro-action by companies. In addition to last year’s three majority vote companies, Duke Energy and Marathon Petroleum have produced or committed to producing climate impact reports, even though 2017 proposals received less than majority support. Several utilities targeted in 2018—CMS Energy, DTE Energy and WEC Energy Group—have also agreed to publish climate assessments.

Even so, not all company responses have satisfied investors. Exxon’s newly released report has already drawn criticism from proponents for concluding that aggressive climate policies pose little risk to its reserves because the demand for fossil fuels will remain strong for decades. Individual investor Steven Milloy went a step further by characterizing these reporting exercises as mere “greenwashing”  to improve companies’ public image. In a proposal at Exxon that was later withdrawn, he asserted that many voluntary activities and expenditures touted as protecting the climate are a waste of corporate assets that fail to yield any meaningful benefits to shareholders, public health, or the environment. As a case in point, two years after BP and Royal Dutch Shell shareholders overwhelmingly passed 2DS resolutions, the companies still disclose only minimal information on how they are mitigating climate risks, and they have yet to set greenhouse gas (GHG) reduction targets or markedly improved their investments in low-carbon technology.

Although 2DS will be the most-watched environmental category this year, other climate-related resolutions could generate significant support. As You Sow and Miller/Howard Investments have filed resolutions at nine oil and gas producers to report on their efforts to monitor and minimize methane leakage. Prior support on these proposals has been strong, averaging 31.7% in 2017, including two resolutions that received votes in the 40% range.

Aside from energy firms, proponents are targeting a broad range of industries with resolutions to set goals to reduce GHG emissions or increase renewable energy sourcing. In the past, these measures have averaged support in the 20% range, though several this year have already yielded commitments from AES, American Electric Power, and Western Union. A proposal variation favored by Jantz Management and Amalgamated Bank—to assess the feasibility of achieving net-zero GHG emissions by a specific date—continues to be excludable as ordinary business.

Resources:

Fund Managers Should Focus on Returns, Not Political Ideals RealClearMarkets

This trend, while relatively new, is alarming and it differs significantly from traditional activism. While traditional activist shareholders used the proxy proposal process to advance views that differed from management on what was best for the company, they never did anything that would undermine the reason for their investment, which was to maximize shareholder value. In contrast, the new wave of shareholder activists, have a fundamentally different goal; to exploit the proxy proposal process to drive wider societal change.

Pensioners Pay for Climate Activism

We all care about the environment and our own social causes, but an increased focus on issues that have no concrete connection to value has proven costly for the retirees who rely on their pension fund for their livelihood and the taxpayers that backfill their underperformance.

Now the nation’s largest passive-investment fund is moving toward implementing the same types of policies as the pension funds that happen to provide it billions of dollars in business each year, and millions of everyday investors could be affected. Anyone with an investment account should take note.

Climate Shell Game

Shell Resolution:  Shareholders support Shell to take leadership in the energy transition to a net-zero-emission energy system. Therefore, shareholders request Shell to set and publish targets for reducing greenhouse gas (GHG) emissions that are aligned with the goal of the Paris Climate Agreement to limit global warming to well below 2°C.

This shareholder resolution is intended to express shareholder support for a course towards a net-zero-emission energy system. The why of a course towards a net-zero-emission energy system is clear: increasing costs of the extraction of fossil fuels, decreasing costs of generating renewable energy, and the global political pledge to stop global warming. The how and the what are up to the management of Shell. It is up to them to set GHG emission reduction targets and to develop activities to attain these targets.

We the shareholders request that the company publish company-wide greenhouse gas (GHG) emission reduction targets according to the following 3 scopes:

Scope 1: direct emissions from the facilities under Shell’s operational control or the equity boundary,
Scope 2: indirect emissions from the facilities of others that provide electricity or heat and steam to Shell’s operations,
Scope 3: emissions that Shell estimates come from the use of Shell’s refinery products and natural gas products.

How Climate Law Relies on Paris

On the same day POTUS announced US withdrawal from Paris accord, a majority of Exxon Mobil shareholders approved a resolution asking management to assess the value of corporate assets considering a global move toward a low-carbon future. Here is the resolution, filed by the New York State Comptroller:

RESOLVED: Shareholders request that, beginning in 2018, ExxonMobil publish an annual assessment of the long-term portfolio impacts of technological advances and global climate change policies, at reasonable cost and omitting proprietary information. The assessment can be incorporated into existing reporting and should analyze the impacts on ExxonMobil’s oil and gas reserves and resources under a scenario in which reduction in demand results from carbon restrictions and related rules or commitments adopted by governments consistent with the globally agreed upon 2 degree target. This reporting should assess the resilience of the company’s full portfolio of reserves and resources through 2040 and beyond, and address the financial risks associated with such a scenario.

Climate Canary? N. America Cooling

Hidden amid reports of recent warmest months and years based on global averages, there is a significant departure in North America. Those of us living in Canada and USA have noticed a distinct cooling, and our impressions are not wrong.

The image above shows how much lower have been April 2018 temperatures. The table below provides the numbers behind the graphs from NOAA State of the Climate.

CONTINENT ANOMALY (1910-2000) TREND (1910-2018) RANK RECORDS
°C °F °C °F (OUT OF 109 YEARS) YEAR(S) °C °F
North America -0.97 -1.75 0.11 0.19 Warmest 94ᵗʰ 2010 2.65 4.77
South America 1.34 2.41 0.13 0.24 Warmest 1ˢᵗ 2018 1.34 2.41
Europe 2.82 5.08 0.14 0.25 Warmest 1ˢᵗ 2018 2.82 5.08
Africa 1.23 2.21 0.12 0.22 Warmest 5ᵗʰ 2016 1.72 3.1
Asia 1.66 2.99 0.18 0.32 Warmest 9ᵗʰ 2016 2.4 4.32
Oceania 2.47 4.45 0.14 0.25 Warmest 2ⁿᵈ 2005 2.54 4.57

The table shows how different was the North American experience: 94th out of 109 years.  But when we look at the first four months of the year, the NA is more in line with the rest of the globe.


As the image shows, cooling was more widespread during the first third of 2018, particularly in NA, Northern Europe and Asia, as well as a swath of cooler mid ocean latitudes in the Southern Hemisphere.

CONTINENT ANOMALY (1910-2000) TREND (1910-2018) RANK RECORDS
°C °F °C °F (OUT OF 109 YEARS) YEAR(S) °C °F
North America 0.44 0.79 0.16 0.29 Warmest 44ᵗʰ 2016 2.71 4.88
South America 0.94 1.69 0.13 0.24 Warmest 6ᵗʰ 2016 1.39 2.5
Europe 1.35 2.43 0.13 0.24 Warmest 13ᵗʰ 2014 2.46 4.43
Africa 1.08 1.94 0.1 0.18 Warmest 3ʳᵈ 2010 1.62 2.92
Asia 1.57 2.83 0.19 0.34 Warmest 8ᵗʰ 2002 2.72 4.9
Oceania 1.58 2.84 0.12 0.22 Warmest 1ˢᵗ 2018 1.58 2.84

The table confirms that Europe and Asia are cooler in 2018 than recent years in the decade.

Summary

These data show again that temperature indicators of climate are not global but regional, and even local in their manifestations.  At the continental level there are significant differences.  North America is an outlier, but who is to say whether it is an aberration that will join the rest, or whether it is the trend setter signaling a widespread cooler future.

See Also:  Is This Cold the New Normal?

Bering Sea Blues

“Freedom’s Just Another Word for Nothing Left to Lose.” (Kris Kristofferson)

In May, Arctic ice extent declined as usual with the notable exception of Bering Sea, now almost ice free.  Bering still has some ice to lose, but at 23k km2 it is only 5% of the ice there March 17 at annual Bering maximum, just two months ago.  It is unusual since the Bering ice is only 10% of the 11 year average for this date.  Nearby Chukchi Sea is showing open water, somewhat ahead of schedule.  Okhotsk also in the Pacific is melting and now below average for this date.

Elsewhere things are mostly typical.   Russian and Canadian basins are frozen with high extents and Barents is now matching average.

The graph below shows how the Arctic extent has faired in May compared to the 11 year average with and without the Pacific basins of Bering and Okhotsk.  2018 (brown line lacks B&O) is tracking the orange line with some divergence lately.
NHday141less BO

The graph below shows May 2018 compared to average and some years of interest.
NHday141

Note that 2017 tracks above the 11-year average.  2018 is tracking 2007, which will match average by end of May.  The table below shows ice extents by regions comparing 2018 with 11-year average (2007 to 2017 inclusive) and 2007.

Region 2018141 Day 141 
Average
2018-Ave. 2007141 2018-2007
 (0) Northern_Hemisphere 11963940 12493152 -529212 12114407 -150467
 (1) Beaufort_Sea 1046328 1025787 20541 1063324 -16996
 (2) Chukchi_Sea 790287 916151 -125864 936237 -145949
 (3) East_Siberian_Sea 1076816 1074527 2289 1067808 9008
 (4) Laptev_Sea 893794 866784 27009 793551 100243
 (5) Kara_Sea 934453 881645 52808 885543 48909
 (6) Barents_Sea 401369 396306 5063 327568 73801
 (7) Greenland_Sea 441882 606737 -164856 576791 -134909
 (8) Baffin_Bay_Gulf_of_St._Lawrence 1125388 1062146 63242 968062 157325
 (9) Canadian_Archipelago 839235 833381 5854 837658 1577
 (10) Hudson_Bay 1153411 1158944 -5533 1097706 55705
 (11) Central_Arctic 3132441 3231803 -99361 3235644 -103203
 (12) Bering_Sea 23001 268930 -245929 213547 -190547
 (13) Baltic_Sea 788 2344 -1556 2146 -1358
 (14) Sea_of_Okhotsk 103188 165353 -62165 106753 -3565

As indicated Bering supplies almost half of the deficit to average, along with Chukchi and Okhotsk deficits.  Lack of ice in Greenland Sea may signify a reduced flow of drift ice out of the Arctic through Fram Strait.

20180522

Current ice chart from AARI St. Petersburg Russia. Old sea ice is in brown.


Regulatory Backfire

Update Nov. 22, 2018

With the Democrats taking control of the US House of Representatives, we can expect attempts to again “fight climate change” by means of counter productive regulations.  This post explains why such policies are ineffective and produce unintended consequences, with results worse than doing nothing.

Background:  Heisenberg Uncertainty

In the sub-atomic domain of quantum mechanics, Werner Heisenberg, a German physicist, determined that our observations have an effect on the behavior of quanta (quantum particles).

The Heisenberg uncertainty principle states that it is impossible to know simultaneously the exact position and momentum of a particle. That is, the more exactly the position is determined, the less known the momentum, and vice versa. This principle is not a statement about the limits of technology, but a fundamental limit on what can be known about a particle at any given moment. This uncertainty arises because the act of measuring affects the object being measured. The only way to measure the position of something is using light, but, on the sub-atomic scale, the interaction of the light with the object inevitably changes the object’s position and its direction of travel.

Now skip to the world of governance and the effects of regulation. A similar finding shows that the act of regulating produces reactive behavior and unintended consequences contrary to the desired outcomes.

An article at Financial Times explains about Energy Regulations Unintended Consequences  Excerpts below with my bolds.

Goodhart’s Law holds that “any observed statistical regularity will tend to collapse once pressure is placed upon it for control purposes”. Originally coined by the economist Charles Goodhart as a critique of the use of money supply measures to guide monetary policy, it has been adopted as a useful concept in many other fields. The general principle is that when any measure is used as a target for policy, it becomes unreliable. It is an observable phenomenon in healthcare, in financial regulation and, it seems, in energy efficiency standards.

When governments set efficiency regulations such as the US Corporate Average Fuel Economy standards for vehicles, they are often what is called “attribute-based”, meaning that the rules take other characteristics into consideration when determining compliance. The Cafe standards, for example, vary according to the “footprint” of the vehicle: the area enclosed by its wheels. In Japan, fuel economy standards are weight-based. Like all regulations, fuel economy standards create incentives to game the system, and where attributes are important, that can mean finding ways to exploit the variations in requirements. There have long been suspicions that the footprint-based Cafe standards would encourage manufacturers to make larger cars for the US market, but a paper this week from Koichiro Ito of the University of Chicago and James Sallee of the University of California Berkeley provided the strongest evidence yet that those fears are likely to be justified.

Mr Ito and Mr Sallee looked at Japan’s experience with weight-based fuel economy standards, which changed in 2009, and concluded that “the Japanese car market has experienced a notable increase in weight in response to attribute-based regulation”. In the US, the Cafe standards create a similar pressure, but expressed in terms of size rather than weight. Mr Ito suggested that in Ford’s decision to end almost all car production in North America to focus on SUVs and trucks, “policy plays a substantial role”. It is not just that manufacturers are focusing on larger models; specific models are also getting bigger. Ford’s move, Mr Ito wrote, should be seen as an “alarm bell” warning of the flaws in the Cafe system. He suggests an alternative framework with a uniform standard and tradeable credits, as a more effective and lower-cost option. With the Trump administration now reviewing fuel economy and emissions standards, and facing challenges from California and many other states, the vehicle manufacturers appear to be in a state of confusion. An elegant idea for preserving plans for improving fuel economy while reducing the cost of compliance could be very welcome.

The paper is The Economics of Attribute-Based Regulation: Theory and Evidence from Fuel-Economy Standards Koichiro Ito, James M. Sallee NBER Working Paper No. 20500.  The authors explain:

An attribute-based regulation is a regulation that aims to change one characteristic of a product related to the externality (the “targeted characteristic”), but which takes some other characteristic (the “secondary attribute”) into consideration when determining compliance. For example, Corporate Average Fuel Economy (CAFE) standards in the United States recently adopted attribute-basing. Figure 1 shows that the new policy mandates a fuel-economy target that is a downward-sloping function of vehicle “footprint”—the square area trapped by a rectangle drawn to connect the vehicle’s tires.  Under this schedule, firms that make larger vehicles are allowed to have lower fuel economy. This has the potential benefit of harmonizing marginal costs of regulatory compliance across firms, but it also creates a distortionary incentive for automakers to manipulate vehicle footprint.

Attribute-basing is used in a variety of important economic policies. Fuel-economy regulations are attribute-based in China, Europe, Japan and the United States, which are the world’s four largest car markets. Energy efficiency standards for appliances, which allow larger products to consume more energy, are attribute-based all over the world. Regulations such as the Clean Air Act, the Family Medical Leave Act, and the Affordable Care Act are attribute-based because they exempt some firms based on size. In all of these examples, attribute-basing is designed to provide a weaker regulation for products or firms that will find compliance more difficult.

Summary from Heritage Foundation study Fuel Economy Standards Are a Costly Mistake Excerpt with my bolds.

The CAFE standards are not only an extremely inefficient way to reduce carbon dioxide emission but will also have a variety of unintended consequences.

For example, the post-2010 standards apply lower mileage requirements to vehicles with larger footprints. Thus, Whitefoot and Skerlos argued that there is an incentive to increase the size of vehicles.

Data from the first few years under the new standard confirm that the average footprint, weight, and horsepower of cars and trucks have indeed all increased since 2008, even as carbon emissions fell, reflecting the distorted incentives.

Manufacturers have found work-arounds to thwart the intent of the regulations. For example, the standards raised the price of large cars, such as station wagons, relative to light trucks. As a result, automakers created a new type of light truck—the sport utility vehicle (SUV)—which was covered by the lower standard and had low gas mileage but met consumers’ needs. Other automakers have simply chosen to miss the thresholds and pay fines on a sliding scale.

Another well-known flaw in CAFE standards is the “rebound effect.” When consumers are forced to buy more fuel-efficient vehicles, the cost per mile falls (since their cars use less gas) and they drive more. This offsets part of the fuel economy gain and adds congestion and road repair costs. Similarly, the rising price of new vehicles causes consumers to delay upgrades, leaving older vehicles on the road longer.

In addition, the higher purchase price of cars under a stricter CAFE standard is likely to force millions of households out of the new-car market altogether. Many households face credit constraints when borrowing money to purchase a car. David Wagner, Paulina Nusinovich, and Esteban Plaza-Jennings used Bureau of Labor Statistics data and typical finance industry debt-service-to-income ratios and estimated that 3.1 million to 14.9 million households would not have enough credit to purchase a new car under the 2025 CAFE standards.[34] This impact would fall disproportionately on poorer households and force the use of older cars with higher maintenance costs and with fuel economy that is generally lower than that of new cars.

CAFE standards may also have redistributed corporate profits to foreign automakers and away from Ford, General Motors (GM), and Chrysler (the Big Three), because foreign-headquartered firms tend to specialize in vehicles that are favored under the new standards.[35] 

Conclusion

CAFE standards are costly, inefficient, and ineffective regulations. They severely limit consumers’ ability to make their own choices concerning safety, comfort, affordability, and efficiency. Originally based on the belief that consumers undervalued fuel economy, the standards have morphed into climate control mandates. Under any justification, regulation gives the desires of government regulators precedence over those of the Americans who actually pay for the cars. Since the regulators undervalue the well-being of American consumers, the policy outcomes are predictably harmful.

Update Nov. 22, 2018

With the Democrats taking control of the US House of Representatives, we we will likely see them attempting again to “fight climate change” by means of counterproductive regulations and rules.  This post explains why such policies are ineffective, create unintended consequences that can make matters worse than doing nothing.

Background:  Hiesenberg Uncertainty

In the sub-atomic domain of quantum mechanics, Werner Heisenberg, a German physicist, determined that our observations have an effect on the behavior of quanta (quantum particles).

The Heisenberg uncertainty principle states that it is impossible to know simultaneously the exact position and momentum of a particle. That is, the more exactly the position is determined, the less known the momentum, and vice versa. This principle is not a statement about the limits of technology, but a fundamental limit on what can be known about a particle at any given moment. This uncertainty arises because the act of measuring affects the object being measured. The only way to measure the position of something is using light, but, on the sub-atomic scale, the interaction of the light with the object inevitably changes the object’s position and its direction of travel.

Now skip to the world of governance and the effects of regulation. A similar finding shows that the act of regulating produces reactive behavior and unintended consequences contrary to the desired outcomes.

An article at Financial Times explains about Energy Regulations Unintended Consequences  Excerpts below with my bolds.

Goodhart’s Law holds that “any observed statistical regularity will tend to collapse once pressure is placed upon it for control purposes”. Originally coined by the economist Charles Goodhart as a critique of the use of money supply measures to guide monetary policy, it has been adopted as a useful concept in many other fields. The general principle is that when any measure is used as a target for policy, it becomes unreliable. It is an observable phenomenon in healthcare, in financial regulation and, it seems, in energy efficiency standards.

When governments set efficiency regulations such as the US Corporate Average Fuel Economy standards for vehicles, they are often what is called “attribute-based”, meaning that the rules take other characteristics into consideration when determining compliance. The Cafe standards, for example, vary according to the “footprint” of the vehicle: the area enclosed by its wheels. In Japan, fuel economy standards are weight-based. Like all regulations, fuel economy standards create incentives to game the system, and where attributes are important, that can mean finding ways to exploit the variations in requirements. There have long been suspicions that the footprint-based Cafe standards would encourage manufacturers to make larger cars for the US market, but a paper this week from Koichiro Ito of the University of Chicago and James Sallee of the University of California Berkeley provided the strongest evidence yet that those fears are likely to be justified.

Mr Ito and Mr Sallee looked at Japan’s experience with weight-based fuel economy standards, which changed in 2009, and concluded that “the Japanese car market has experienced a notable increase in weight in response to attribute-based regulation”. In the US, the Cafe standards create a similar pressure, but expressed in terms of size rather than weight. Mr Ito suggested that in Ford’s decision to end almost all car production in North America to focus on SUVs and trucks, “policy plays a substantial role”. It is not just that manufacturers are focusing on larger models; specific models are also getting bigger. Ford’s move, Mr Ito wrote, should be seen as an “alarm bell” warning of the flaws in the Cafe system. He suggests an alternative framework with a uniform standard and tradeable credits, as a more effective and lower-cost option. With the Trump administration now reviewing fuel economy and emissions standards, and facing challenges from California and many other states, the vehicle manufacturers appear to be in a state of confusion. An elegant idea for preserving plans for improving fuel economy while reducing the cost of compliance could be very welcome.

The paper is The Economics of Attribute-Based Regulation: Theory and Evidence from Fuel-Economy Standards Koichiro Ito, James M. Sallee NBER Working Paper No. 20500.  The authors explain:

An attribute-based regulation is a regulation that aims to change one characteristic of a product related to the externality (the “targeted characteristic”), but which takes some other characteristic (the “secondary attribute”) into consideration when determining compliance. For example, Corporate Average Fuel Economy (CAFE) standards in the United States recently adopted attribute-basing. Figure 1 shows that the new policy mandates a fuel-economy target that is a downward-sloping function of vehicle “footprint”—the square area trapped by a rectangle drawn to connect the vehicle’s tires.  Under this schedule, firms that make larger vehicles are allowed to have lower fuel economy. This has the potential benefit of harmonizing marginal costs of regulatory compliance across firms, but it also creates a distortionary incentive for automakers to manipulate vehicle footprint.

Attribute-basing is used in a variety of important economic policies. Fuel-economy regulations are attribute-based in China, Europe, Japan and the United States, which are the world’s four largest car markets. Energy efficiency standards for appliances, which allow larger products to consume more energy, are attribute-based all over the world. Regulations such as the Clean Air Act, the Family Medical Leave Act, and the Affordable Care Act are attribute-based because they exempt some firms based on size. In all of these examples, attribute-basing is designed to provide a weaker regulation for products or firms that will find compliance more difficult.

Summary from Heritage Foundation study Fuel Economy Standards Are a Costly Mistake Excerpt with my bolds.

The CAFE standards are not only an extremely inefficient way to reduce carbon dioxide emission but will also have a variety of unintended consequences.

For example, the post-2010 standards apply lower mileage requirements to vehicles with larger footprints. Thus, Whitefoot and Skerlos argued that there is an incentive to increase the size of vehicles.

Data from the first few years under the new standard confirm that the average footprint, weight, and horsepower of cars and trucks have indeed all increased since 2008, even as carbon emissions fell, reflecting the distorted incentives.

Manufacturers have found work-arounds to thwart the intent of the regulations. For example, the standards raised the price of large cars, such as station wagons, relative to light trucks. As a result, automakers created a new type of light truck—the sport utility vehicle (SUV)—which was covered by the lower standard and had low gas mileage but met consumers’ needs. Other automakers have simply chosen to miss the thresholds and pay fines on a sliding scale.

Another well-known flaw in CAFE standards is the “rebound effect.” When consumers are forced to buy more fuel-efficient vehicles, the cost per mile falls (since their cars use less gas) and they drive more. This offsets part of the fuel economy gain and adds congestion and road repair costs. Similarly, the rising price of new vehicles causes consumers to delay upgrades, leaving older vehicles on the road longer.

In addition, the higher purchase price of cars under a stricter CAFE standard is likely to force millions of households out of the new-car market altogether. Many households face credit constraints when borrowing money to purchase a car. David Wagner, Paulina Nusinovich, and Esteban Plaza-Jennings used Bureau of Labor Statistics data and typical finance industry debt-service-to-income ratios and estimated that 3.1 million to 14.9 million households would not have enough credit to purchase a new car under the 2025 CAFE standards.[34] This impact would fall disproportionately on poorer households and force the use of older cars with higher maintenance costs and with fuel economy that is generally lower than that of new cars.

CAFE standards may also have redistributed corporate profits to foreign automakers and away from Ford, General Motors (GM), and Chrysler (the Big Three), because foreign-headquartered firms tend to specialize in vehicles that are favored under the new standards.[35] 

Conclusion

CAFE standards are costly, inefficient, and ineffective regulations. They severely limit consumers’ ability to make their own choices concerning safety, comfort, affordability, and efficiency. Originally based on the belief that consumers undervalued fuel economy, the standards have morphed into climate control mandates. Under any justification, regulation gives the desires of government regulators precedence over those of the Americans who actually pay for the cars. Since the regulators undervalue the well-being of American consumers, the policy outcomes are predictably harmful.

CanAm Bucks the Trend

Hidden amid reports of recent warmest months and years based on global averages, there is a significant departure in North America. Those of us living in Canada and USA have noticed a distinct cooling, and our impressions are not wrong.

The image above shows how much lower have been April 2018 temperatures. The table below provides the numbers behind the graphs from NOAA State of the Climate.

CONTINENT ANOMALY (1910-2000) TREND (1910-2018) RANK RECORDS
°C °F °C °F (OUT OF 109 YEARS) YEAR(S) °C °F
North America -0.97 -1.75 0.11 0.19 Warmest 94ᵗʰ 2010 2.65 4.77
South America 1.34 2.41 0.13 0.24 Warmest 1ˢᵗ 2018 1.34 2.41
Europe 2.82 5.08 0.14 0.25 Warmest 1ˢᵗ 2018 2.82 5.08
Africa 1.23 2.21 0.12 0.22 Warmest 5ᵗʰ 2016 1.72 3.1
Asia 1.66 2.99 0.18 0.32 Warmest 9ᵗʰ 2016 2.4 4.32
Oceania 2.47 4.45 0.14 0.25 Warmest 2ⁿᵈ 2005 2.54 4.57

The table shows how different was the North American experience: 94th out of 109 years.  But when we look at the first four months of the year, the NA is more in line with the rest of the globe.


As the image shows, cooling was more widespread during the first third of 2018, particularly in NA, Northern Europe and Asia, as well as a swath of cooler mid ocean latitudes in the Southern Hemisphere.

CONTINENT ANOMALY (1910-2000) TREND (1910-2018) RANK RECORDS
°C °F °C °F (OUT OF 109 YEARS) YEAR(S) °C °F
North America 0.44 0.79 0.16 0.29 Warmest 44ᵗʰ 2016 2.71 4.88
South America 0.94 1.69 0.13 0.24 Warmest 6ᵗʰ 2016 1.39 2.5
Europe 1.35 2.43 0.13 0.24 Warmest 13ᵗʰ 2014 2.46 4.43
Africa 1.08 1.94 0.1 0.18 Warmest 3ʳᵈ 2010 1.62 2.92
Asia 1.57 2.83 0.19 0.34 Warmest 8ᵗʰ 2002 2.72 4.9
Oceania 1.58 2.84 0.12 0.22 Warmest 1ˢᵗ 2018 1.58 2.84

The table confirms that Europe and Asia are cooler in 2018 than recent years in the decade.

Summary

These data show again that temperature indicators of climate are not global but regional, and even local in their manifestations.  At the continental level there are significant differences.  North America is an outlier, but who is to say whether it is an aberration that will join the rest, or whether it is the trend setter signaling a widespread cooler future.

On Coercive Climatism: Writings of Bruce Pardy

gettyimages-500971746Many people have heard of Jordan Peterson due to his battles against post modernism and progressive social justice warfare. Bruce Pardy is another outspoken Canadian professor, whose latest statement was posted at the National Post, H/T GWPF.

Let the Paris climate deal die. It was never good for anything, anyway
Opinion: Paris is a climate fairy tale. It has always been more about money and politics than the environment.  Excerpts below with my bolds.

Paris is more a movement than a legal framework. It imagines the world as a global community working in solidarity on a common problem, making sacrifices in the common good, reducing inequality and transcending the negative effects of market forces. In this fable, climate change is a catalyst for revolution. It is the monster created by capitalism that will turn on its creator and bring the market system to the end of its natural life. A new social order will emerge in which market value no longer determines economic decisions. Governments will exercise influence over economic behaviour by imposing “market-based mechanisms” such as carbon taxes and cap-and-trade systems. Enlightened leaders will direct energy use based upon social justice values and community needs. An international culture will unite peoples in a cause that transcends their national interests, giving way to the next stage of human society. Between the lines of the formal text, the Paris agreement reads like a socialist nightmare.

The regime attempts to establish an escalating global norm that requires continual updating, planning and negotiation. To adhere, governments are to supervise, regulate and tax the energy use and behaviour of their citizens (for example, the Trudeau government’s insistence that all provinces impose a carbon tax or the equivalent, to escalate over time.) Yet for all of the domestic action it legitimizes, Paris does not actually require it. Like the US$100-billion pledge, reduction targets are outside the formal Paris agreement. They are voluntary; neither binding nor enforceable. Other countries have condemned Trump’s withdrawal and reaffirmed their commitment to Paris but many of them, including Canada, are not on track to meet even their initial promises. Global emissions are rising again.

If human action is not causing the climate to change, Paris is irrelevant. If it is, then Paris is an obstacle to actual solutions. If there is a crisis, it will be solved when someone develops a low-carbon energy source as useful and cheap as fossil fuels. A transition will then occur without government interventions and international declarations. Until then, Paris will fix nothing. It serves interests that have little to do with atmospheric concentrations of greenhouse gases. Will America’s repudiation result in its eventual demise? One can hope.

Bruce Pardy belongs to the Faculty of Law, Queen’s College, Kingston, Ontario. This post will provide excerpts from several of Pardy’s writings to give readers access to his worldview and its usefulness making sense of current socio-political actions.

In 2009 Pardy wrote Climate Change Charades: False Environmental Pretences of Statist Energy Governance
The Abstract:
Climate change is a poor justification for energy statism, which consists of centralized government administration of energy supplies, sources, prices, generating facilities, production and conservation. Statist energy governance produces climate change charades: government actions taken in the name of climate change that bear little relationship to the nature of the problem. Such actions include incremental, unilateral steps to reduce domestic carbon emissions to arbitrary levels, and attempts to choose winners and losers in future technology, using public money to subsidize ineffective investments. These proffered solutions are counter-productive. Governments abdicate their responsibility to govern energy in a manner that is consistent with domestic legal norms and competitive markets, and make the development of environmental solutions less likely rather than more so.

Pardy also spoke out in support of Peterson and against the Canadian government legislation proscribing private speech between individuals. His article in National Post was Meet the new ‘human rights’ — where you are forced by law to use ‘reasonable’ pronouns

Human rights were conceived to liberate. They protected people from an oppressive state. Their purpose was to prevent arbitrary arrest and detention, torture, and censorship, by placing restraints on government. The state’s capacity to accommodate these “negative rights” was unlimited, since they required only that people be left alone.

If only arm twisting were prohbited beyond the ring.

But freedom from interference is so 20th century. Modern human rights entitle. We are in the middle of a culture war, and human rights have become a weapon to normalize social justice values and to delegitimize competing beliefs. These rights are applied against other people to limit their liberties.

Freedom of expression is a traditional, negative human right. When the state manages expression, it threatens to control what we think. Forced speech is the most extreme infringement of free speech. It puts words in the mouths of citizens and threatens to punish them if they do not comply. When speech is merely restricted, you can at least keep your thoughts to yourself. Compelled speech makes people say things with which they disagree.

Some senators expressed the view that forcing the use of non-gendered pronouns was reasonable because calling someone by their preferred pronoun is a reasonable thing to do. That position reflects a profound misunderstanding of the role of expression in a free society. The question is not whether required speech is “reasonable” speech. If a statute required people to say “hello,” “please” and “thank you,” that statute would be tyrannical, not because “hello,” “please” and “thank you” aren’t reasonable things to say, but because the state has dictated the content of private conversation.

Traditional negative human rights give people the freedom to portray themselves as they wish without fearing violence or retribution from others. Everyone can exercise such rights without limiting the rights of others. Not so the new human rights. Did you expect to decide your own words and attitudes? If so, human rights are not your friend.

These positions derive from bedrock reasoning by Pardy on the foundations of law and legitimacy. An insight into his thinking is his rebuttal of a critic The Only Legitimate Rule: A Reply to MacLean’s Critique of Ecolawgic Dalhousie Law Journal, Spring 2017

Ecosystem as One model of Society

An ecosystem is not a thing. It does not exist as a concrete entity. “Ecosystem” is a label for the dynamics that result when organisms interact with each other and their environment. Those dynamics occur in infinite variation, but always reflect the same logic:
Competition for scarce resources leads to natural selection, where those organisms better adapted to ecosystem conditions survive and reproduce, leading to evolutionary change. All participants are equally subject to their forces; systems do not play favourites.

In ecosystems, the use of the word “autonomy” does not mean legally enforced liberty but the reverse: no externally imposed rules govern behaviour. In ecosystems unmanaged by people, organisms can succeed or fail, live or die, as their genetically determined physiology and behaviour allow. Every life feeds on the death of others, whether animal or plant, and those better adapted to their circumstances survive to reproduce. Organisms can do anything that their genes dictate, and their success or failure is the consequence that fuels evolution.

When an antelope is chased by a lion and plunges into a river to escape, that action allows the antelope to survive and thus to reproduce. The offspring may carry a genetic disposition to run into water when chased by predators. There are no committees of either antelopes or humans deciding how antelopes will behave. Autonomy in ecosystems is not a human creation. It is not based upon human history or culture and is not a human preference.

Market as a Different Model of Society

A market is not a thing either. Nor is it a place. Markets, like ecosystems, do not exist as concrete entities. “Market” is a label for the dynamics that result when people exchange with each other. Bargains may be commercial in nature, where things are bought and sold, but they also occur in other facets of life. For example, in Ecolawgic I suggested that marriage is a kind of exchange that is made when people perceive themselves better off to enter into the bargain than not to.

As I said in Ecolawgic, “Laws and governments can make markets more stable and efficient, such as by enforcing contracts and creating a supply of money, but they create neither the activity of trading nor the market dynamics that the transactions create.”  A market is not a place or a legal structure but the dynamics of a collection of transactions. It does not exist before or independently of the transactions within it. The transactions make the market. Transactions are not created by governments but by the parties who enter into them.

People transact whether they are facilitated by governments or not. The evidence is everywhere. If it were not so, human beings would not have bartered long before there were governments to create money and enforce contracts. During Prohibition, no alcohol would have been produced and sold. Citizens of the Soviet Union would not have exchanged goods. Today there would be no drug trade, no black market and no smuggling. Cigarettes would not be used as currency inside jails. People would not date, hold garage sales or trade hockey cards. There would be no Bitcoin or barter. Try prohibiting people from transacting and see that they will transact anyway. They will do so because they perceive themselves as better off. Sometimes the benefit is concrete and sometimes it is ethereal. The perception of benefit is personal and subjective.

Ecosystems are Coercive, Markets are Voluntary

Ecosystems and markets share many features but they differ in one important respect. Violence plays an important role in ecosystems but is not a part of voluntary market exchange. Ecosystems are arenas for mortal combat. Lions eat antelopes if they can catch them. Nothing prevents taking a dead antelope from a lion except the lion’s response. There are no restrictions on survival strategies, and organisms do not respect the interests, habitats or lives of other organisms.

Markets, in contrast, proceed upon the judgment of the transacting parties that they are better off to trade than to fight. The hunter did not shoot the woodworker to get chairs, and the woodworker traded for meat instead of stealing it. They chose to trade because it made them better off than fighting. The reasons are their own. Perhaps they were friends, colleagues or allies. Perhaps they believed that harming other people is wrong. Perhaps they hoped to have an ongoing trading relationship. Perhaps fighting carried risks that were too high and they feared injury or retribution. Perhaps trading was less work than fighting.

For whatever reason, they chose to trade. This choice is not universal. People have traded throughout human history, but they have also fought. I do not maintain that trading is any more “natural” or inbred than fighting, but neither is it is less so. When people choose to fight, they are no longer part of a market. Markets are like ecosystems with the violence removed.  They are the kinder, gentler version of ecosystems.

There are only two models for legal governance and only one legitimate rule.

The logic is as follows:
1. In the wild, organisms compete for scarce resources. Those organisms better adapted to conditions survive and reproduce. Their interactions constitute ecosystems. No legal rules govern behaviour and might is right.
2. Human beings trade spontaneously. Parties enter into transactions when they perceive themselves as better off to trade than to fight. Their transactions constitute markets.
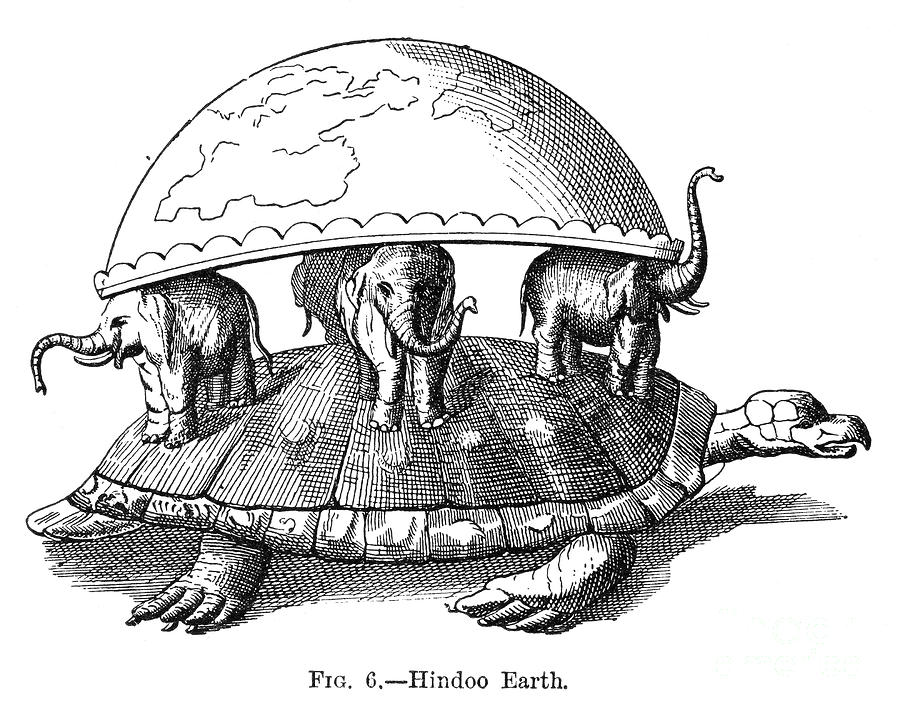
3. Moral values and policy goals are preferences whose inherent validity cannot be established. They are turtles all the way down. Therefore laws based upon those preferences lack legitimacy.
4. When governments use might to impose laws and policies that are illegitimate, they unintentionally imitate ecosystems, where might is right. Political constituencies use whatever means necessary to impose their preferences, and their opponents use whatever means necessary to resist. They are “autonomous” in the ecosystem sense: there are no inherently valid restrictions on behaviour. The result is a social order of division and conflict.
5. The alternative is to model human governance on the other system that exists independently of state preference: markets. If the model for human governance is markets, interactions between people are voluntary. People are “autonomous” in the market sense: they may pursue their own interests without coercion. Instead of imposing illegitimate rules and policies, the state uses force only to prohibit people from imposing force on each other. A plethora of sub-rules follow as corollaries of the rule against coercion: property, consent, criminal offences that punish violence and so on.
6. There is no third choice. Coercion is not right or wrong depending upon the goals being pursued since those goals are merely preferences. Their advocates cannot establish that their goals have inherent validity to those who do not agree. Therefore, giving priority to those objectives is to assert that might is right. If might is right, we are back to ecosystems, where any and all actions are legitimate.
7. If might is right, anything goes, and the model is ecosystems. If might is not right, force is prohibited, and the model is markets. Choose one and all else follows.

When I claim that a prohibition on force is the only legitimate rule, I mean the only substantive rule to govern relations between competent adults. No doubt the administration of a legal system, even a minimalist one, would require other kinds of laws to function. Constitutional rules, court administration, the conduct of elections and procedures to bring legal proceedings are a few of the other categories that would be necessary in order to give effect to the general rule.

No Property, No Market

But the existence of property rights must follow from a general rule prohibiting coercion. If it does not, the general rule is not what it purports to be. When people trade, they recognize the property interest held by the other party. It is that interest that they wish to obtain. When the woodworker trades chairs for the hunter’s meat, she trades “her” chairs for “his” meat. The trade would not occur without a mutual understanding of the possession that both hold over their respective stuff.

Sometimes those interests are recognized and protected by the law, which according to Bentham created the property. However, since markets arise even where no property is legally recognized, the notion of property must be prior to the law. Above I gave examples of markets that have arisen where no legal regime has protected property rights: prehistorical trade, alcohol sales during Prohibition, black markets in the Soviet Union, the modern day drug trade, smuggling of illicit goods, and the internal markets of prisons. Since trading occurs even in the absence of an approving legal regime, the notion of property must exist independently as well.

No Consent, No Market

Autonomy in the market sense means to be able to pursue your own interests and control your own choices without coercion. Consent is part and parcel of autonomy. Without the ability to consent, no trades can be made. Without trades, no markets exist. If one cannot consent to be touched, to give up property, to make bargains, to mate, to arm wrestle, to trade chairs for meat, to sell labour for money, and so on, then one is not autonomous.

If force is prohibited, then corollaries are laws that protect people from having force imposed upon them. Laws apply the force of the state to prevent or punish the application of force. A criminal law that prohibits assault is an extension of the general rule. A tax to finance the police department is legitimate if its purpose is to investigate and prosecute violent crimes. Traffic laws prevent people from running each other over.  Civil liability compensates for physical injuries caused by the force of others.

Illegitimate Laws, No Market

Illegitimate laws use state coercion to seek other ends such as enforcing moral standards, pursuing social goals or saving people from themselves. A criminal law that prohibits the use of drugs uses state force to prevent an activity in which there is no coercion. A tax to fund the armed forces to protect the peace may be legitimate, but one to take wealth from Peter to give to Paul is not. The legal regimes of modern administrative states consist largely of instrumentalist laws and policies that are inconsistent with the general rule, including tax laws, economic development programs, bankruptcy, patent regimes, mandatory government-run pension plans and MacLean’s version of environmental regulation, in which each decision turns on a political determination of the values to be applied.

It is either ecosystems or markets. Either might is right or it is not. If it is, then human society is subject to the law of the jungle where people are at liberty to fight like animals if they choose to do so. If it is not, then human society is a marketplace where people may enter into transactions voluntarily and the state may justifiably use force only to prevent or punish the application of force.

There is no third choice. Some might insist that coercion is not categorically wrong but that it can be right or wrong depending upon the other goals to be pursued. Those goals are merely preferences. They are turtles all the way down. I do not maintain that other rules will not be passed and enforced using the established machinery of government but only that they have no claim to legitimacy, any more than other rules that might have been chosen instead. If force is used to pursue those preferences, why would others not use force to resist? Such a choice results in a free-for-all. If state force is right only because it cannot be resisted, that means that might is right. The administrative welfare state prevails not because it is justified morally or socially but because it has managed to secure a monopoly on violence. The imposition of government preferences is an invitation to those opposed to an arbitrary policy agenda to take up force against it.

Summary

In  a way, Pardy is warning us not to take for granted the free market social democracies to which we were accustomed.  Post modern progressive social justice warriors have decided that society is essentially an endless power struggle, that one group’s rights are gained only at the expense of another group.  In other words, it’s a dog-eat-dog, might makes right ecosystem.  Pardy says there is another way, which has been the basis for the rise of civilization, but can be reversed by governance that destroys the free market of ideas and efforts by imposing values favored by the rich and powerful.

Footnote about Turtles.  Pardy explains the metaphor:

In Rapanos v. United States, Justice Antonin Scalia offered a version of the traditional tale of how the Earth is carried on the backs of animals. In this version of the story, an Eastern guru affirms that the earth is supported on the back of a tiger.  When asked what supports the tiger, he says it stands upon an elephant; and when asked what supports the elephant he says it is a giant turtle.  When asked, finally, what supports the giant turtle, he is briefly taken aback, but quickly replies “Ah, after that it is turtles all the way down.”

Saving the Internet is like Saving the Climate


Some striking parallels appear in the fights over “net neutrality” and “climate change.” Firstly, both issues are mostly political. Politicians like those above alarmed over the internet are the same ones alarmed about the climate.  (Pictured are Democrat senators Franken, Sanders, Booker and Markey.)

Then there is the comparison that both concerns involve a fear of the future. Impressionable youngsters and others have been told they have a right to a “stable climate” and to “net neutrality.” Advocates ignore how benign and conveniently warming has been our climate since 1850, but assure us that extreme heat and dire consequences surely lie ahead. The same politicians ignore the fact the internet worked amazing well prior to the Obama 2015 Internet Order, and brought great innovation and affordable services without heavy-handed regulations.

The proposed policies are also comparable. Evil corporations can not be trusted to deal fairly with their customers and must be controlled by government bureaucracy. Laws must be written to dictate to network operators what they can offer and what prices they can demand. Fossil fuel producers must be hounded, sued, taxed, and constrained by any means possible.

Also underneath the simplistic political positions, there are technical complexities and realities overlooked in the rush to enact “solutions.” I have read and posted a lot on global warming/climate change and know how unfounded are the alarmist claims. So I am inclined to be skeptical when the same people harp about the internet.

In the last few days, some things appear true to me. Prior to 2015 the FCC  classified the internet as a Title I service and all the growth and innovation happened under that “light-touch” regulation. The 2015 FCC Internet Order under the Obama administration reclassified the Internet as Title II, mandating “heavy-handed” regulation, including price controls and even the potential for taxes to pay for regulatory costs. This move was justified to protect consumers against discrimination by providers.  That order is now being repealed by the present Trump-appointed FCC head.

Skeptics pointed at the time that Title II worked extremely well to protect telephone monopolies and prevent innovation for decades. Notice that AT&T is in full support of restoring Title II regulation. Smart phones and Voice Over Internet escaped Title II regulation, and who knows what future inventions will come without government interference.

We can also see virtue signaling on display in both campaigns. The Senate action this week is unlikely to succeed, but the point was always to rally the faithful for the mid-term elections. Underneath the feel-good notion of net neutrality is the impulse to control and limit choices by putting bureaucrats in charge.

Everyone wants the same thing: Free competition so that the best ideas and services can rise and prosper, privacy so that personal information can not be exploited against one’s interests, and freedom to choose and to pay accordingly. But how to get there? Going back to the 2010 FCC Internet Order is a good start, which is the result of the recent FCC decision.

In both climate and internet issues, there are important matters to address by means of facts and analysis rather than knee-jerk politics. Rolling out widely accessible broadband networks is expensive and won’t happen if builders and operators are unprofitable. And based on past experience, it will also not work as a government project. As for climate, officials should be more humble. No one knows what future weather will be, and most likely there will be both periods colder and warmer than the present. The proper role of government is not to attempt control of the weather, but to prepare for the contingencies with robust infrastructure and reliable, affordable energy.

Some sources:

Forbes:  The FCC’s Net Neutrality Repeal: The End Of The Internet Or A Path To A Legislative Compromise?

Mediashift: Your Guide to Net Neutrality (2018 Edition) 

Boston Globe:  The real reason the Net neutrality fight goes on

American Consumer Institute:  Did the FCC Lie about Net Neutrality? (2015)

Forbes:  Am I The Only Techie Against Net Neutrality? (2014)

Journal on Telecom and High Tech Law:  Unintended Consequences of Net Neutrality Regulation   (2007)


Correcting Flaws in Global Warming Projections

William Mason Gray (1929-2016), pioneering hurricane scientist and forecaster and professor of atmospheric science at Colorado State University.

Thanks to GWPF for publishing posthumously Bill Gray’s understanding of global warming/climate change.  The paper was compiled at his request, completed and now available as Flaws in applying greenhouse warming to Climate Variability This post provides some excerpts in italics with my bolds and some headers.  Readers will learn much from the entire document (title above is link to pdf).

The Fundamental Correction

The critical argument that is made by many in the global climate modeling (GCM) community is that an increase in CO2 warming leads to an increase in atmospheric water vapor, resulting in more warming from the absorption of outgoing infrared radiation (IR) by the water vapor. Water vapor is the most potent greenhouse gas present in the atmosphere in large quantities. Its variability (i.e. global cloudiness) is not handled adequately in GCMs in my view. In contrast to the positive feedback between CO2 and water vapor predicted by the GCMs, it is my hypothesis that there is a negative feedback between CO2 warming and and water vapor. CO2 warming ultimately results in less water vapor (not more) in the upper troposphere. The GCMs therefore predict unrealistic warming of global temperature. I hypothesize that the Earth’s energy balance is regulated by precipitation (primarily via deep cumulonimbus (Cb) convection) and that this precipitation counteracts warming due to CO2.

Figure 14: Global surface temperature change since 1880. The dotted blue and dotted red lines illustrate how much error one would have made by extrapolating a multi-decadal cooling or warming trend beyond a typical 25-35 year period. Note the recent 1975-2000 warming trend has not continued, and the global temperature remained relatively constant until 2014.

Projected Climate Changes from Rising CO2 Not Observed

Continuous measurements of atmospheric CO2, which were first made at Mauna Loa, Hawaii in 1958, show that atmospheric concentrations of CO2 have risen since that time. The warming influence of CO2 increases with the natural logarithm (ln) of the atmosphere’s CO2 concentration. With CO2 concentrations now exceeding 400 parts per million by volume (ppm), the Earth’s atmosphere is slightly more than halfway to containing double the 280 ppm CO2 amounts in 1860 (at the beginning of the Industrial Revolution).∗

We have not observed the global climate change we would have expected to take place, given this increase in CO2. Assuming that there has been at least an average of 1 W/m2 CO2 blockage of IR energy to space over the last 50 years and that this energy imbalance has been allowed to independently accumulate and cause climate change over this period with no compensating response, it would have had the potential to bring about changes in any one of the following global conditions:

  • Warm the atmosphere by 180◦C if all CO2 energy gain was utilized for this purpose – actual warming over this period has been about 0.5◦C, or many hundreds of times less.
  • Warm the top 100 meters of the globe’s oceans by over 5◦C – actual warming over this period has been about 0.5◦C, or 10 or more times less.
  • Melt sufficient land-based snow and ice as to raise the global sea level by about 6.4 m. The actual rise has been about 8–9 cm, or 60–70 times less. The gradual rise of sea level has been only slightly greater over the last ~50 years (1965–2015) than it has been over the previous two ~50-year periods of 1915–1965 and 1865–1915, when atmospheric CO2 gain was much less.
  • Increase global rainfall over the past ~50-year period by 60 cm.

Earth Climate System Compensates for CO2

If CO2 gain is the only influence on climate variability, large and important counterbalancing influences must have occurred over the last 50 years in order to negate most of the climate change expected from CO2’s energy addition. Similarly, this hypothesized CO2-induced energy gain of 1 W/m2 over 50 years must have stimulated a compensating response that acted to largely negate energy gains from the increase in CO2.

The continuous balancing of global average in-and-out net radiation flux is therefore much larger than the radiation flux from anthropogenic CO2. For example, 342 W/m2, the total energy budget, is almost 100 times larger than the amount of radiation blockage expected from a CO2 doubling over 150 years. If all other factors are held constant, a doubling of CO2 requires a warming of the globe of about 1◦C to enhance outward IR flux by 3.7 W/m2 and thus balance the blockage of IR flux to space.

Figure 2: Vertical cross-section of the annual global energy budget. Determined from a combination of satellite-derived radiation measurements and reanalysis data over the period of 1984–2004.

This pure IR energy blocking by CO2 versus compensating temperature increase for radiation equilibrium is unrealistic for the long-term and slow CO2 increases that are occurring. Only half of the blockage of 3.7 W/m2 at the surface should be expected to go into an temperature increase. The other half (about 1.85 W/m2) of the blocked IR energy to space will be compensated by surface energy loss to support enhanced evaporation. This occurs in a similar way to how the Earth’s surface energy budget compensates for half its solar gain of 171 W/m2 by surface-to-air upward water vapor flux due to evaporation.

Assuming that the imposed extra CO2 doubling IR blockage of 3.7 W/m2 is taken up and balanced by the Earth’s surface in the same way as the solar absorption is taken up and balanced, we should expect a direct warming of only ~0.5◦C for a doubling of CO2. The 1◦C expected warming that is commonly accepted incorrectly assumes that all the absorbed IR goes to the balancing outward radiation with no energy going to evaporation.

Consensus Science Exaggerates Humidity and Temperature Effects

A major premise of the GCMs has been their application of the National Academy of Science (NAS) 1979 study3 – often referred to as the Charney Report – which hypothesized that a doubling of atmospheric CO2 would bring about a general warming of the globe’s mean temperature of 1.5–4.5◦C (or an average of ~3.0◦C). These large warming values were based on the report’s assumption that the relative humidity (RH) of the atmosphere remains quasiconstant as the globe’s temperature increases. This assumption was made without any type of cumulus convective cloud model and was based solely on the Clausius–Clapeyron (CC) equation and the assumption that the RH of the air will remain constant during any future CO2-induced temperature changes. If RH remains constant as atmospheric temperature increases, then the water vapor content in the atmosphere must rise exponentially.

With constant RH, the water vapor content of the atmosphere rises by about 50% if atmospheric temperature is increased by 5◦C. Upper tropospheric water vapor increases act to raise the atmosphere’s radiation emission level to a higher and thus colder level. This reduces the amount of outgoing IR energy which can escape to space by decreasing T^4.

These model predictions of large upper-level tropospheric moisture increases have persisted in the current generation of GCM forecasts.§ These models significantly overestimate globally-averaged tropospheric and lower stratospheric (0–50,000 feet) temperature trends since 1979 (Figure 7).

Figure 8: Decline in upper tropospheric RH. Annually-averaged 300 mb relative humidity for the tropics (30°S–30°N). From NASA-MERRA2 reanalysis for 1980–2016. Black dotted line is linear trend.

All of these early GCM simulations were destined to give unrealistically large upper-tropospheric water vapor increases for doubling of CO2 blockage of IR energy to space, and as a result large and unrealistic upper tropospheric temperature increases were predicted. In fact, if data from NASA-MERRA24 and NCEP/NCAR5 can be believed, upper tropospheric RH has actually been declining since 1980 as shown in Figure 8. The top part of Table 1 shows temperature and humidity differences between very wet and dry years in the tropics since 1948; in the wettest years, precipitation was 3.9% higher than in the driest ones. Clearly, when it rains more in the tropics, relative and specific humidity decrease. A similar decrease is seen when differencing 1995–2004 from 1985–1994, periods for which the equivalent precipitation difference is 2%. Such a decrease in RH would lead to a decrease in the height of the radiation emission level and an increase in IR to space.

The Earth’s natural thermostat – evaporation and precipitation

What has prevented this extra CO2-induced energy input of the last 50 years from being realized in more climate warming than has actually occurred? Why was there recently a pause in global warming, lasting for about 15 years?  The compensating influence that prevents the predicted CO2-induced warming is enhanced global surface evaporation and increased precipitation.

Annual average global evaporational cooling is about 80 W/m2 or about 2.8 mm per day.  A little more than 1% extra global average evaporation per year would amount to 1.3 cm per year or 65 cm of extra evaporation integrated over the last 50 years. This is the only way that such a CO2-induced , 1 W/m2 IR energy gain sustained over 50 years could occur without a significant alteration of globally-averaged surface temperature. This hypothesized increase in global surface evaporation as a response to CO2-forced energy gain should not be considered unusual. All geophysical systems attempt to adapt to imposed energy forcings by developing responses that counter the imposed action. In analysing the Earth’s radiation budget, it is incorrect to simply add or subtract energy sources or sinks to the global system and expect the resulting global temperatures to proportionally change. This is because the majority of CO2-induced energy gains will not go into warming the atmosphere. Various amounts of CO2-forced energy will go into ocean surface storage or into ocean energy gain for increased surface evaporation. Therefore a significant part of the CO2 buildup (~75%) will bring about the phase change of surface liquid water to atmospheric water vapour. The energy for this phase change must come from the surface water, with an expenditure of around 580 calories of energy for every gram of liquid that is converted into vapour. The surface water must thus undergo a cooling to accomplish this phase change.

Therefore, increases in anthropogenic CO2 have brought about a small (about 0.8%) speeding up of the globe’s hydrologic cycle, leading to more precipitation, and to relatively little global temperature increase. Therefore, greenhouse gases are indeed playing an important role in altering the globe’s climate, but they are doing so primarily by increasing the speed of the hydrologic cycle as opposed to increasing global temperature.

Figure 9: Two contrasting views of the effects of how the continuous intensification of deep
cumulus convection would act to alter radiation flux to space.
The top (bottom) diagram represents a net increase (decrease) in radiation to space

Tropical Clouds Energy Control Mechanism

It is my hypothesis that the increase in global precipitation primarily arises from an increase in deep tropical cumulonimbus (Cb) convection. The typical enhancement of rainfall and updraft motion in these areas together act to increase the return flow mass subsidence in the surrounding broader clear and partly cloudy regions. The upper diagram in Figure 9 illustrates the increasing extra mass flow return subsidence associated with increasing depth and intensity of cumulus convection. Rainfall increases typically cause an overall reduction of specific humidity (q) and relative humidity (RH) in the upper tropospheric levels of the broader scale surrounding convective subsidence regions. This leads to a net enhancement of radiation flux to space due to a lowering of the upper-level emission level. This viewpoint contrasts with the position in GCMs, which suggest that an increase in deep convection will increase upper-level water vapour.

Figure 10: Conceptual model of typical variations of IR, albedo and net (IR + albedo) associated with three different areas of rain and cloud for periods of increased precipitation.

The albedo enhancement over the cloud–rain areas tends to increase the net (IR + albedo) radiation energy to space more than the weak suppression of (IR + albedo) in the clear areas. Near-neutral conditions prevail in the partly cloudy areas. The bottom diagram of Figure 9 illustrates how, in GCMs, Cb convection erroneously increases upper tropospheric moisture. Based on reanalysis data (Table 1, Figure 8) this is not observed in the real atmosphere.

Ocean Overturning Circulation Drives Warming Last Century

A slowing down of the global ocean’s MOC is the likely cause of most of the global warming that has been observed since the latter part of the 19th century.15 I hypothesize that shorter multi-decadal changes in the MOC16 are responsible for the more recent global warming periods between 1910–1940 and 1975–1998 and the global warming hiatus periods between 1945–1975 and 2000–2013.

Figure 12: The effect of strong and weak Atlantic THC. Idealized portrayal of the primary Atlantic Ocean upper ocean currents during strong and weak phases of the thermohaline circulation (THC)

Figure 13 shows the circulation features that typically accompany periods when the MOC is stronger than normal and when it is weaker than normal. In general, a strong MOC is associated with a warmer-than-normal North Atlantic, increased Atlantic hurricane activity, increased blocking action in both the North Atlantic and North Pacific and weaker westerlies in the mid-latitude Southern Hemisphere. There is more upwelling of cold water in the South Pacific and Indian Oceans, and an increase in global rainfall of a few percent occurs. This causes the global surface temperatures to cool. The opposite occurs when the MOC is weaker than normal.

The average strength of the MOC over the last 150 years has likely been below the multimillennium average, and that is the primary reason we have seen this long-term global warming since the late 19th century. The globe appears to be rebounding from the conditions of the Little Ice Age to conditions that were typical of the earlier ‘Medieval’ and ‘Roman’ warm periods.

Summary and Conclusions

The Earth is covered with 71% liquid water. Over the ocean surface, sub-saturated winds blow, forcing continuous surface evaporation. Observations and energy budget analyses indicate that the surface of the globe is losing about 80 W/m2 of energy from the global surface evaporation process. This evaporation energy loss is needed as part of the process of balancing the surface’s absorption of large amounts of incoming solar energy. Variations in the strength of the globe’s hydrologic cycle are the way that the global climate is regulated. The stronger the hydrologic cycle, the more surface evaporation cooling occurs, and greater the globe’s IR flux to space. The globe’s surface cools when the hydrologic cycle is stronger than average and warms when the hydrologic cycle is weaker than normal. The strength of the hydrologic cycle is thus the primary regulator of the globe’s surface temperature. Variations in global precipitation are linked to long-term changes in the MOC (or THC).

I have proposed that any additional warming from an increase in CO2 added to the atmosphere is offset by an increase in surface evaporation and increased precipitation (an increase in the water cycle). My prediction seems to be supported by evidence of upper tropospheric drying since 1979 and the increase in global precipitation seen in reanalysis data. I have shown that the additional heating that may be caused by an increase in CO2 results in a drying, not a moistening, of the upper troposphere, resulting in an increase of outgoing radiation to space, not a decrease as proposed by the most recent application of the greenhouse theory.

Deficiencies in the ability of GCMs to adequately represent variations in global cloudiness, the water cycle, the carbon cycle, long-term changes in deep-ocean circulation, and other important mechanisms that control the climate reduce our confidence in the ability of these models to adequately forecast future global temperatures. It seems that the models do not correctly handle what happens to the added energy from CO2 IR blocking.

Figure 13: Effect of changes in MOC: top, strong MOC; bottom weak MOC. SLP: sea level pressure; SST, sea surface temperature.

Solar variations, sunspots, volcanic eruptions and cosmic ray changes are energy-wise too small to play a significant role in the large energy changes that occur during important multi-decadal and multi-century temperature changes. It is the Earth’s internal fluctuations that are the most important cause of climate and temperature change. These internal fluctuations are driven primarily by deep multi-decadal and multi-century ocean circulation changes, of which naturally varying upper-ocean salinity content is hypothesized to be the primary driving mechanism. Salinity controls ocean density at cold temperatures and at high latitudes where the potential deep-water formation sites of the THC and SAS are located. North Atlantic upper ocean salinity changes are brought about by both multi-decadal and multi-century induced North Atlantic salinity variability.

 Footnote:

The main point from Bill Gray was nicely summarized in a previous post Earth Climate Layers

The most fundamental of the many fatal mathematical flaws in the IPCC related modelling of atmospheric energy dynamics is to start with the impact of CO2 and assume water vapour as a dependent ‘forcing’.  This has the tail trying to wag the dog. The impact of CO2 should be treated as a perturbation of the water cycle. When this is done, its effect is negligible. — Dr. Dai Davies

climate-onion2