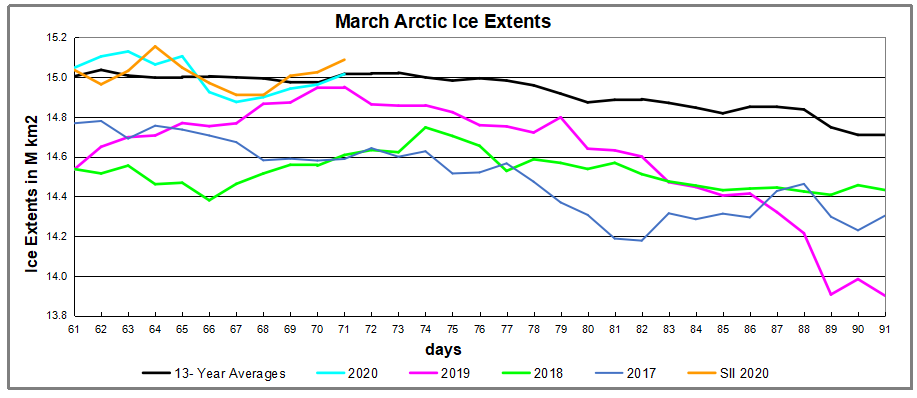
Persisting March Arctic Ice
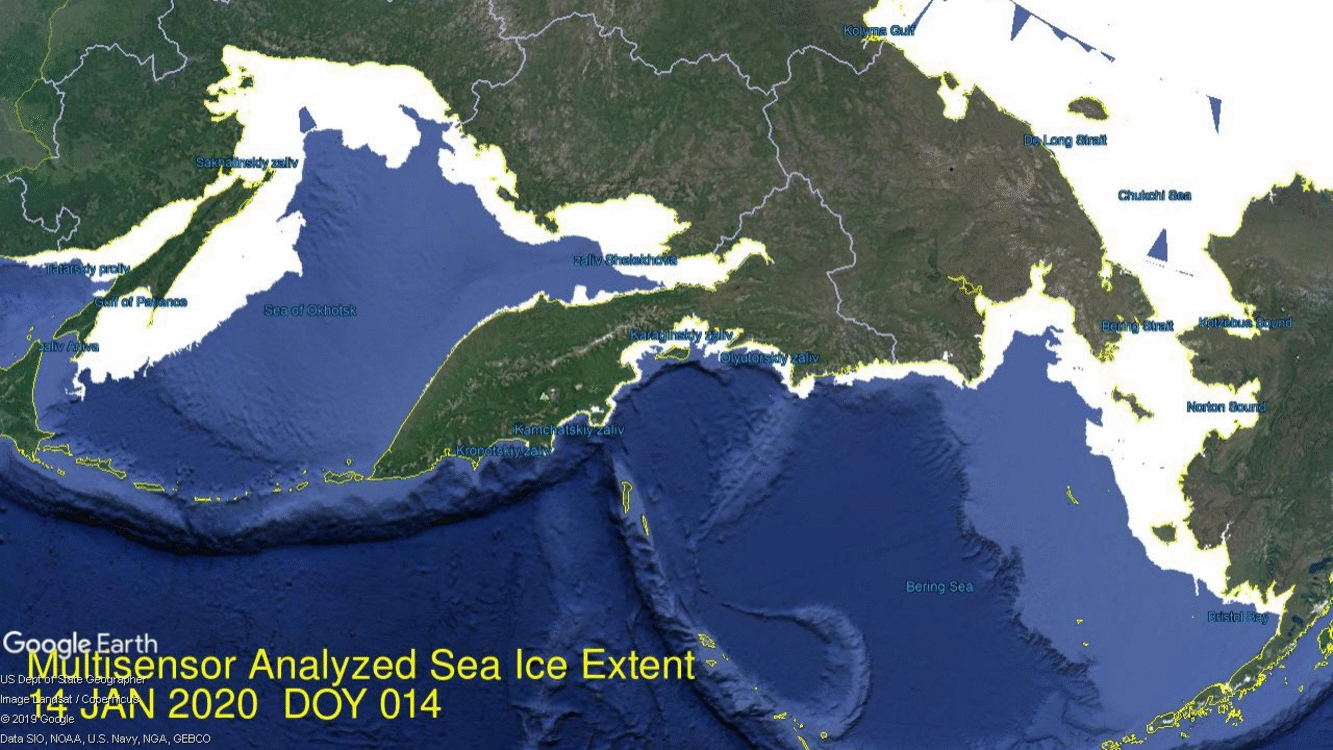
 Previous posts showed 2020 Arctic Ice breaking the 15M km2 ceiling, while wondering whether the ice will have staying power. “Yes” is the answer, at least through the first two-thirds of March. The animation above shows ice extents over the first 20 days of March 2020 in the Pacific basins. Bering Sea on the right grew ice until peaking at 819k km2 on day 71, 44% higher than 2019 Bering maximum. It then declined losing 274k km2 by day 80. Meanwhile Okhotsk Sea on the left lost 100k km2 by day 72 before gaining back 65k km2.
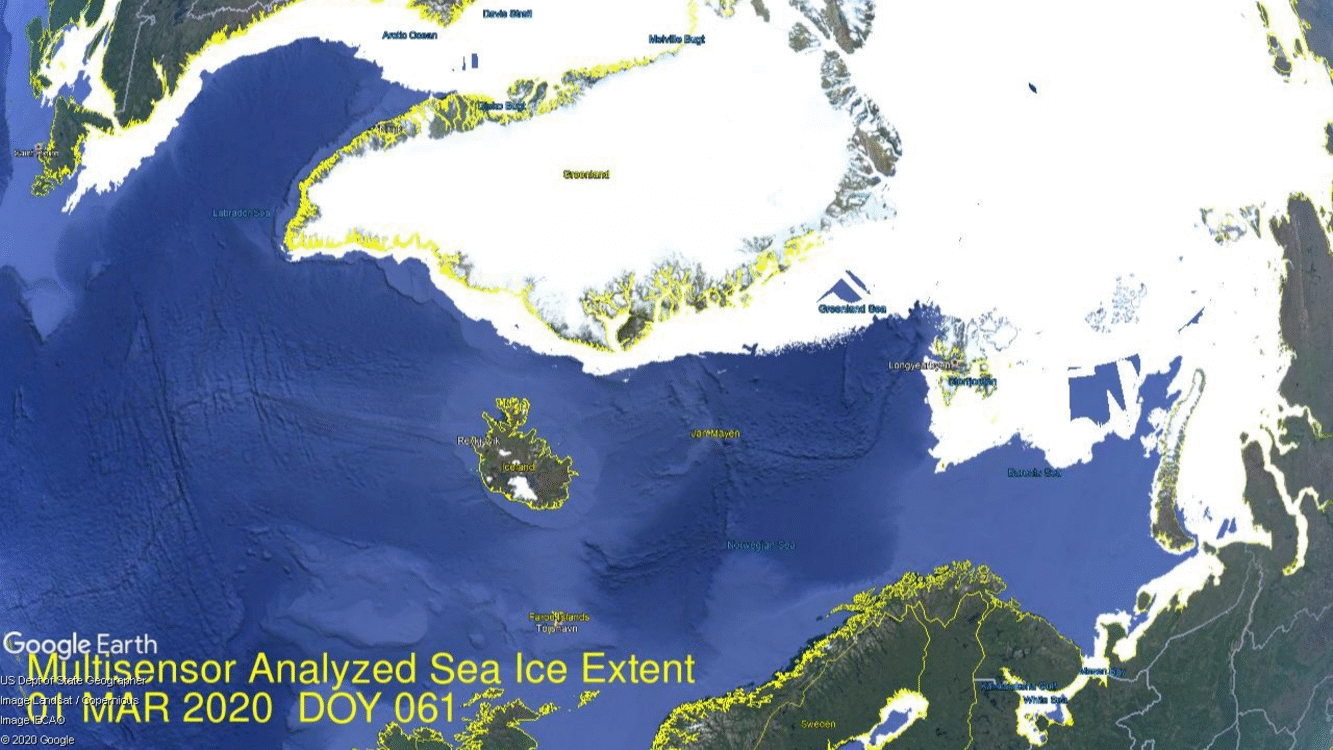
The animation above shows ice extents on the Atlantic side fluctuating and helping offset Pacific ice losses. On the left Baffin Bay and Gulf of St. Lawrence fluctuate but end the period with nearly the same ice as at the beginning. In the center Greenland Sea ice was steady the first week and then added 116k km2 up to day 80. On the right Barents Sea lost 130k km2 up to day 73, then gained 140k km2 back by day 80.

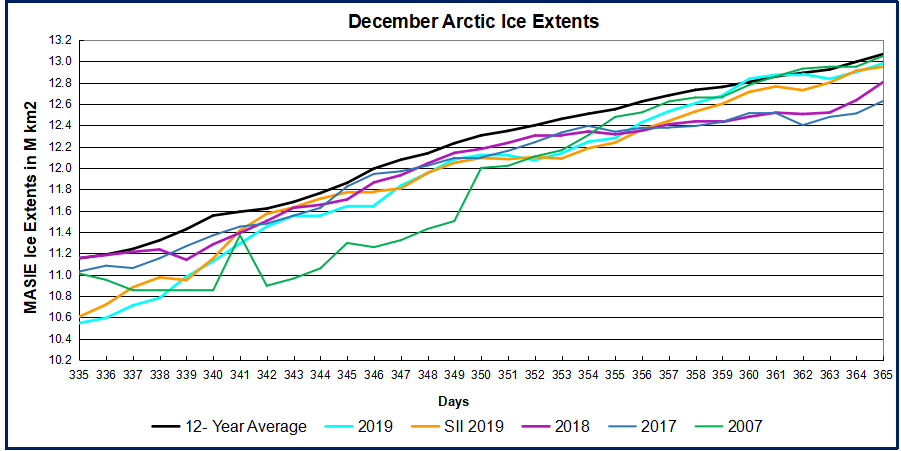
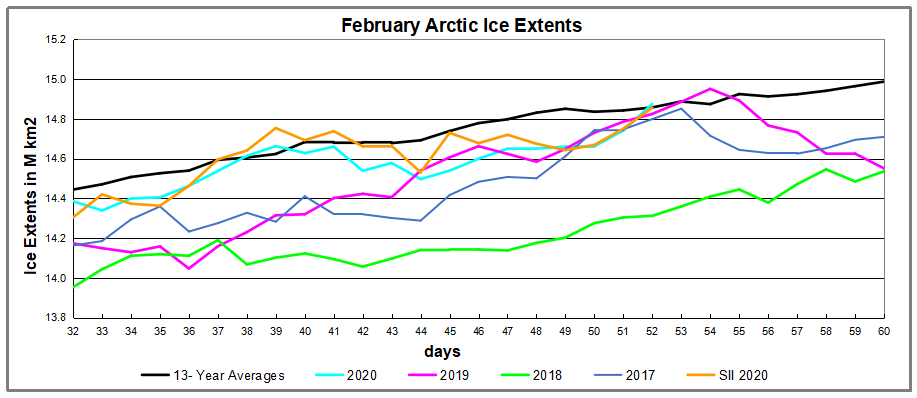
By end of February, ice extent this year was well above the 13- year average, then dipped lower before growing again to match the average and surplus to other years including 2007. This is important since March monthly average is considered the ice extent maximum for the year. Note also that SII is matching and at times exceeds the MASIE estimates.

The chart below shows the distribution of ice across the various regions comprising the Arctic zone.
| Region | 2020080 | Day 080 Average | 2020-Ave. | 2007080 | 2020-2007 |
| (0) Northern_Hemisphere | 14901276 | 14873303 | 27972 | 14547397 | 353879 |
| (1) Beaufort_Sea | 1070655 | 1070207 | 448 | 1069711 | 944 |
| (2) Chukchi_Sea | 966006 | 965780 | 226 | 966006 | 0 |
| (3) East_Siberian_Sea | 1087137 | 1087135 | 3 | 1087137 | 0 |
| (4) Laptev_Sea | 897845 | 897799 | 46 | 897845 | 0 |
| (5) Kara_Sea | 934902 | 917684 | 17218 | 912117 | 22785 |
| (6) Barents_Sea | 749134 | 620285 | 128849 | 583698 | 165436 |
| (7) Greenland_Sea | 688025 | 628250 | 59776 | 606689 | 81336 |
| (8) Baffin_Bay_Gulf_of_St._Lawrence | 1494573 | 1537332 | -42760 | 1392468 | 102105 |
| (9) Canadian_Archipelago | 854282 | 852953 | 1330 | 852767 | 1516 |
| (10) Hudson_Bay | 1260903 | 1260407 | 497 | 1259717 | 1186 |
| (11) Central_Arctic | 3248013 | 3223120 | 24893 | 3239953 | 8060 |
| (12) Bering_Sea | 543951 | 757159 | -213208 | 836184 | -292233 |
| (13) Baltic_Sea | 13401 | 80508 | -67107 | 83894 | -70492 |
| (14) Sea_of_Okhotsk | 1083325 | 958236 | 125089 | 739985 | 343340 |
As of yesterday, Day 2020071 matches the NH 13-year average and also most regions. Bering Sea is the main deficit to average along with Baffin Bay and Baltic Sea. Offsetting surpluses appear in Barents and Okhotsk Seas, as well as Greenland Sea and Central Arctic and Barents Sea. Note Okhotsk sea ice is almost 50% more than the extent in 2007.


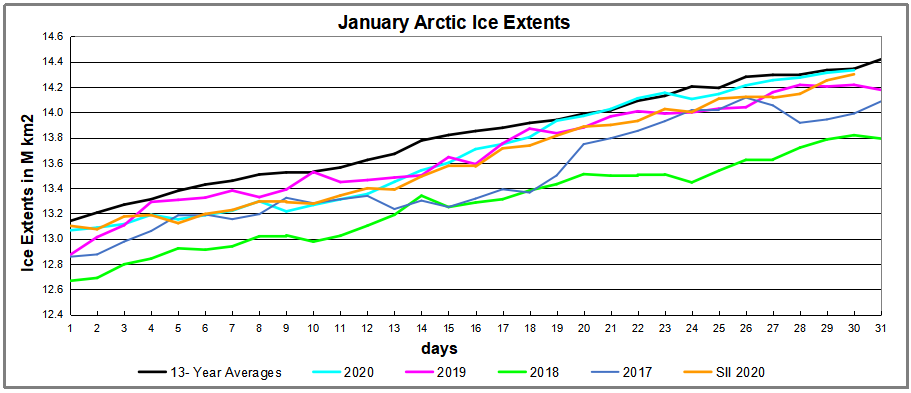


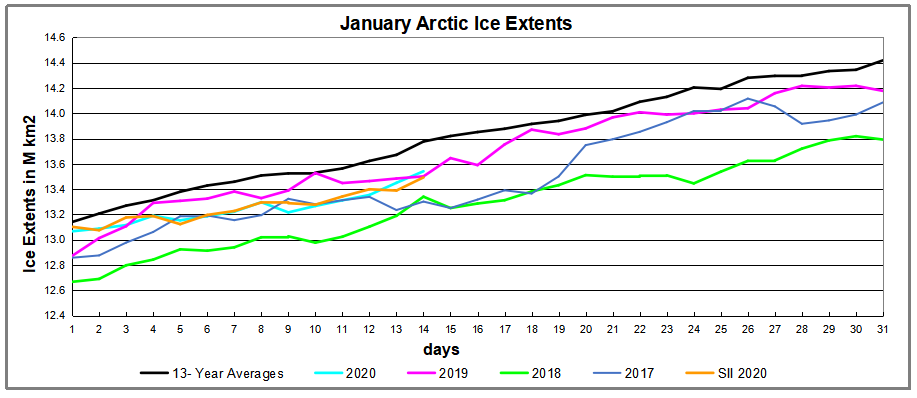
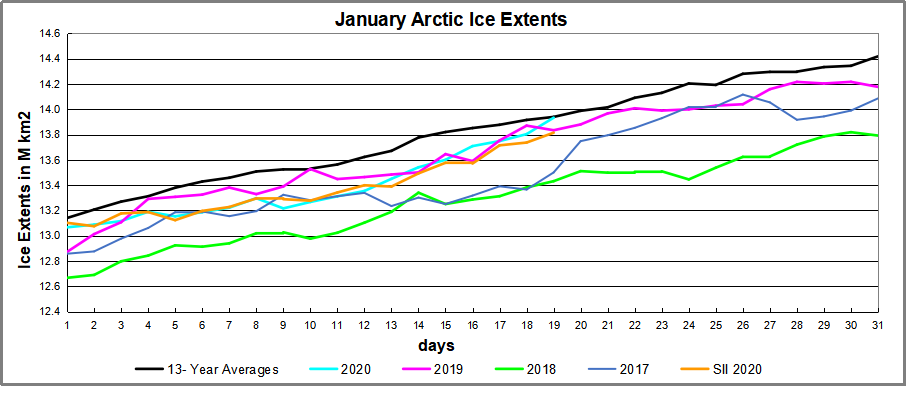
 By January there are not many places where Arctic ice extent can grow. All the Eurasian shelf seas are full, as is the case on the CanAm side: Beaufort, CAA, Hudson Bay covered completely. Barents and Greenland Seas have some room to grow, as does Baffin Bay. But mainly the variability is on the Pacific side, where the usual Bering/Okhotsk see saw is reappearing.